Tag: solar system

  • NASA Accepts Proposals for 2026 Student Launch Challenge 

    3 min read

    Preparations for Next Moonwalk Simulations Underway (and Underwater)

    NASA is kicking off the 2026 Student Launch challenge, looking for new student teams to design, build, and launch high-powered rockets with a scientific or engineering payload next April. 

    The agency is seeking proposals until Monday, Sept. 22. Details about this year’s challenge are in the 2026 handbook, which outlines the requirements for middle school, high school, and college students to participate. After a competitive proposal selection process, selected teams must meet documentation milestones and undergo detailed reviews throughout the activity year. 

    NASA’s Student Launch, a STEM competition, officially kicks off its 26th anniversary with the 2026 handbook.
    NASA’s Student Launch, a STEM competition, officially kicks off its 26th anniversary with the 2026 handbook.

    “These bright students rise to a nine-month challenge for Student Launch that tests their skills in engineering, design, and teamwork,” said Kevin McGhaw, director of NASA’s Office of STEM Engagement Southeast Region. “They are part of the Golden Age of explorers – the future scientists, engineers, and innovators who will lead us into the future of space exploration.”

    Student Launch will culminate with on-site events starting on April 22, 2026. Final launches are scheduled for April 25, at Bragg Farms in Toney, Alabama, near NASA’s Marshall Space Flight Center in Huntsville, Alabama. 

    Each year, NASA updates the university payload challenge to reflect current scientific and exploration missions. For the 2026 season, the payload challenge will take inspiration from the Artemis missions, which seek to explore the Moon for scientific discovery, technology advancement, and to learn how to live and work on another world as we prepare for human missions to Mars. This year’s payload challenge tasks college and university teams with designing, building, and flying a habitat to safely house four STEMnauts – non-living objects representing astronauts – during extended missions. The habitat must include equipment capable of both collecting and testing soil samples to support agricultural research operations.

    Nearly 1,000 students participated in the 2025 Student Launch competition – making up 71 teams from across the United States. Teams launched their rockets to an altitude between 4,000 and 6,000 feet, while attempting to make a successful landing and executing the payload mission.

     Former NASA Marshall Director Art Stephenson started Student Launch in 2000 as a student rocket competition at the center. Just two university teams competed in the inaugural challenge – Alabama A&M University and the University of Alabama in Huntsville. The challenge continues to soar with thousands of students participating in the STEM competition each year, and many going on to a career with NASA.

    NASA Marshall’s Office of STEM Engagement hosts Student Launch to provide students with real-world experiences that encourage them to pursue degrees and careers in science, technology, engineering, and mathematics. Student Launch is one of several NASA Artemis Student Challenges – a variety of activities that expose students to the knowledge and technology required to achieve the goals of the agency’s Artemis campaign. 

    In addition to NASA Office of STEM Engagement’s Next Generation STEM project, NASA Space Operations Mission Directorate, Northrop Grumman, National Space Club Huntsville, American Institute of Aeronautics and Astronautics, National Association of Rocketry, Relativity Space and, Bastion Technologies provide funding and leadership for the Student Launch competition. 

    To learn more about Student Launch, visit: 
    www.nasa.gov/studentlaunch

  • Harmonized Landsat and Sentinel-2: Collaboration Drives Innovation

    Feature Article header

    9 min read

    Harmonized Landsat and Sentinel-2: Collaboration Drives Innovation

    Introduction

    Landsat, a joint program of NASA and the U.S. Geological Survey (USGS), has been an invaluable tool for monitoring changes in Earth’s land surface for over 50 years. Researchers use instruments on Landsat satellites to monitor decades-long trends, including urbanization and agricultural expansion, as well as short-term dynamics, including water use and disaster recovery. However, scientists and land managers often encounter one critical limitation of this program: Landsat has a revisit time of eight days (with Landsat 8 and 9 operating), which is too long to capture events and disasters that occur on short timescales. Floods, for example, can quickly inundate a region, and cloud cover from storms can delay Landsat’s ability to get a clear observation on damage.

    In 2015, the European Space Agency’s (ESA) Copernicus Sentinel-2A mission joined Landsat 7 and 8 in orbit. It was designed to collect comparable optical land data with the intention of leveraging Landsat’s archive. Two years later, ESA launched Sentinel-2B, a satellite identical to Sentinel-2A.

    Led by a science team at NASA’s Goddard Space Flight Center (GSFC), the USGS, NASA, and ESA began to work on combining the capabilities of Sentinel-2 and Landsat satellites. This idea was the impetus behind Harmonized Landsat and Sentinel-2 (HLS) project, a NASA initiative that created a seamless product from the Operational Land Imager (OLI) and Multi-Spectral Instrument (MSI) aboard Landsat and Sentinel-2 satellites, respectively. HLS Version 2.0 (V2.0) is the most recent version of these data and had a global median repeat frequency of 1.6 days in 2022 by combining observations from Landsat 8 and 9 and Sentinel-2A and B. The recent addition of Sentinel-2C data will provide even more frequent observations. With near-global coverage and improved harmonization algorithms, HLS V2.0 paves the way for new applications and improved land monitoring systems – see Animation 1. HLS data are available for download on NASA Earthdata: HLSL30v2.0 and HLSS30v2.0. These data can also be accessed through Google Earth Engine: HLSL30v2.0 and HLSS30v2.0

    Animation 1. This visualization shows the change in vegetation in Maryland from January 1 to December 30, 2016, using Normalized Difference Vegetation Index (NDVI) data from Harmonized Landsat Sentinel-2 (HLS). The visualization shows land on both sides of the Chesapeake Bay, where red represents bare soil and green indicates healthy, growing vegetation.
    Animation credit: Michael Taylor [Science Systems and Applications Inc. (SSAI)], Matthew Radcliff [USRA], and Jeffrey Masek [GSFC]. Caption adapted from Laura Rocchio [SSAI]

    The Dawn of HLS

    The story of HLS begins before the launch of Sentinel-2A in 2015. Jeffrey Masek [GSFC], who was at that time project scientist for Landsat 8, led a group of researchers who wanted to find a way to harmonize Landsat data with other satellite data. Their aim was to create a “virtual constellation” similar to how weather satellites operate.

    “HLS meets a need that people have been asking for for a long time,” said Masek.

    What began as a research question with an experimental product evolved into an operational project with the involvement of the Satellite Needs Working Group (SNWG). SNWG is an interagency effort to develop solutions that address Earth observation needs of civilian federal agencies. Every two years, SNWG conducts a survey of federal agencies to see how their work could benefit from satellite data. The answers span the gamut of application areas, from water quality monitoring to disaster recovery to planning how best to protect and use natural resources. SNWG brings these ideas to NASA, USGS, and the National Oceanic and Atmospheric Administration (NOAA) – the three main U.S. government providers of satellite data. These agencies work together to create and implement solutions that serve those needs. NASA plays a critical role in every step of the SNWG process, including leading the assessment of survey responses from over 30 federal agencies, managing and supporting the implementation of identified solutions, and encouraging solution co-design with federal partners to maximize impact.

    The HLS surface reflectance product was an outcome of the very first SNWG solution cycle in 2016. This product was expanded, following additional SNWG requests in 2020 and 2022. The 2020 cycle saw the creation of nine HLS-derived vegetation indices, and the 2022 cycle aimed for a six-hour latency product.

    The U.S. Department of Agriculture (USDA) now uses HLS to map crop emergence at the field scale in the corn belt, allowing farmers to better plan their growing seasons. Ranchers in Colorado use the dataset to decide where to graze their cattle during periods of drought. HLS also informs the use and termination of cover crops in the Chesapeake Bay area. In 2024, the Federal Emergency Management Agency (FEMA) employed HLS to identify where to focus aid in the aftermath of Hurricane Helene.

    A New and Improved HLS

    In the July 2025 issue of Remote Sensing of Environment, a team of researchers outlined the HLS V2.0 surface reflectance dataset and algorithms. The team included seven NASA co-authors, members of the 2018–2023 Landsat Science Team, and ESA. The lead author, Junchang Ju [GSFC—Remote Sensing Scientist], has been the technical lead on HLS since its inception. Co-author Christopher Neigh [GSFC—Landsat 8/9 Project Scientist] is the principal investigator on the HLS project. V2.0, which was completed in Summer 2023, incorporates several major improvements over HLS V1.4, the most recent publicly available HLS product. The HLS production team at NASA’s Marshall Space Flight Center (MSFC), led by Madhu Sridhar [University of Alabama in Huntsville—Research Scientist], ensures consistent data access through close collaboration with ESA and the Land Processes Distributed Active Archive Center (LP DAAC). HLS V1.4 covered about 30% of the global land area, providing data on North America and other select locations. HLS V2.0 provides data at a spatial resolution of 30 m (98 ft) with near-global coverage from 2013 onward. The dataset includes all land masses except Antarctica. HLS V2.0 also has key algorithmic improvements in atmospheric correction, cloud masking, and bidirectional reflectance distribution function (BRDF) correction. Together, these algorithms “harmonize” the data, or ensure that the distinct Landsat and Sentinel-2 datasets can effectively be used interchangeably – see Animation 2.

    Animation 2: The visualization provides the Normalized Difference Vegetation Index (NDVI) data from Harmonized Landsat Sentinel-2 (HLS) for farm fields south of Columbus, NE. The red represents bare soil and green represents healthy, growing vegetation. The animation runs from January 1 to December 30, 2016.
    Animation credit: Michael Taylor [SSAI], Matthew Radcliff [USRA], and Jeffrey Masek [GSFC]. Caption adapted from Laura Rocchio [SSAI]

    HLS V2.0 in Action

    The increased frequency of observations improved the ability of the scientific community to track disaster recovery, changes in phenology, agricultural intensification, rapid urban growth, logging, and deforestation. Researchers are already putting these advances to use.

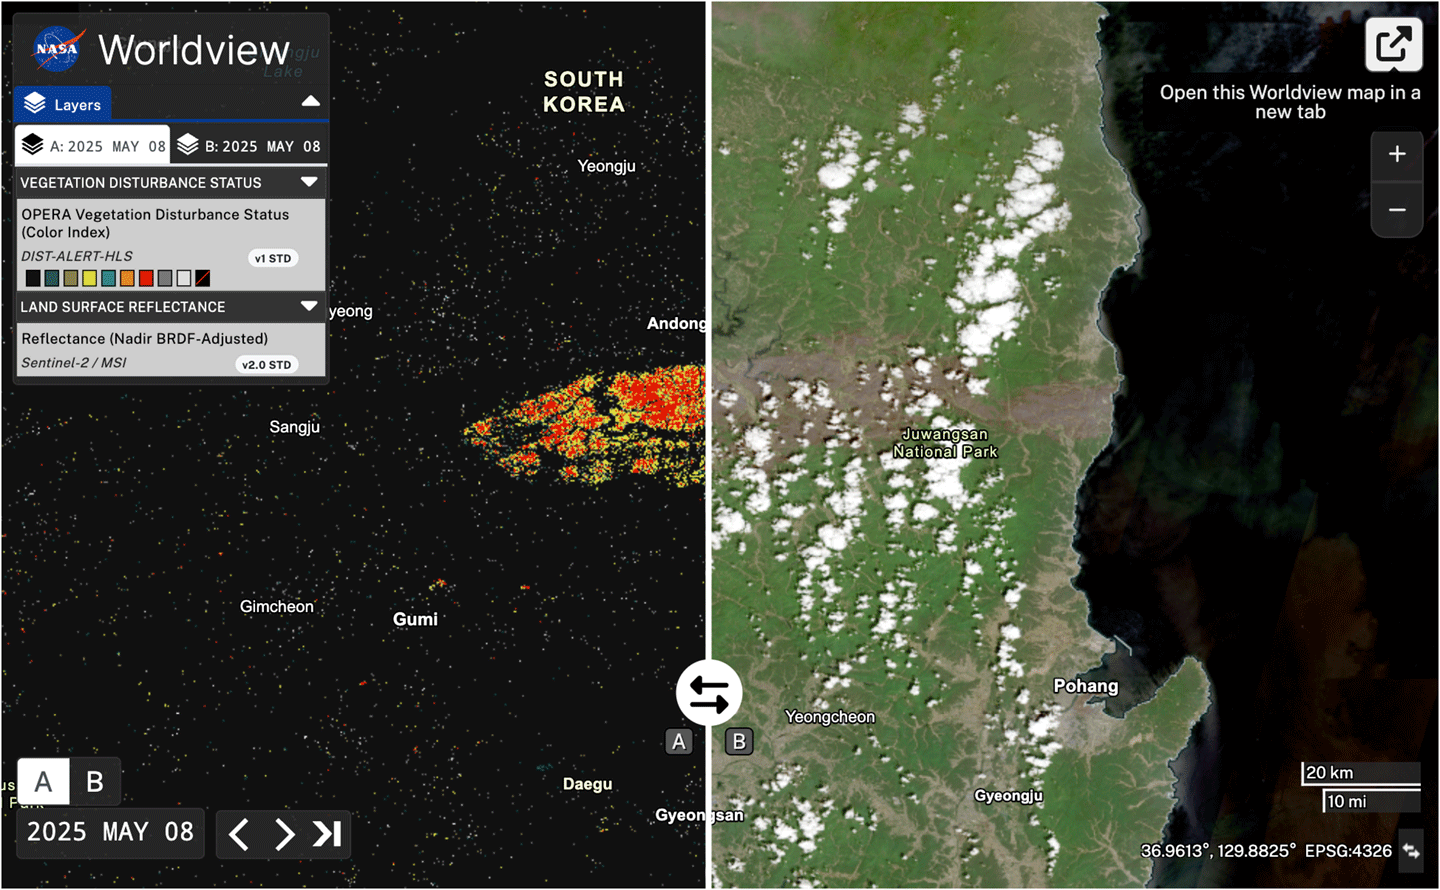
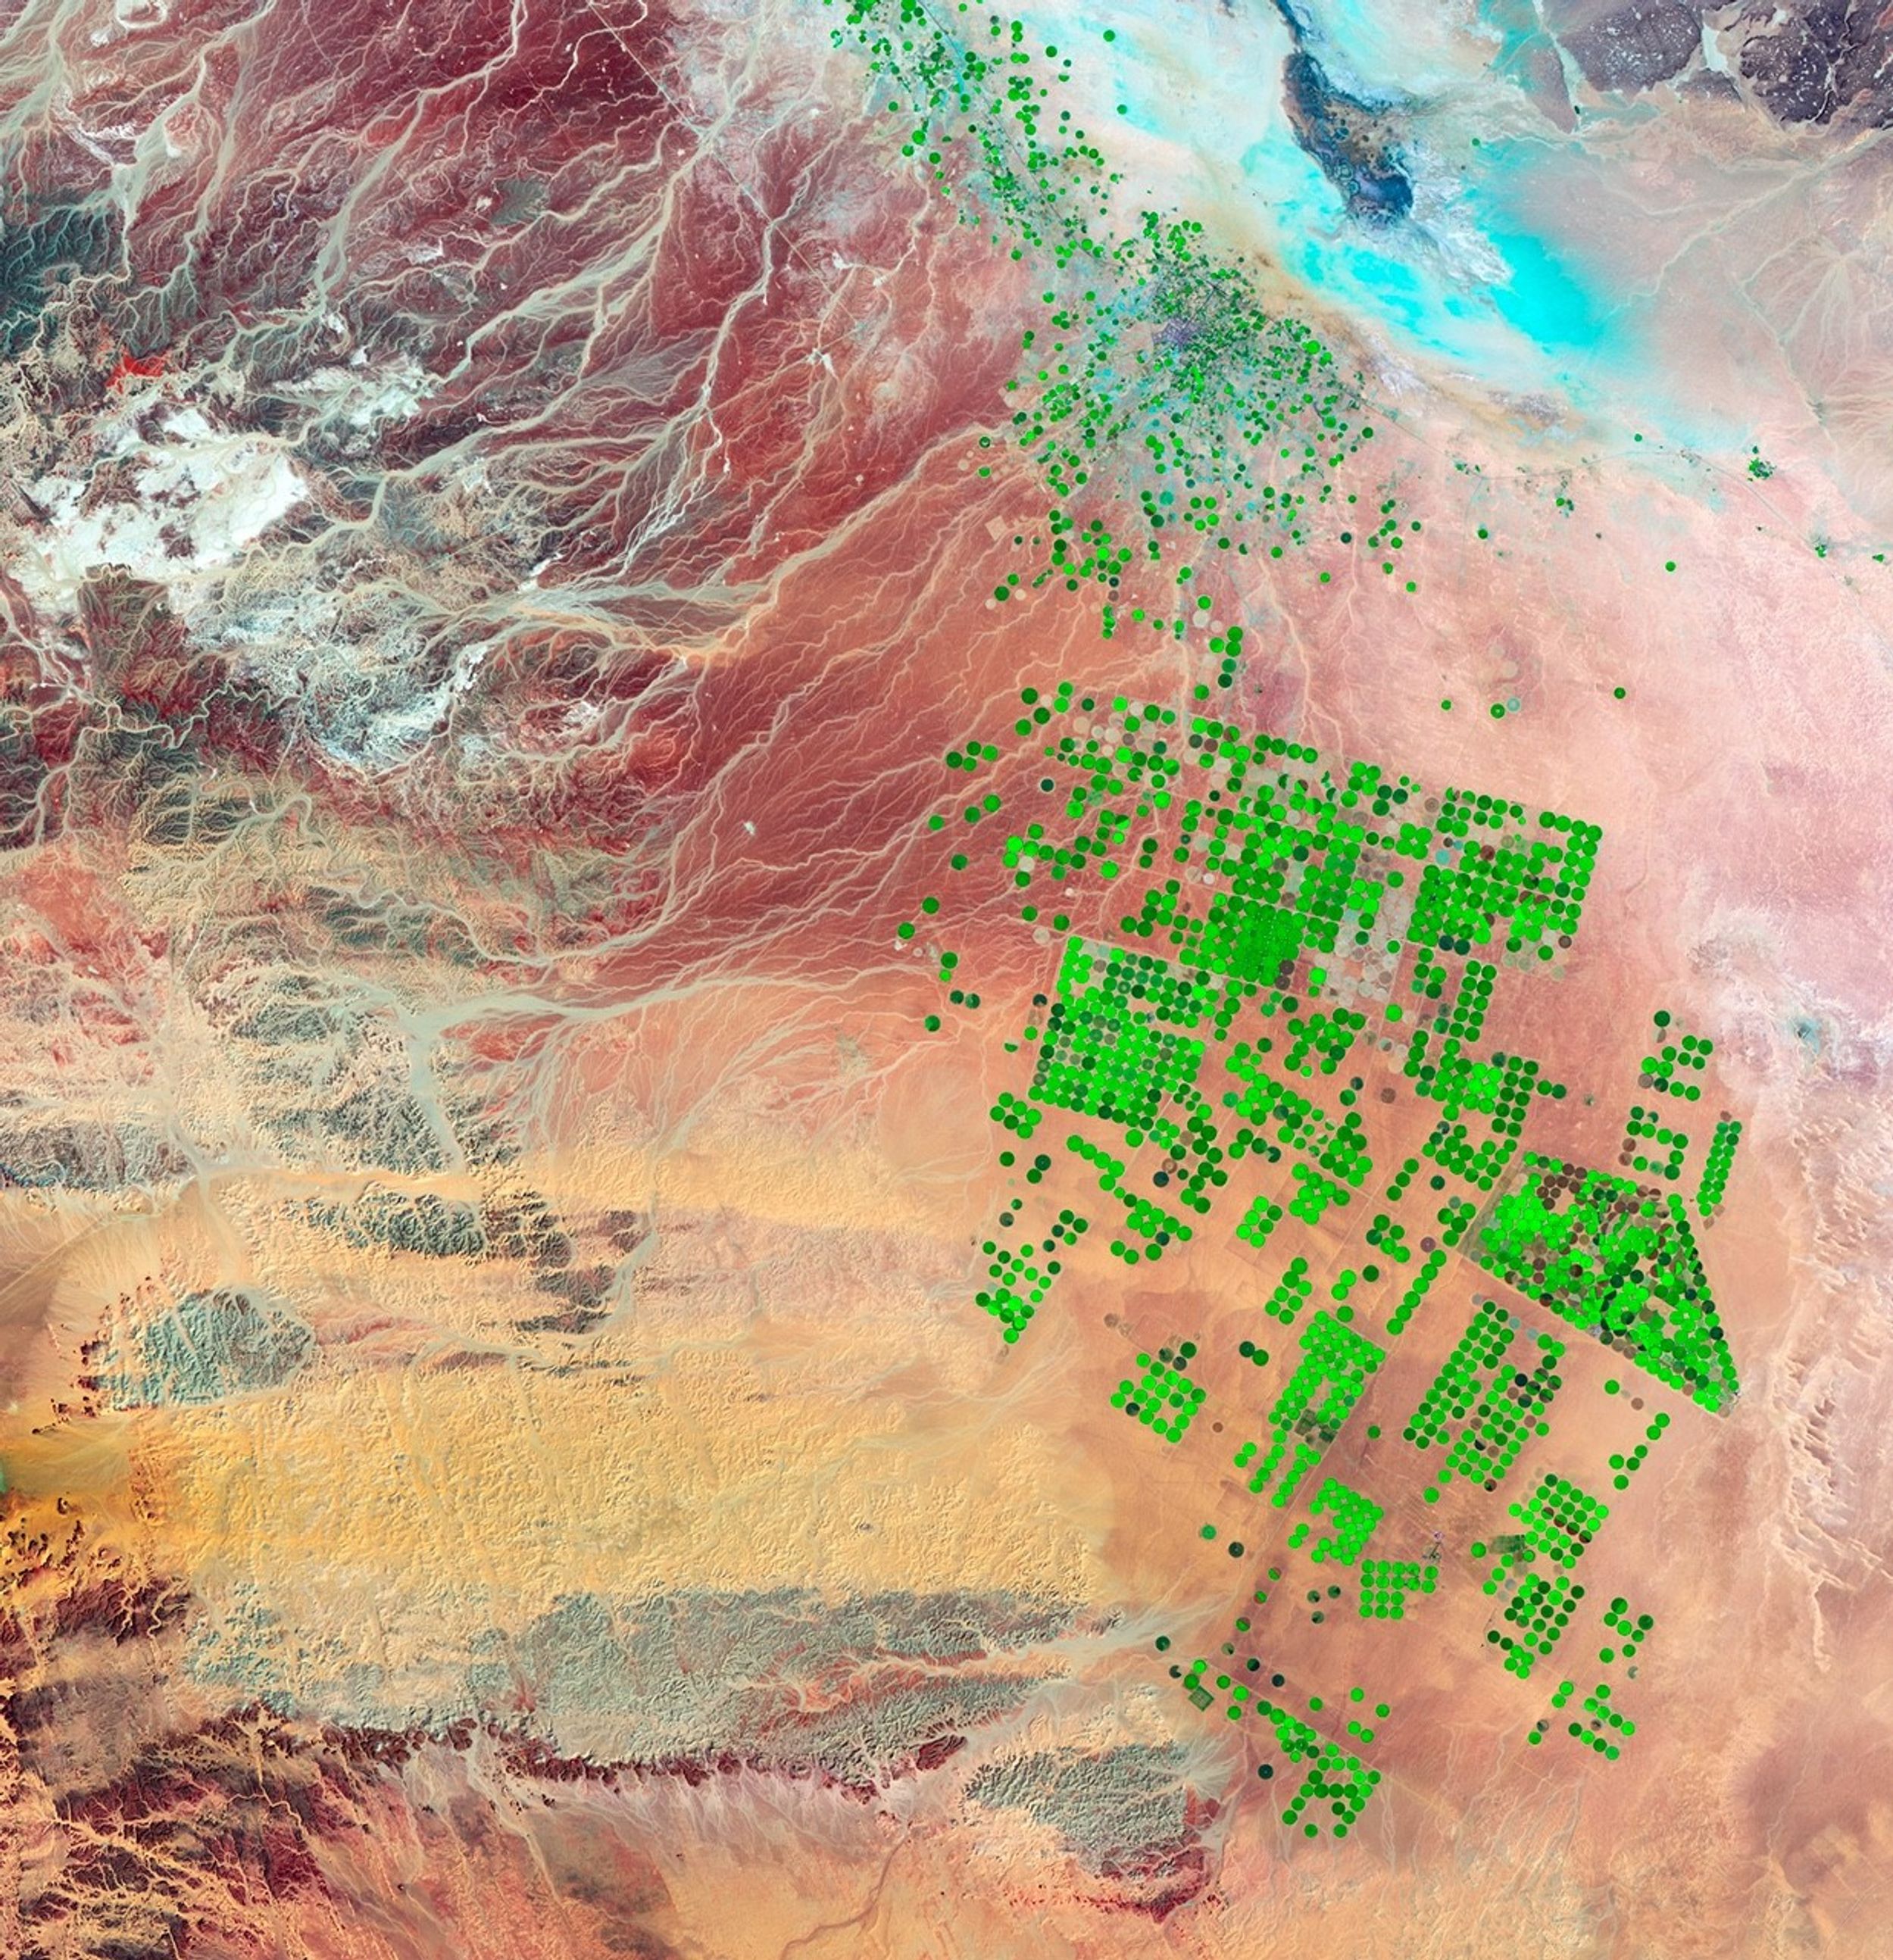
    The land disturbance product (DIST-ALERT) is a global land change monitoring system that uses HLS V2.0 data to track vegetation anomalies in near real-time – see Figure 1. DIST-ALERT captures agricultural expansion, urban growth, fire, flooding, logging, drought, landslides, and other forces of change to vegetation. Amy Pickens [University of Maryland, Department of Geographical Sciences—Assistant Research Professor] said that HLS is the perfect dataset for tracking disturbances because of the frequency of observations.

    DIST-ALERT was created through Observational Products for End-Users from Remote Sensing Analysis (OPERA), a project at NASA/Jet Propulsion Laboratory (JPL). OPERA products respond to agency needs identified by the SNWG. In 2018, SNWG identified tracking surface disturbance as a key need. OPERA partnered with the Global Land Analysis and Discovery (GLAD) lab at University of Maryland to develop the change detection algorithm.

    To track changes in vegetation, the DIST-ALERT system establishes a rolling baseline – meaning that for any given pixel, the vegetation cover is compared against vegetation cover from the same 31-day window in the previous three years. The primary algorithm detects any vegetation loss relative to the established baseline. A secondary algorithm flags any spectral anomaly (i.e., any change in reflectance) compared to that same baseline. This approach ensures that the algorithm catches non-vegetation change (e.g., new building or road projects in unvegetated areas). Used together, these algorithms can identify long-term changes in agricultural expansion, deforestation, and urbanization alongside short-term changes in crop harvest, drought, selective logging, and the impacts of disasters. On average, DIST-ALERT is made available on LP DAAC within six hours of when new HLS data is available. Currently, the dataset does not provide attribution to disturbances.

    Landsat figure 1
    Figure 1. In March 2025, wildfires burned through South Korea, resulting in heavy vegetation loss. [left] Output of the DIST-ALERT product on NASA Worldview from May 8, 2025, with vegetation loss in percent flagged with varying levels of confidence. Yellow and red represent areas with confirmed vegetation cover losses of <50% and ≥50%, respectively. [right] Natural-color image captured by the Multi-Spectral Instrument (MSI) aboard Sentinel-2C on May 8, 2025. The large brown burn scar in the center of the image corresponds to vegetation loss detected by DIST-ALERT. It stands in contrast to the surrounding green vegetation.
    Figure credit: NASA Earthdata

    Disturbance alerts already exist in some ecosystems. Brazil’s National Institute for Space Research [Instituto Nacional de Pesquisas Espaciais (INPE)] runs two projects that detect deforestation in the Amazon: Programa de Cálculo do Desflorestamento da Amazônia (PRODES) and Sistema de Detecção de Desmatamento em Tempo Real (DETER). The GLAD lab created its own forest loss alerts – GLAD-L and GLAD-S2 – using Landsat and Sentinel-2 data respectively. Global Forest Watch integrates GLAD-L and GLAD-S2 data with Radar for Detecting Deforestation (RADD) observations – derived from synthetic aperture radar data from Copernicus Sentinel-1 – into an integrated deforestation alert.

    The implementation of these alert systems, some of which have been around for decades, have been shown to impact deforestation rates in the tropics. For example, a 2021 study in Nature Climate Change found that deforestation alerts decreased the probability of deforestation in Central Africa by 18% relative to the average 2011–2016 levels.

    DIST-ALERT is distinct from other alert systems in a few ways. First, it has global coverage. Second, the rolling baseline allows for tracking changes in seasonality and disturbances to dynamic ecosystems. When HLS V2.0 data are input to DIST-ALERT, the system is also better at identifying disturbances in cloudy ecosystems than other individual alert systems – because it is more likely to obtain clear observations. This also enables it to identify the start and end of the disturbance more precisely.

    Pickens said that the DIST-ALERT team is already working with end-users who are implementing their data product. She has spoken to some who use the system to help logging companies prove that they are complying with regulations. The U.S. Census Bureau is also using DIST-ALERT to monitor fast-growing communities so that they can do targeted assessments in the interim between the larger decennial census.

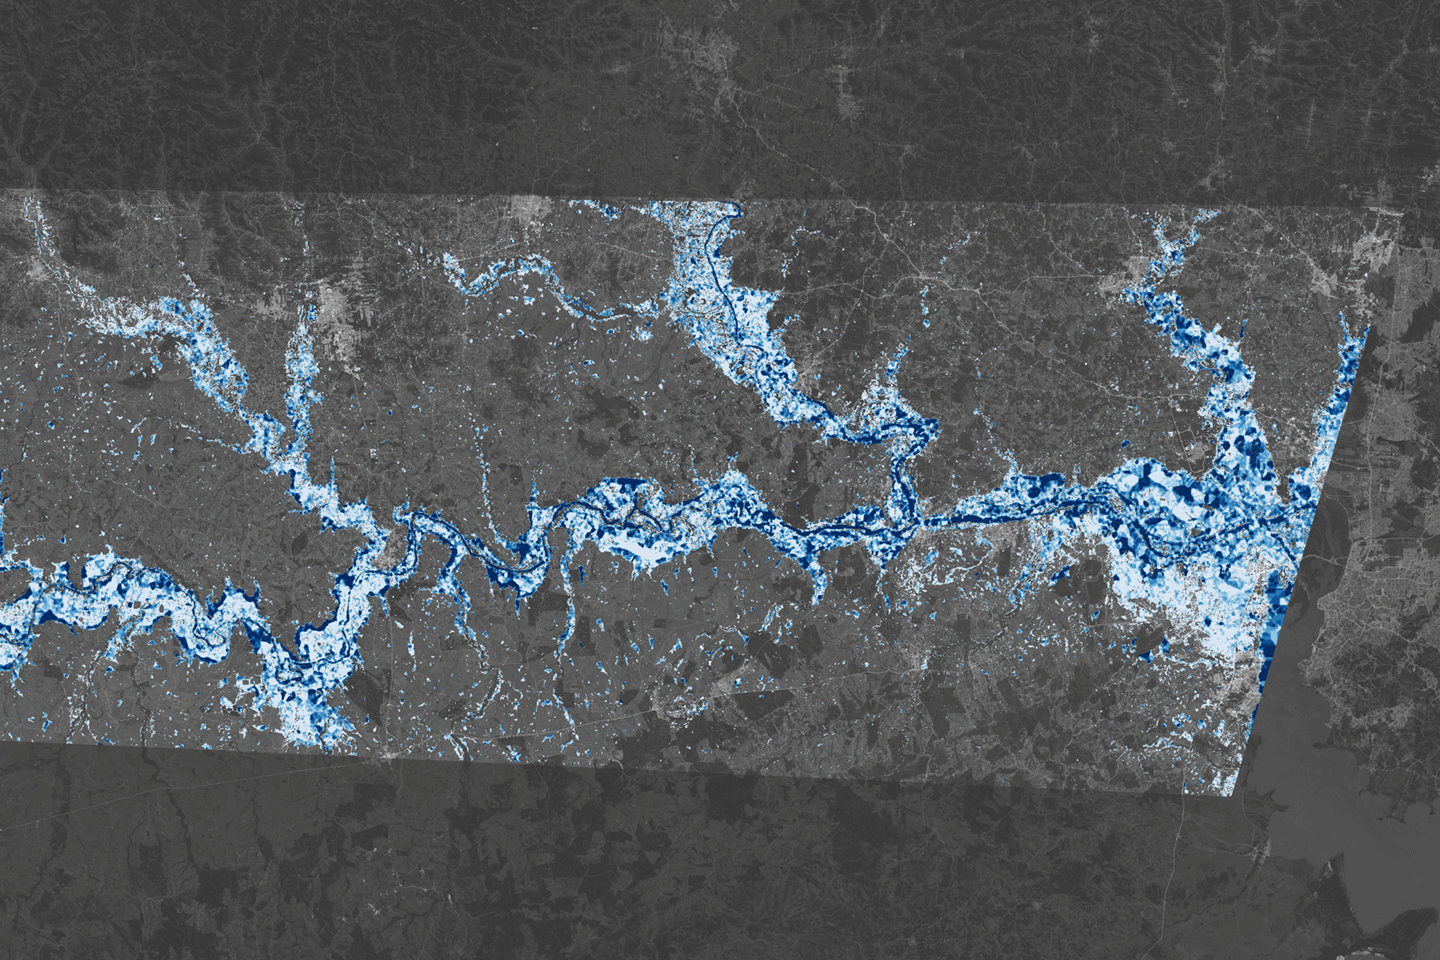
    Alongside DIST-ALERT, OPERA has also been developing the Dynamic Surface Water eXtent (DSWx) product suite, which employs HLS to track surface water (e.g., lakes, reservoirs, rivers, and floods) around the globe – see Figure 2. These new products represent the new applications made possible by the HLS interagency and international collaboration.

    Landsat figure 2
    Figure 2. The map shows flood extent and estimates of flood depth in areas west of Porto Alegre, Brazil on May 6, 2024. The flood extent is from the Observational Products for End-Users from Remote Sensing Analysis (OPERA) Dynamic Surface Water eXtent product, which uses Harmonized Landsat Sentinel-2 data. The flood depth estimate is from the Floodwater Depth Estimation Tool (FwD ET). The darkest blue areas represent floodwater at least 5 m (20 ft) deep. Much of the inundated floodplain is light blue, which equates to depths of between 0.1–1 m (4–40 in).
    Figure credit: Lauren Dauphin [NASA’s Earth Observatory], Dinuke Munasinghe [JPL], Sagy Cohen [University of Alabama], and Alexander Handwerger [JPL]

    Conclusion

    HLS is set to continue improving land monitoring efforts across the globe. Meanwhile, the HLS science team is working to improve the algorithms for a more seamless harmonization of Landsat 8 and 9 and Sentinel-2 data. They are also working to improve the cloud-masking algorithm, have recently released vegetation indices, and are working on developing a low-latency (six-hour) HLS surface reflectance product, all while incorporating user feedback.

    Looking ahead, the launch of future Sentinel and Landsat satellites will further the development of HLS. The additional data and unique capabilities will continue to meet researchers’ need for more frequent, high-quality satellite observations of Earth’s land surface.

    Madeleine Gregory
    NASA’s Goddard Space Flight Center/Science Systems and Applications Inc.
    madeleine.s.gregory@nasa.gov

    Details

    Last Updated

    Aug 26, 2025

    Related Terms

  • NASA Implementation of Executive Order 14303

  • Lindy Garay: Supporting Space Station Safety and Success

    Lindy Garay always knew she wanted to develop software. She did not anticipate that her work would contribute to human spaceflight.

    The electrical and software engineering degree Garay earned from the University of Texas at Austin paved the way for a 25-year career with NASA’s Johnson Space Center in Houston. Her first job out of college was developing software for the International Space Station Program’s original space station training facility simulator. “I had not always been interested in working in the space program, but I became enamored with being able to contribute to such an important mission,” she said.

    A woman wearing a black button down shirt sits in front of an American flag and a NASA flag.
    Official portrait of Lindy Garay.
    NASA

    Today, Garay serves as a training systems software architect and is the technical lead for training system external interfaces. That means she leads the team that helps connect training simulations from NASA’s external partners with simulations run by Johnson’s Mission Training Center (MTC) to support crew and flight controller training. The MTC currently provides training capabilities for the International Space Station Program, the Commercial Crew Program, and Artemis campaign components such as the Orion Program and the human landing system.

    Garay said that not having an aerospace background was challenging at the beginning of her career, but she overcame that by leaning on teammates who had knowledge and experience in the field. “Every successful endeavor depends on having a solid team of dedicated people working toward one goal,” she said. “Success also depends on good communication, flexibility, and being willing to listen to different opinions,” she added.

    Garay was recently named as a 2025 NASA Space Flight Awareness Program Honoree – one of the highest recognitions presented to the agency’s workforce. Recipients must have significantly contributed to the human spaceflight program to ensure flight safety and mission success. Garay’s commendation acknowledged her “sustained superior performance, dedication, and commitment to the Flight Operations Directorate’s goals” and her instrumental role in the success of several major training systems projects. In particular, she was recognized for contributions to the High-Level Architecture simulation framework, which is used to create realistic simulations of visiting vehicles’ arrival, docking, and departure from the space station.

    A group of men and women hold certificates on a stage, with an astronaut wearing a blue flight suit on the side.
    From left to right, Johnson Space Flight Awareness (SFA) Lead Jessica Cordero, SFA Coordinator Michelle Minor, Johnson Space Center Acting Director Stephen Koerner, Drew Faulkner, Adam Korona, Teresa Sindelar, Lindy Garay, Lindsay Kirk, Keith Barr, Ephram Rubin, and NASA astronaut Randy Bresnik.
    NASA/Kim Shiflett

    Garay and 36 other agency honorees were celebrated during a special ceremony in Cocoa Beach, Florida, and had the opportunity to attend the launch of NASA’s SpaceX Crew-10 mission at NASA’s Kennedy Space Center. “That was quite an honor,” she said.

    Outside of work, Garay may be found cheering on Houston’s sports teams. She enjoys traveling to watch the Texans and the Astros play.

    Garay is also rooting for the Artemis Generation as NASA prepares to return to the Moon and journey on to Mars. She offered this advice: “Always remember the importance and the magnitude of the whole mission.”

  • NASA Shares Final Contenders for Artemis II Moon Mascot Design Contest

    3 Min Read

    NASA Shares Final Contenders for Artemis II Moon Mascot Design Contest

    The Artemis II crew stands in front of the Orion spacecraft. They are wearing orange spacesuits without helmets. Orion is silver-colored and reflective. There is a round railing surrounding the spacecraft. There is also a group of people wearing blue jumpsuits, hairnets, and gloves standing behind Orion; they are members of the Artemis II closeout crew.

    Lee esta historia en español aquí.

    NASA is down to 25 finalists for the Artemis II zero gravity indicator set to fly with the mission’s crew around the Moon and back next year.

    Astronauts Reid Wiseman, Victor Glover, and Christina Koch of NASA, and CSA (Canadian Space Agency) astronaut Jeremy Hansen will soon select one of the finalist designs to join them inside the Orion spacecraft as their Moon mascot.

    “The Artemis II zero gravity indicator will be special for the crew,” said Reid Wiseman, Artemis II commander. “In a spacecraft filled with complex hardware to keep the crew alive in deep space, the indicator is a friendly and useful way to highlight the human element that is so critical to our exploration of the universe. Our crew is excited about these designs from across the world and we are looking forward to bringing the winner along for the ride.”

    A zero gravity indicator is a small plush item that typically rides with a crew to visually indicate when they are in space. For the first eight minutes after liftoff, the crew and their indicator nearby will still be pushed into their seats by gravity, and the force of the climb into space. When the main engines of the SLS (Space Launch System) rocket’s core stage cut off, gravity’s restraints are lifted, but the crew will still be strapped safely into their seats – their zero gravity indicator’s ability to float will provide proof that they’ve made it into space.

    Artemis II will mark the first time that the public has had a hand in creating the crew’s mascot.

    These designs – ideas spanning from Moon-related twists on Earthly creatures to creative visions of exploration and discovery – were selected from more than 2,600 submissions from over 50 countries, including from K-12 students. The finalists represent 10 countries including the United States, Canada, Colombia, Finland, France, Germany, Japan, Peru, Singapore, and Wales.

    View the finalist designs:

    In March, NASA announced it was seeking design ideas from global creators for a zero gravity indicator to fly aboard Artemis II, the first crewed mission under NASA’s Artemis campaign. Creators were asked to submit ideas representing the significance of Artemis, the mission, or exploration and discovery, and to meet specific size and materials requirements. Crowdsourcing company Freelancer facilitated the contest on NASA’s behalf though the NASA Tournament Lab, managed by the agency’s Space Technology Mission Directorate.

    Once the crew has selected a final design, NASA’s Thermal Blanket Lab will fabricate it for flight. The indicator will be tethered inside Orion before launch.

    The approximately 10-day mission is another step toward missions on the lunar surface and helping the agency prepare for future human missions to Mars.

    Through Artemis, NASA will send astronauts to explore the Moon for scientific discovery, economic benefits, and to build the foundation for the first crewed missions to Mars.

  • NASA’s Bennu Samples Reveal Complex Origins, Dramatic Transformation

    A scanning electron microscope image of a micrometeorite impact crater in a particle of asteroid Bennu material.
    A scanning electron microscope image of a micrometeorite impact crater in a particle of asteroid Bennu material.
    Credits: NASA/Zia Rahman

    5 min read

    NASA’s Bennu Samples Reveal Complex Origins, Dramatic Transformation

    Asteroid Bennu, sampled by NASA’s OSIRIS-REx mission in 2020, is a mixture of dust that formed in our solar system, organic matter from interstellar space, and pre-solar system stardust. Its unique and varied contents were dramatically transformed over time by interactions with water and exposure to the harsh space environment.

    These insights come from a trio of newly published papers based on the analysis of Bennu samples by scientists at NASA and other institutions.

    Bennu is made of fragments from a larger parent asteroid destroyed by a collision in the asteroid belt, between the orbits of Mars and Jupiter. One of the papers, co-led by Jessica Barnes at the University of Arizona, Tucson, and Ann Nguyen of NASA’s Johnson Space Center in Houston and published in the journal Nature Astronomy, suggests that Bennu’s ancestor was made up of material that had diverse origins—near the Sun, far from the Sun, and even beyond our solar system.

    The analyses show that some of the materials in the parent asteroid, despite very low odds, escaped various chemical processes driven by heat and water and even survived the extremely energetic collision that broke it apart and formed Bennu.

    “We traced the origins of these initial materials accumulated by Bennu’s ancestor,” said Nguyen. “We found stardust grains with compositions that predate the solar system, organic matter that likely formed in interstellar space, and high temperature minerals that formed closer to the Sun. All of these constituents were transported great distances to the region that Bennu’s parent asteroid formed.”

    The chemical and atomic similarities of samples from Bennu, the asteroid Ryugu (sampled by JAXA’s (the Japan Aerospace Exploration Agency) Hayabusa2 mission) and the most chemically primitive meteorites collected on Earth suggest their parent asteroids may have formed in a similar, distant region of the early solar system. Yet the differences from Ryugu and meteorites that were seen in the Bennu samples may indicate that this region changed over time or did not mix as well as some scientists have thought. 

    We found stardust grains with compositions that predate the solar system, organic matter that likely formed in interstellar space, and high temperature minerals that formed closer to the Sun.

    Ann Nguyen

    Planetary Scientist

    Though some original constituents survived, most of Bennu’s materials were transformed by reactions with water, as reported in the paper co-led by Tom Zega of the University of Arizona and Tim McCoy of the Smithsonian’s National Museum of Natural History in Washington and published in Nature Geoscience. In fact, minerals in the parent asteroid likely formed, dissolved, and reformed over time.

    “Bennu’s parent asteroid accumulated ice and dust. Eventually that ice melted, and the resulting liquid reacted with the dust to form what we see today, a sample that is 80% minerals that contain water,” said Zega. “We think the parent asteroid accumulated a lot of icy material from the outer solar system, and then all it needed was a little bit of heat to melt the ice and cause liquids to react with solids.”

    Bennu’s transformation did not end there. The third paper, co-led by Lindsay Keller at NASA Johnson and Michelle Thompson of Purdue University, also published in Nature Geoscience, found microscopic craters and tiny splashes of once-molten rock – known as impact melts – on the sample surfaces, signs that the asteroid was bombarded by micrometeorites. These impacts, together with the effects of solar wind, are known as space weathering and occurred because Bennu has no atmosphere to protect it.

    “The surface weathering at Bennu is happening a lot faster than conventional wisdom would have it, and the impact melt mechanism appears to dominate, contrary to what we originally thought,” said Keller. “Space weathering is an important process that affects all asteroids, and with returned samples, we can tease out the properties controlling it and use that data and extrapolate it to explain the surface and evolution of asteroid bodies that we haven’t visited.”

    A picture of a woman sitting at a desk, working at a computer. She is in a lab, and a large, complex machine can be seen behind her. On the wall is a plaque that has the logo for the OSIRIS-REx mission.
    Ann Nguyen, co-lead author of a new paper that gives insights into the diverse origin of asteroid Bennu’s “parent” asteroid works alongside the NanoSIMS 50L (nanoscale secondary ion mass spectrometry) ion microprobe in the Astromaterials Research and Exploration Science Division at NASA’s Johnson Space Center in Houston.
    Credit: NASA/James Blair

    As the leftover materials from planetary formation 4.5 billion years ago, asteroids provide a record of the solar system’s history. But as Zega noted, we’re seeing that some of these remnants differ from what has been found in meteorites on Earth, because certain types of asteroids burn up in the atmosphere and never make it to the ground. That, the researchers point out, is why collecting actual samples is so important.

    “The samples are really crucial for this work,” Barnes said. “We could only get the answers we got because of the samples. It’s super exciting that we’re finally able to see these things about an asteroid that we’ve been dreaming of going to for so long.”

    The next samples NASA expects to help unravel our solar system’s story will be Moon rocks returned by the Artemis III astronauts.

    NASA’s Goddard Space Flight Center provided overall mission management, systems engineering, and the safety and mission assurance for OSIRIS-REx. Dante Lauretta of the University of Arizona, Tucson, is the principal investigator. The university leads the science team and the mission’s science observation planning and data processing. Lockheed Martin Space in Littleton, Colorado, built the spacecraft and provided flight operations. Goddard and KinetX Aerospace were responsible for navigating the OSIRIS-REx spacecraft. Curation for OSIRIS-REx takes place at NASA’s Johnson Space Center in Houston. International partnerships on this mission include the OSIRIS-REx Laser Altimeter instrument from the Canadian Space Agency and asteroid sample science collaboration with JAXA’s Hayabusa2 mission. OSIRIS-REx is the third mission in NASA’s New Frontiers Program, managed by NASA’s Marshall Space Flight Center in Huntsville, Alabama, for the agency’s Science Mission Directorate in Washington.

    Melissa Gaskill
    Johnson Space Center

    For more information on NASA’s OSIRIS-REx mission, visit:

    https://science.nasa.gov/mission/osiris-rex/

    Karen Fox / Molly Wasser
    Headquarters, Washington
    202-358-1600
    karen.c.fox@nasa.gov / molly.l.wasser@nasa.gov

    Victoria Segovia
    Johnson Space Center
    (281) 483-5111
    victoria.segovia@nasa.gov

  • Lunar Environment Structural Test Rig

    3 min read

    Preparations for Next Moonwalk Simulations Underway (and Underwater)

    The Lunar Environment Structural Test Rig simulates the intense cold of the lunar night, ranging from 40 Kelvin (K) to 125 K while maintaining a vacuum environment. This creates a tool by which scientists and engineers can test materials, electronics, and flight hardware for future Moon and Mars missions, characterizing their behaviors at these temperatures while also validating their ability to meet design requirements.

    A black-and-white photo of a cryogenic engineer viewed through a circular opening of a large metallic chamber with evenly spaced bolts along its rim. Inside, a square component is mounted with wires connected to it. The man viewed through the porthole appears to be adjusting settings for the machine.
    Cryogenic engineer Adam Rice tests the Lunar Environment Structural Test Rig to simulate the thermal-vacuum conditions of the lunar night on Thursday, May 22, 2025.
    NASA/Jef Janis

    Facility Overview

    The Lunar Environment Structural Test Rig (LESTR) approaches the problem of creating a simulated lunar environment by departing from typical fluid immersion or jacketed-and-chilled chamber systems. It does this by using a cryocooler to reject heat and bring the test section to any point desired by the test engineer, as low as 40 K or as high as 125 K in a vacuum environment. By combining high vacuum and cryogenic temperatures, LESTR enables safe, accurate, and cost-effective testing of materials and hardware destined for the Moon and beyond. Its modular setup supports a wide range of components — from spacesuits to rover wheels to electronics — while laying the foundation for future Moon and Mars mission technologies.

    Quick Facts

    LESTR is a cryogenic mechanical test system built up within a conventional load frame with the goal of providing a tool to simulate the thermal-vacuum conditions of the lunar night to engineers tasked with creating the materials, tools, and machinery to succeed in NASA’s missions.

    • LESTR replicates extreme lunar night environments — including temperatures as low as 40 K and high vacuum (<5×10⁻⁷ Torr) — enabling true-to-space testing without liquid cryogens.
    • Unlike traditional “wet” methods, LESTR uses a cryocooler and vacuum system to create an environment accurate to the lunar surface.
    • From rover wheels to spacesuits to electronics, LESTR supports static and dynamic testing across a wide range of Moon and Mars mission hardware.
    • With scalable architecture and precision thermal control, LESTR lays critical groundwork for advancing the technologies of NASA’s Artemis missions and beyond.

    Capabilities

    Specifications

    • Temperature Range: 40 K to 125 K
    • Load Capacity: ~10 kN
    • Vacuum Level: <5×10⁻⁷ Torr
    • Test Volume (Cold Box Dimensions): 7.5 by 9.5 by 11.5 inches
    • Maximum Cycle Rate: 100 Hz
    • Time to Vacuum:
      • 10⁻⁵ Torr in less than one hour
      • 10⁻⁶ Torr in four hours

    Features

    • Dry cryogenic testing (no fluid cryogen immersion)
    • “Dial-a-temperature” control for precise thermal conditions
    • Integrated optical extensometer for strain imaging
    • Digital image correlation and electrical feedthroughs support a variety of data collection methods
    • Native support for high-duration cyclic testing

    Applications

    • Cryogenic Lifecycle Testing: fatigue, fracture, and durability assessments
    • Low-Frequency Vibration Testing: electronics qualification for mobility systems
    • Static Load Testing: material behavior characterization in lunar-like environments
    • Suspension and Drivetrain Testing: shock absorbers, wheels, springs, and textiles
    • Textiles Testing: evaluation of spacesuits and habitat fabrics
    • Dynamic Load Testing: up to 10 kN linear capacity, 60 mm stroke

    Contact

    Cryogenic and Mechanical Evaluation Lab Manager: Andrew Ring
    216-433-9623
    Andrew.J.Ring@nasa.gov

    LESTR Technical Lead: Ariel Dimston
    216-433-2893
    Ariel.E.Dimston@nasa.gov

    Using Our Facilities

    NASA’s Glenn Research Center in Cleveland provides ground test facilities to industry, government, and academia. If you are considering testing in one of our facilities or would like further information about a specific facility or capability, please let us know.

    A tall, industrial machine with metallic and gray components stands in a laboratory. Multiple cables and tubes connect to the central chamber, which is cylindrical. Some cables are silver and braided, others are orange or yellow. The test rig has vertical support columns and a black base. In the background there are white brick walls, ceiling ducts, and a work station with a desk and chair.
    The Lunar Environment Structural Test Rig simulates the intense cold of the lunar night on Friday, June 6, 2025.
    NASA/Steven Logan
    : This is a close-up view through a circular opening of a large metallic chamber with evenly spaced bolts along its rim. Inside, a square copper component is mounted with red and solver wires connected to it. The background is out of focus, showing part of a chair and lab equipment.
    The Lunar Environment Structural Test Rig uses a cryocooler to reject heat and bring the test section as low as 40 Kelvin in a vacuum environment on Thursday, May 22, 2025.
    NASA/Jef Janis
  • Hubble Observes Noteworthy Nearby Spiral Galaxy

    2 min read

    Hubble Observes Noteworthy Nearby Spiral Galaxy

    A face-on spiral galaxy. Its center glows bright yellow. The galaxy’s spiral arms contain sparkling blue stars, pink spots of star formation, and dark threads of dust that follow the arms.
    This NASA/ESA Hubble Space Telescope image features the nearby spiral galaxy NGC 2835.
    ESA/Hubble & NASA, R. Chandar, J. Lee and the PHANGS-HST team

    This NASA/ESA Hubble Space Telescope image offers a new view of the nearby spiral galaxy NGC 2835, which lies 35 million light-years away in the constellation Hydra (the Water Snake). The galaxy’s spiral arms are dotted with young blue stars sweeping around an oval-shaped center where older stars reside.

    This image differs from previously released images from Hubble and the NASA/ESA/CSA James Webb Space Telescope because it incorporates new data from Hubble that captures a specific wavelength of red light called H-alpha. The regions that are bright in H-alpha emission are visible along NGC 2835’s spiral arms, where dozens of bright pink nebulae appear like flowers in bloom. Astronomers are interested in H-alpha light because it signals the presence of several different types of nebulae that arise during different stages of a star’s life. Newborn, massive stars create nebulae called H II regions that are particularly brilliant sources of H-alpha light, while dying stars can leave behind supernova remnants or planetary nebulae that can also be identified by their H-alpha emission.

    By using Hubble’s sensitive instruments to survey 19 nearby galaxies, researchers aim to identify more than 50,000 nebulae. These observations will help to explain how stars affect their birth neighborhoods through intense starlight and winds.

    Text Credit: ESA/Hubble

  • Close-Up Views of NASA’s DART Impact to Inform Planetary Defense

    5 min read

    Close-Up Views of NASA’s DART Impact to Inform Planetary Defense

    Two side-by-side black and white images of the Didymos asteroid system taken 20 seconds apart. Left: Didymos is a bright rounded object, in the upper left third of the image. It is brightly lit from below. Underneath and to the right, the much smaller asteroid Dimorphos is a small, gray dot with a plume of light, radial streaks bursting out from its left half. Right: Twenty seconds later, Didymos has rotated so its right half is more in shadow and its lower left half is brightly lit, as though a light bulb sits on its surface. Dimorphos and Didymos have moved relative to each other, so now Dimorphos is to the right of Didymos, but still below it. The ejected plume has expanded further out into space.
    Photos taken by the Italian LICIACube, short for the LICIA CubeSat for Imaging of Asteroids. These offer the closest, most detailed observations of NASA’s DART (Double Asteroid Redirection Test) impact aftermath to date. The photo on the left was taken roughly 2 minutes and 40 seconds after impact, as the satellite flew past the Didymos system. The photo on the right was taken 20 seconds later, as LICIACube was leaving the scene. The larger body, near the top of each image is Didymos. The smaller body in the lower half of each image is Dimorphos, enveloped by the cloud of rocky debris created by DART’s impact.
    NASA/ASI/University of Maryland

    On Sept. 11, 2022, engineers at a flight control center in Turin, Italy, sent a radio signal into deep space. Its destination was NASA’s DART (Double Asteroid Redirection Test) spacecraft flying toward an asteroid more than 5 million miles away.
     
    The message prompted the spacecraft to execute a series of pre-programmed commands that caused a small, shoebox-sized satellite contributed by the Italian Space Agency (ASI), called LICIACube, to detach from DART.
     
    Fifteen days later, when DART’s journey ended in an intentional head-on collision with near-Earth asteroid Dimorphos, LICIACube flew past the asteroid to snap a series of photos, providing researchers with the only on-site observations of the world’s first demonstration of an asteroid deflection.
     
    After analyzing LICIACube’s images, NASA and ASI scientists report on Aug. 21 in the Planetary Science Journal that an estimated 35.3 million pounds (16 million kilograms) of dust and rocks spewed from the asteroid as a result of the crash, refining previous estimates that were based on data from ground and space-based observations.
     
    While the debris shed from the asteroid amounted to less than 0.5% of its total mass, it was still 30,000 times greater than the mass of the spacecraft. The impact of the debris on Dimorphos’ trajectory was dramatic: shortly after the collision, the DART team determined that the flying rubble gave Dimorphos a shove several times stronger than the hit from the spacecraft itself.
     
    “The plume of material released from the asteroid was like a short burst from a rocket engine,” said Ramin Lolachi, a research scientist who led the study from NASA’s Goddard Space Flight Center in Greenbelt, Maryland.
     
    The important takeaway from the DART mission is that a small, lightweight spacecraft can dramatically alter the path of an asteroid of similar size and composition to Dimorphos, which is a “rubble-pile” asteroid — or a loose, porous collection of rocky material bound together weakly by gravity.
     
    “We expect that a lot of near-Earth asteroids have a similar structure to Dimorphos,” said Dave Glenar, a planetary scientist at the University of Maryland, Baltimore County, who participated in the study. “So, this extra push from the debris plume is critical to consider when building future spacecraft to deflect asteroids from Earth.”

    Bright blueish white dot with a glowing blue line extending to the right against a black background.
    The tail of material that formed behind Dimorphos was prominent almost 12 days after the DART impact, giving the asteroid a comet-like appearance, as seen in this image captured by NASA’s Hubble Space Telescope in October 2022. Hubble’s observations were made from roughly 6.8 million miles away.
    NASA, ESA, STScI, Jian-Yang Li (PSI); Image Processing: Joseph DePasquale

    DART’s Star Witness

    NASA chose Dimorphos, which poses no threat to Earth, as the mission target due to its relationship with another, larger asteroid named Didymos. Dimorphos orbits Didymos in a binary asteroid system, much like the Moon orbits Earth. Critically, the pair’s position relative to Earth allowed astronomers to measure the duration of the moonlet’s orbit before and after the collision.
     
    Ground and space-based observations revealed that DART shortened Dimorphos’ orbit by 33 minutes. But these long-range observations, made from 6.8 million miles (10.9 million kilometers) away, were too distant to support a detailed study of the impact debris. That was LICIACube’s job.

    After DART’s impact, LICIACube had just 60 seconds to make its most critical observations. Barreling past the asteroid at 15,000 miles (21,140 kilometers) per hour, the spacecraft took a snapshot of the debris roughly once every three seconds. Its closest image was taken just 53 miles (85.3 km) from Dimorphos’ surface.
     
    The short distance between LICIACube and Dimorphos provided a unique advantage, allowing the cubesat to capture detailed images of the dusty debris from multiple angles.
     
    The research team studied a series of 18 LICIAcube images. The first images in the sequence showed LICIACube’s head-on approach. From this angle, the plume was brightly illuminated by direct sunlight. As the spacecraft glided past the asteroid, its camera pivoted to keep the plume in view.

    Two gray objects are rotating in synch back and forth, against a black background. The object on top is bulbous and much larger and textured then the object below it. It also is lit up in bright white at the bottom. A smaller bright spot below the large object is unique because extending from it is a cone of streaks or lines that stretch outward into the black background.
    This animated series of images was taken by a camera aboard LICIACube 2 to 3 minutes after DART crashed into Dimorphos. As LICIACube made its way past the binary pair of asteroids Didymos, the larger one on top, and Dimorphos, the object at the bottom. The satellite’s viewing angle changed rapidly during its flyby of Dimorphos, allowing scientists o get a comprehensive view of the impact plume from a series of angles.
    ASI/University of Maryland/Tony Farnham/Nathan Marder

     As LICIACube looked back at the asteroid, sunlight filtered through the dense cloud of debris, and the plume’s brightness faded. This suggested the plume was made of mostly large particles — about a millimeter or more across — which reflect less light than tiny dust grains.

    Since the innermost parts of the plume were so thick with debris that they were completely opaque, the scientists used models to estimate the number of particles that were hidden from view. Data from other rubble-pile asteroids, including pieces of Bennu delivered to Earth in 2023 by NASA’s OSIRIS-REx spacecraft, and laboratory experiments helped refine the estimate.
     
    “We estimated that this hidden material accounted for almost 45% of the plume’s total mass,” said Timothy Stubbs, a planetary scientist at NASA Goddard who was involved with the study.
     
    While DART showed that a high-speed collision with a spacecraft can change an asteroid’s trajectory, Stubbs and his colleagues note that different asteroid types, such as those made of stronger, more tightly packed material, might respond differently to a DART-like impact. “Every time we interact with an asteroid, we find something that surprises us, so there’s a lot more work to do,” said Stubbs. “But DART is a big step forward for planetary defense.”
     
    The Johns Hopkins Applied Physics Laboratory in Laurel, Maryland, managed the DART mission and operated the spacecraft for NASA’s Planetary Defense Coordination Office as a project of the agency’s Planetary Missions Program Office.
     
    By Nathan Marder, nathan.marder@nasa.gov
    NASA’s Goddard Space Flight Center, Greenbelt, Md.

  • NASA Invites Media to Joint Launch of Sun, Space Weather Missions

    Technicians conduct blanket closeout work on NASA’s IMAP (Interstellar Mapping and Acceleration Probe) observatory at the Astrotech Space Operations Facility near NASA’s Kennedy Space Center in Florida on Friday, Aug. 15, 2025. The IMAP mission will explore and map the boundaries of the heliosphere — a huge bubble created by the Sun’s wind that encapsulates our entire solar system — and study how the heliosphere interacts with the local galactic neighborhood beyond.
    Technicians conduct blanket closeout work on NASA’s IMAP (Interstellar Mapping and Acceleration Probe) observatory at the Astrotech Space Operations Facility near NASA’s Kennedy Space Center in Florida on Friday, Aug. 15, 2025. The IMAP mission will explore and map the boundaries of the heliosphere — a huge bubble created by the Sun’s wind that encapsulates our entire solar system — and study how the heliosphere interacts with the local galactic neighborhood beyond.
    Credit: NASA/Kim Shiflett

    Lee esta nota de prensa en español aquí.

    Media accreditation is open for the launch of three observatories that will study the Sun and enhance the ability to make accurate space weather forecasts, helping protect technology systems that affect life on Earth.

    NASA is targeting no earlier than Tuesday, Sept. 23, for the launch of the agency’s IMAP (Interstellar Mapping and Acceleration Probe), the Carruthers Geocorona Observatory, and National Oceanic and Atmospheric Administration’s (NOAA) Space Weather Follow On–Lagrange 1 (SWFO-L1) observatory. The observatories will launch aboard a SpaceX Falcon 9 rocket from Launch Complex 39A at NASA’s Kennedy Space Center in Florida.

    Accredited media will have the opportunity to participate in prelaunch briefings and interviews with key mission personnel prior to launch, as well as cover the launch. NASA will communicate additional details regarding the media event schedule as the launch date approaches.

    Media accreditation deadlines for the launch are as follows:

    • International media without U.S. citizenship must apply by 11:59 p.m. EDT on Sunday, Aug. 31.
    • U.S. media and U.S. citizens representing international media organizations must apply by 11:59 p.m. on Thursday, Sept. 4.

    All accreditation requests must be submitted online at:

    https://media.ksc.nasa.gov

    NASA’s media accreditation policy is available online. For questions about accreditation, please email: ksc-media-accreditat@mail.nasa.gov. For other mission questions, please contact the NASA Kennedy newsroom at 321-867-2468.

    Para obtener información en español en sobre el Centro Espacial Kennedy, comuníquese con Antonia Jaramillo: 321-501-8425. Si desea solicitar entrevistas en español sobre IMAP, póngase en contacto con María-José Viñas: maria-jose.vinasgarcia@nasa.gov

    NASA’s IMAP will use 10 science instruments to study and map the heliosphere, a vast magnetic bubble surrounding the Sun protecting our solar system from radiation incoming from interstellar space. This mission and its two rideshares will orbit the Sun near Lagrange point 1, about one million miles from Earth, where it will scan the heliosphere, analyze the composition of charged particles, and investigate how those particles move through the solar system. This will provide information on how the Sun accelerates charged particles, filling in essential puzzle pieces to understand the space weather environment across the solar system. The IMAP spacecraft also will continuously monitor solar wind and cosmic radiation. Scientists can use this information to evaluate new and improved capabilities for space weather prediction tools and models, which are vital for the health of human space explorers and the longevity of technological systems, like satellites and power grids, that can affect life on Earth.

    The agency’s Carruthers Geocorona Observatory is a small satellite set to study the exosphere, the outermost part of Earth’s atmosphere. Using ultraviolet cameras, it will monitor how space weather from the Sun impacts the exosphere, which plays a crucial role in protecting Earth from space weather events that can affect satellites, communications, and power lines. The exosphere, a cloud of neutral hydrogen extending to the Moon and possibly beyond, is created by the breakdown of water and methane by ultraviolet light from the Sun, and its glow, known as the geocorona, has been observed globally only four times before this mission.

    The SWFO-L1 mission, managed by NOAA and developed with NASA’s Goddard Space Flight Center in Greenbelt, Maryland, and commercial partners, will use a suite of instruments to provide real-time measurements of solar wind, along with a compact coronagraph to detect coronal mass ejections from the Sun. The observatory, serving as an early warning beacon for potentially destructive space weather events, will enable faster and more accurate forecasts. Its 24/7 data will support NOAA’s Space Weather Prediction Center in protecting vital infrastructure, economic interests, and national security, both on Earth and in space.

    David McComas, professor, Princeton University, leads the IMAP mission with an international team of 25 partner institutions. The Johns Hopkins Applied Physics Laboratory in Laurel, Maryland, built the spacecraft and operates the mission. NASA’s IMAP is the fifth mission in NASA’s Solar Terrestrial Probes program portfolio. The Explorers and Heliophysics Project Division at NASA Goddard manages the program for the agency’s Heliophysics Division of NASA’s Science Mission Directorate.

    NASA’s Launch Services Program, based at NASA Kennedy, manages the launch service for the mission.

    For more details about the IMAP mission and updates on launch preparations, visit:

    https://science.nasa.gov/mission/imap/

    -end-

    Abbey Interrante
    Headquarters, Washington
    301-201-0124
    abbey.a.interrante@nasa.gov

    Sarah Frazier
    Goddard Space Flight Center, Greenbelt, Md.
    202-853-7191
    sarah.frazier@nasa.gov

    Leejay Lockhart
    Kennedy Space Center, Fla.
    321-747-8310
    leejay.lockhart@nasa.gov

    John Jones-Bateman
    NOAA’s Satellite and Information Service, Silver Spring, Md.
    202-242-0929
    john.jones-bateman@noaa.gov

  • Curiosity Blog, Sols 4636-4637: Up Against a Wall

    2 min read

    Curiosity Blog, Sols 4636-4637: Up Against a Wall

    A grayscale photo from the Martian surface shows rocky, uneven terrain in medium gray. Part of the Curiosity rover fills most of the bottom half of the image, brightly lit in some places and shadowed in others. In front of it, visible in the upper right corner of the image, a virtual wall composed of stacked, jagged, horizontal layers of stone; this abutment appears to block the rover’s path.
    NASA’s Mars rover Curiosity acquired this image, showing itself parked at the wall of a fracture named “Río Frío.” Curiosity used its Left Navigation Camera on Aug. 19, 2025 — Sol 4634, or Martian day 4,634 of the Mars Science Laboratory mission — at 14:51:33 UTC.
    NASA/JPL-Caltech

    Written by Michelle Minitti, MAHLI Deputy Principal Investigator, Framework

    Earth planning date: Wednesday, Aug. 20, 2025

    What does a good rover do when her back is up against a wall? Fight for science!

    Curiosity indeed fought the good fight at “Río Frío,” the wall of one of the many ridges cutting through the boxwork terrain we have been systematically exploring. The observations along the wall today provide insight into the internal structure and chemistry of the ridges, hopefully giving us clues as to why they are standing proud relative to the surrounding terrain.

    The structural story will be told by the large Mastcam mosaics we planned, covering the ridge from base to top, and from a MAHLI mosaic covering a horizon of the wall filled with resistant nodules and smooth, swooping surfaces cutting in all directions that are likely veins. The mosaic target, “Jardín de las Delicias,” will surely yield a surfeit of Martian delights. The chemical story will be told by APXS analysis of the nodule-filled target “Minimini” and SuperCam analysis of a vein at “El Tapado.” In contrast to the ridge itself, we planned a Mastcam mosaic of part of the hollow at the base of the ridge at target “Playa Zapatilla.” 

    Beyond the ridge, we planned Mastcam and ChemCam imaging of the “Paniri” and “Mishe Mokwa” buttes, respectively, and sky observations with Navcam and Mastcam. DAN, RAD, and REMS run periodically through the plan keeping their eye on the Martian environment. Our drive will take us to a smaller ridge perpendicular to Río Frío, where we will once again fight to learn the secrets these ridges have to tell about  Mars’ past.

    A rover sits on the hilly, orange Martian surface beneath a flat grey sky, surrounded by chunks of rock.
    NASA’s Mars rover Curiosity at the base of Mount Sharp
    NASA/JPL-Caltech/MSSS

    Details

    Last Updated

    Aug 20, 2025

    Related Terms

  • NASA, IBM’s ‘Hot’ New AI Model Unlocks Secrets of Sun

    6 min read

    NASA, IBM’s ‘Hot’ New AI Model Unlocks Secrets of Sun

    This image from June 20, 2013 shows the bright light of a solar flare and an eruption of solar material shooting through the sun’s atmosphere, called a prominence eruption. Shortly thereafter, this same region of the sun sent a coronal mass ejection out into space — a phenomenon which can cause magnetic storms that degrade communication signals and cause unexpected electrical surges in power grids on Earth. NASA’s new heliophysics AI foundation model, Surya, can help predict these storms.
    NASA/Goddard/SDO

    Editor’s Note: This article was updated Aug. 20, 2025, to correct the number of years of training data used and the model accuracy. The original article said the model was trained on 14 years of Solar Dynamics Observatory data and surpassed existing benchmarks by 15%; the model was actually trained on 9 years of data and surpassed existing benchmarks by 16%.

    NASA is turning up the heat in solar science with the launch of the Surya Heliophysics Foundational Model, an artificial intelligence (AI) model trained on 9 years of observations from NASA’s Solar Dynamics Observatory

    Developed by NASA in partnership with IBM and others, Surya uses advances in AI to analyze vast amounts of solar data, helping scientists better understand solar eruptions and predict space weather that threatens satellites, power grids, and communication systems. The model can be used to provide early warnings to satellite operators and helps scientists predict how the Sun’s ultraviolet output affects Earth’s upper atmosphere.

    Preliminary results show Surya is making strides in solar flare forecasting, a long-standing challenge in heliophysics. Surya, with its ability to generate visual predictions of solar flares two hours into the future, marks a major step towards the use of AI for operational space weather prediction. These initial results surpass existing benchmarks by 16%. By providing open access to the model on HuggingFace and the code on GitHub, NASA encourages the science and applications community to test and explore this AI model for innovative solutions that leverage the unique value of continuous, stable, long-duration datasets from the Solar Dynamics Observatory.

    Illustrations of Solar Dynamics Observatory solar imagery used for training Surya: Solar coronal ultraviolet and extreme ultraviolet images from the Atmospheric Imaging Assembly (AIA) and solar surface velocity and magnetic field maps from the Helioseismic and Magnetic Imager (HMI).
    Illustrations of Solar Dynamics Observatory solar imagery used for training Surya: Solar coronal ultraviolet and extreme ultraviolet images from the Atmospheric Imaging Assembly (AIA) and solar surface velocity and magnetic field maps from the Helioseismic and Magnetic Imager (HMI).
    NASA/SDO

    The model’s success builds directly on the Solar Dynamics Observatory’s long-term database. Launched in 2010, NASA’s Solar Dynamics Observatory has provided an unbroken, high-resolution record of the Sun for nearly 15 years through capturing images every 12 seconds in multiple wavelengths, plus precise magnetic field measurements. This stable, well-calibrated dataset, spanning an entire solar cycle, is uniquely suited for training AI models like Surya, enabling them to detect subtle patterns in solar behavior that shorter datasets would miss.

    Surya’s strength lies in its foundation model architecture, which learns directly from raw solar data. Unlike traditional AI systems that require extensive labeling, Surya can adapt quickly to new tasks and applications. Applications include tracking active regions, forecasting flare activity, predicting solar wind speed, and integrating data from other observatories including the joint NASA-ESA Solar and Heliospheric Observatory mission and NASA’s Parker Solar Probe.

    “We are advancing data-driven science by embedding NASA’s deep scientific expertise into cutting-edge AI models,” said Kevin Murphy, chief science data officer at NASA Headquarters in Washington. “By developing a foundation model trained on NASA’s heliophysics data, we’re making it easier to analyze the complexities of the Sun’s behavior with unprecedented speed and precision. This model empowers broader understanding of how solar activity impacts critical systems and technologies that we all rely on here on Earth.”

    Three images of the Sun — the model input from January 7, 2014 at 3:24pm, the Surya model’s forecast for what the Sun would look like three hours later at 6:24pm, and the true observation from 6:24pm. The model forecast and the true observation are almost identical.
    These images compare the ground-truth data (right) with model output (center) for solar flares, which are the events behind most space weather. Surya’s prediction is very close to what happened in reality (right). These preliminary results suggest that Surya has learned enough solar physics to predict the structure and evolution of a solar flare by looking at its beginning phase.
    NASA/SDO/ODSI IMPACT AI Team

    Solar storms pose significant risks to our technology-dependent society. Powerful solar events energize Earth’s ionosphere, resulting in substantial GPS errors or complete signal loss to satellite communications. They also pose risks to power grids, as geomagnetically induced currents from coronal mass ejections can overload transformers and trigger widespread outages.

    In commercial aviation, solar flares can disrupt radio communications and navigation systems while exposing high-altitude flights to increased radiation. The stakes are even higher for human spaceflight. Astronauts bound for the Moon or Mars may need to depend on precise predictions to shelter from intense radiation during solar particle events.

    The Sun’s influence extends to the growing number of low Earth orbit satellites, including those that deliver global high-speed internet. As solar activity intensifies, it heats Earth’s upper atmosphere, increasing drag that slows satellites, pulls them from orbit, and causes premature reentry. Satellite operators often struggle to forecast where and when solar flares might affect these satellites.

    A row of Solar Dynamic Observatory images followed by a row of predictions from the Surya model. The two rows are almost identical.
    The “ground truth” solar activity is shown on the top row. The bottom row shows solar activity predicted by Surya.
    NASA/SDO/ODSI IMPACT AI Team

    “Our society is built on technologies that are highly susceptible to space weather,” said Joseph Westlake, Heliophysics Division director at NASA Headquarters. “Just as we use meteorology to forecast Earth’s weather, space weather forecasts predict the conditions and events in the space environment that can affect Earth and our technologies. Applying AI to data from our heliophysics missions is a vital step in increasing our space weather defense to protect astronauts and spacecraft, power grids and GPS, and many other systems that power our modern world.”

    While Surya is designed to study the Sun, its architecture and methodology are adaptable across scientific domains. From planetary science to Earth observation, the project lays the foundational infrastructure for similar AI efforts in diverse domains.

    Surya is part of a broader NASA push to develop open-access, AI-powered science tools. Both the model and training datasets are freely available online to researchers, educators, and students worldwide, lowering barriers to participation and sparking new discoveries.

    A graphic showing the process of training the Surya heliophysics AI model. First, NASA’s Solar Dynamics Observatory collects observational data about the Sun. Then, that data is preprocessed for the model. Then, the model is pretrained, and finally, the heliophysics foundation model is ready for use.
    The process for creating Surya. Foundation models enhance the utility of NASA’s Solar Dynamics Observatory datasets and create a base for building new applications.
    NASA/ODSI IMPACT AI Team

    Surya’s training was supported in part by the National Artificial Intelligence Research Resource (NAIRR) Pilot, a National Science Foundation (NSF)-led initiative that provides researchers with access to advanced computing, datasets, and AI tools. The NAIRR Pilot brings together federal and industry resources, such as computing power from NVIDIA, to expand access to the infrastructure needed for cutting-edge AI research.

    “This project shows how the NAIRR Pilot is uniting federal and industry AI resources to accelerate scientific breakthroughs,” said Katie Antypas, director of NSF’s Office of Advanced Cyberinfrastructure. “With support from NVIDIA and NSF, we’re not only enabling today’s research, we’re laying the groundwork for a national AI network to drive tomorrow’s discoveries.”

    Surya is part of a larger effort championed and supported by NASA’s Office of the Chief Science Data Officer and Heliophysics Division, the NSF , and partnering universities to advance NASA’s scientific missions through innovative data science and AI models. Surya’s AI architecture was jointly developed by the Interagency Implementation and Advanced Concepts Team (IMPACT) under the Office of Data Science and Informatics  at NASA’s Marshall Space Flight Center in Huntsville, Alabama; IBM; and a collaborative science team.

    The science team, assembled by NASA Headquarters, consisted of experts from the Southwest Research Institute in San Antonio, Texas; the University of Alabama in Huntsville in Huntsville, Alabama; the University of Colorado Boulder in Boulder, Colorado; Georgia State University in Atlanta, Georgia; Princeton University in Princeton, New Jersey; NASA’s SMD’s Heliophysics Division; NASA’s Goddard Space Flight Center in Greenbelt, Maryland; NASA’s Jet Propulsion Laboratory in Pasadena, California; and the SETI Institute in Mountain View, California.

    For a behind-the-scenes dive into Surya’s architecture, industry and academic collaborations, challenges behind developing the model, read the blog post on NASA’s Science Data Portal:

    https://science.data.nasa.gov/features-events/inside-surya-solar-ai-model

    For more information about NASA’s strategy of developing foundation models for science, visit:

    https://science.nasa.gov/artificial-intelligence-science

  • Curiosity Blog, Sols 4634-4635: A Waiting Game

    3 min read

    Curiosity Blog, Sols 4634-4635: A Waiting Game

    A grayscale image from the Martian surface shows dark gray, very rocky terrain. What looks like a field of numerous small shards of rock dips slightly as it extends from the bottom of the frame off to the distance. About halfway up, a ridge that looks like it’s composed of many thin layers of rock extends from the middle left side toward the upper right side in a gentle slope. Another hill lies beyond that, more jagged, but also rising gently in the opposite direction, toward the upper left corner of the image.
    NASA’s Mars rover Curiosity acquired this image using its Left Navigation Camera on Aug. 18, 2025 — Sol 4633, or Martian day 4,633 of the Mars Science Laboratory mission — at 12:39:47 UTC.
    NASA/JPL-Caltech

    Written by Lucy Thompson, Planetary Scientist and APXS Team Member, University of New Brunswick, Canada

    Earth Planning Date: Monday, Aug. 18, 2025

    The downlink data from our weekend activities arrived on Earth as we started planning this morning. As the APXS payload uplink and downlink lead, I assess the downlink data to ensure that our observations executed and that the instrument is healthy before we can proceed with the day’s activities. We also need that downlink data to assess which targets we can safely touch with Curiosity’s arm, to place APXS and MAHLI to analyze chemistry and closeup textures, respectively, as well as target for Mastcam and ChemCam, and plan the next drive. Because of the relatively late downlink, we all waited patiently for the necessary data to be processed before we could really start to plan in earnest. 

    It is always exciting to see our new parking spot and the view in front of the rover. Today was no exception. The drive executed as planned and we are on stable ground, which will enable us to unstow the arm for contact science with APXS and MAHLI.

    We selected a representative bedrock patch (“Gil”) that was large enough and smooth enough to brush for dust removal, and to place APXS and MAHLI on. ChemCam will also analyze this target with LIBS, and Mastcam will capture a documentation image. The bedrock at this location is representative of an intermediate zone between the large resistant ridges and hollows that comprise the boxwork terrain that we are currently exploring. Mastcam will image the wall of a prominent resistant ridge that we are driving to (“Río Frío”), as well as a narrow, sand-filled trough (“Cusi Cusi”). The remote long-distance imaging capabilities of ChemCam will be used to look at the base of the Mishe Mokwa butte, off to the east.

    Observations to monitor the atmosphere are also planned before we drive away from this location. They include a Navcam large dust-devil survey and suprahorizon movie, and a Mastcam tau observation to observe dust in the atmosphere. After the touch (and targeted science) part of this touch-and-go plan, the drive (go part) should take us about 36 meters (about 118 feet) to the wall of Río Frío. (see associated image). 

    After the drive, we will document the ground beneath the rover’s wheels with MARDI before some untargeted science. Mastcam will again image Río Frío in early morning light, trying to highlight structures and veins that might be present, and ChemCam will utilize their autonomous targeting capabilities to analyze a bedrock target in our new workspace. Two more atmospheric observations are also squeezed in before we hand over to the next plan: a Navcam cloud-altitude observation and line-of-sight scan. 

    Standard REMS, DAN and RAD activities round out this jam-packed plan. The downlink was well worth the wait!

    A rover sits on the hilly, orange Martian surface beneath a flat grey sky, surrounded by chunks of rock.
    NASA’s Mars rover Curiosity at the base of Mount Sharp
    NASA/JPL-Caltech/MSSS

    Details

    Last Updated

    Aug 19, 2025

    Related Terms