from NASA’s Heliophysics Education Activation Team (NASA HEAT) and the Astronomical Society of the Pacific/Night Sky Network
Have you ever wondered about what the Sun is made of? Or why do you get sunburned on even cloudy days? NASA’s new Explore the Sun toolkit brings the wonders of solar science to you, offering answers to these questions and more!
Solar images from NASA’s Solar Dynamics Observatory show different features on the Sun, including sunspots in the visible light spectrum. Filaments and prominences can be seen in hydrogen-alpha, coronal mass ejections in X-ray, and details in ultraviolet light. On the right side of the banner, aurorae observed on Earth by the International Space Station is shown, along with aurorae on other planets as seen by NASA’s Hubble Space Telescope and James Webb Space Telescope.
NASA/Astronomical Society of the Pacific
A collaboration between NASA’s Heliophysics Education Activation Team (NASA HEAT) and the Astronomical Society of the Pacific’s Night Sky Network program, this resource was developed for informal educators, amateur astronomers, and astronomy enthusiasts alike, providing engaging activities for anyone eager to learn more about our nearest star.
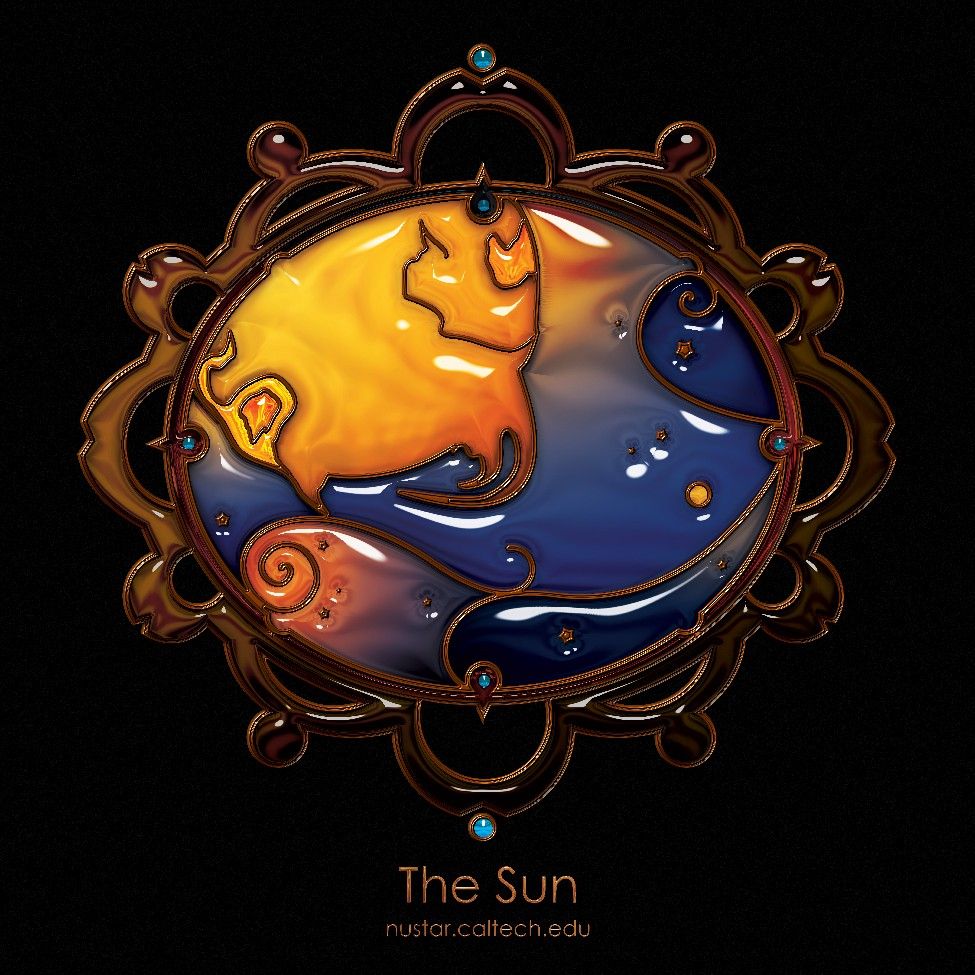
Whether you’re hosting a solar viewing event or an indoor presentation, the Our Dynamic Sun toolkit provides easy-to-use materials designed to spark curiosity. Each card in the set pairs NASA images with clear explanations for each topic:
“What color is the Sun?” (hint: it’s not yellow!)
“How does the Sun affect us here on Earth?”
“When will the Sun die?”
These cards not only answer common questions the public may have, but also highlight how NASA’s solar research helps us understand space weather, solar storms, and their impacts on our daily lives.
Bring the Sun’s story to your community and inspire the next generation of explorers. You can download this free Our Dynamic Sun toolkit here: https://bit.ly/suntoolkit
NASA’s Worm logo is displayed in front of the agency’s headquarters in Washington.
Credit: NASA
Two NASA employees are being honored as part of the Samuel J. Heyman Service to America Medals, also known as the Sammies, recognizing outstanding federal employees who are addressing many of our country’s greatest challenges.
Rich Burns of NASA’s Goddard Space Flight Center in Greenbelt, Maryland, and John Blevins of Marshall Space Flight Center in Huntsville, Alabama, were selected out of 350 nominees and are among 23 individuals and teams honored for their achievements as federal employees. They will be recognized at a ceremony in Washington on Tuesday, June 17, that also will be live streamed on the Sammies website. The honorees will be commended via videos and presenter remarks and receive medals for their achievements.
Named after the founder of the Partnership for Public Service, the 2025 Service to America Medals awards celebrate federal employees who provided critical public services and made outstanding contributions to the health, safety, and national security of our country.
“Rich and John exemplify the spirit of exploration and service that defines NASA and our nation’s civil servants,” said acting NASA Administrator Janet Petro. “Their leadership, ingenuity, and dedication have not only advanced America’s space program but also inspired the next generation of innovators. We are proud to see their achievements recognized among the very best of federal service.”
Richard Burns, project manager for the Origins, Spectral Interpretation, Resource Identification, and Security – Regolith Explorer (OSIRIS-REx) at NASA’s Goddard Space Flight Center in Greenbelt, Maryland, and honoree of the 2025 Samuel J. Heyman Service to America Medals
Credit: NASA
Burns was the project manager of the Origins, Spectral Interpretation, Resource Identification, and Security – Regolith Explorer (OSIRIS-REx) mission to collect a sample from an asteroid and oversaw operations from the developmental stage to the successful landing of the spacecraft’s Sample Return Capsule.
The mission launched on Sept. 18, 2016, and after a nearly four-year journey, the OSIRIS-REx spacecraft successfully collected a sample from the asteroid Bennu on Oct. 20, 2020, which returned to Earth on Sept. 24, 2023, providing scientists with 120 grams of pristine material to study, the largest amount ever collected from an asteroid. Working to solidify OSIRIS-REx as a success, Burns set up multiple partnerships and communicated frequently with scientists, large and small businesses, NASA centers, and others to ensure the mission’s vision was carried out though each phase.
During the mission, Burns had to handle unique challenges that required adapting to new situations. These included improving flight software to help the spacecraft avoid hazardous parts of Bennu’s rocky surface and working with NASA leaders to find a way to best protect the sample collected from Bennu after a large stone propped the collection canister open. Finally, when the sample was set to return to Earth, Burns worked extensively with NASA and military partners to prepare for the landing, focusing on the safety of the public along with the integrity of the sample to ensure the final part of the mission was a success.
Burns helped OSIRIS-REx exceed its objectives all while under the original budget, allowing NASA to share a portion of the sample with more than 80 research projects and make new discoveries about the possible origins of life on our planet. The spacecraft, now known as Origins, Spectral Interpretation, Resource Identification and Security – Apophis Explorer, is scheduled to rendezvous with the asteroid Apophis in 2029.
“It’s humbling to accept an award based on the achievements of the amazingly talented, dedicated, and innovative OSIRIS-REx team,” Burns said. “I consider myself privileged to be counted among a team of true explorers who let no obstacle stand in the way of discovery.”
John Blevins, chief engineer for the SLS (Space Launch System) rocket at NASA’s Marshall Space Flight Center in Huntsville, Alabama, stands inside the Vehicle Assembly Building at Kennedy Space Center in Florida during the stacking of the Artemis I rocket ahead of its first test flight, which successfully launched from Kennedy on Nov. 16, 2022.
Credit: NASA
Blevins is the chief engineer for the Space Launch System (SLS) rocket and is responsible for the various technical decisions that need to be made to ensure each mission is successful. This included calculating structural needs, thermal analyses of the effects, and studies of vibrations, acoustics, propulsion integration, among other work.
Artemis I, the first test flight of the SLS rocket, successfully launched from NASA’s Kennedy Space Center in Florida on Nov. 16, 2022. In the time leading up to and during launch, Blevins led the team integrating the hardware for the mission working to address unexpected events while SLS was on the pad prior to launch. This included significant lightning storms and two hurricanes impacting Kennedy Space Center in Florida.
Blevins built a working coalition of engineering teams across the agency that previously did not exist. His ability to forge strong relationships on the various teams across the agency allowed for the successful launch of Artemis I. He continues to lead the engineering team behind SLS as they prepare for Artemis II, the second flight of SLS and the first crewed lunar mission of the 21st century.
“This is a reflection on the hard work and dedication of the entire Artemis Team,” Blevins said. “I am working with an incredibly competent, dedicated team agencywide that goes above and beyond to promote the space exploration goals of our nation. I am honored to accept the award on their behalf.”
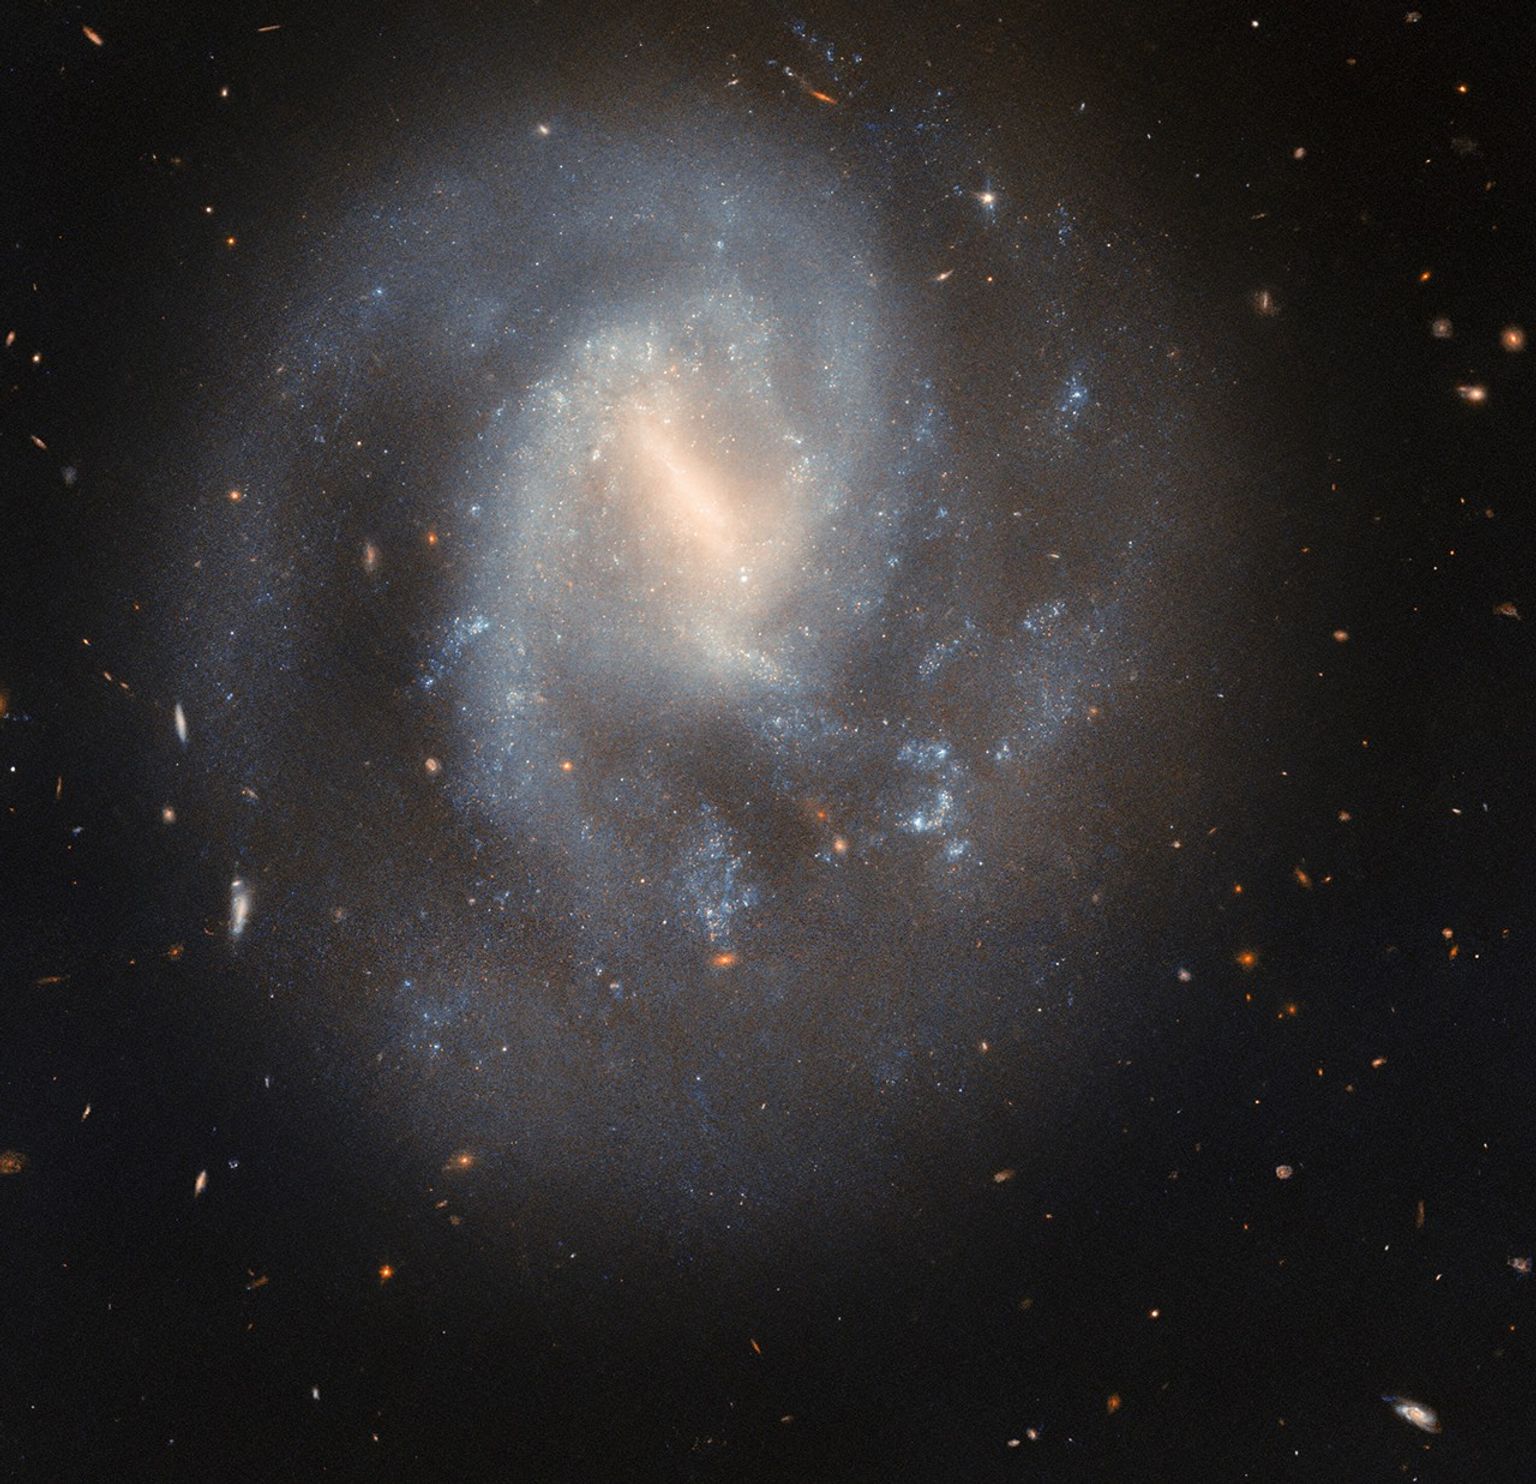
This NASA/ESA Hubble Space Telescope image features the barred spiral galaxy IC 758.
ESA/Hubble & NASA, C. Kilpatrick
This serene spiral galaxy hides a cataclysmic past. The galaxy IC 758, shown in this NASA/ESA Hubble Space Telescope image, is situated 60 million light-years away in the constellation Ursa Major.
Hubble captured this image in 2023. IC 758 appears peaceful, with its soft blue spiral arms curving gently around its hazy barred center. However, in 1999, astronomers spotted a powerful explosion in this galaxy. The supernova SN 1999bg marked the dramatic end of a star far more massive than the Sun.
Researchers do not know exactly how massive this star was before it exploded, but will use these Hubble observations to measure the masses of stars in SN 1999bg’s neighborhood. These measurements will help them estimate the mass of the star that went supernova. The Hubble data may also reveal whether SN 1999bg’s progenitor star had a companion, which would provide additional clues about the star’s life and death.
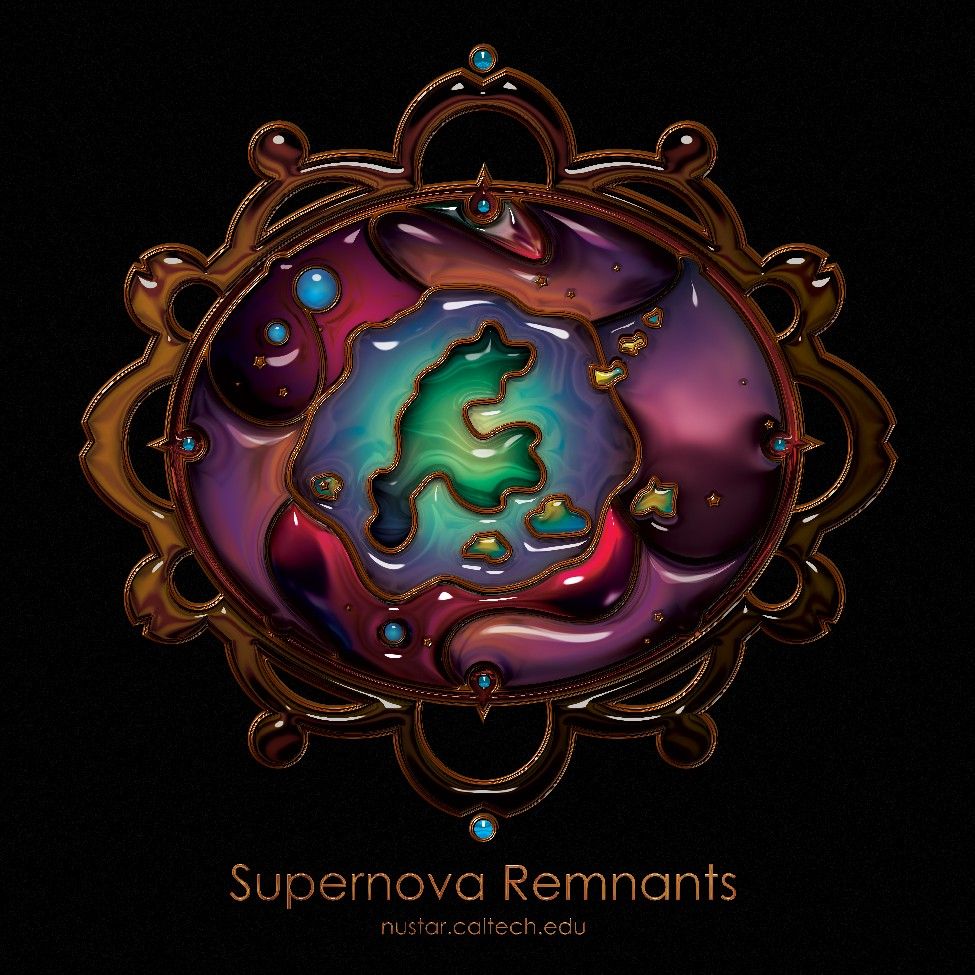
A supernova represents more than just the demise of a single star — it’s also a powerful force that can shape its neighborhood. When a massive star collapses, triggering a supernova, its outer layers rebound off its shrunken core. The explosion stirs the interstellar soup of gas and dust out of which new stars form. This interstellar shakeup can scatter and heat nearby gas clouds, preventing new stars from forming, or it can compress them, creating a burst of new star formation. The cast-off layers enrich the interstellar medium, from which new stars form, with heavy elements manufactured in the core of the supernova.
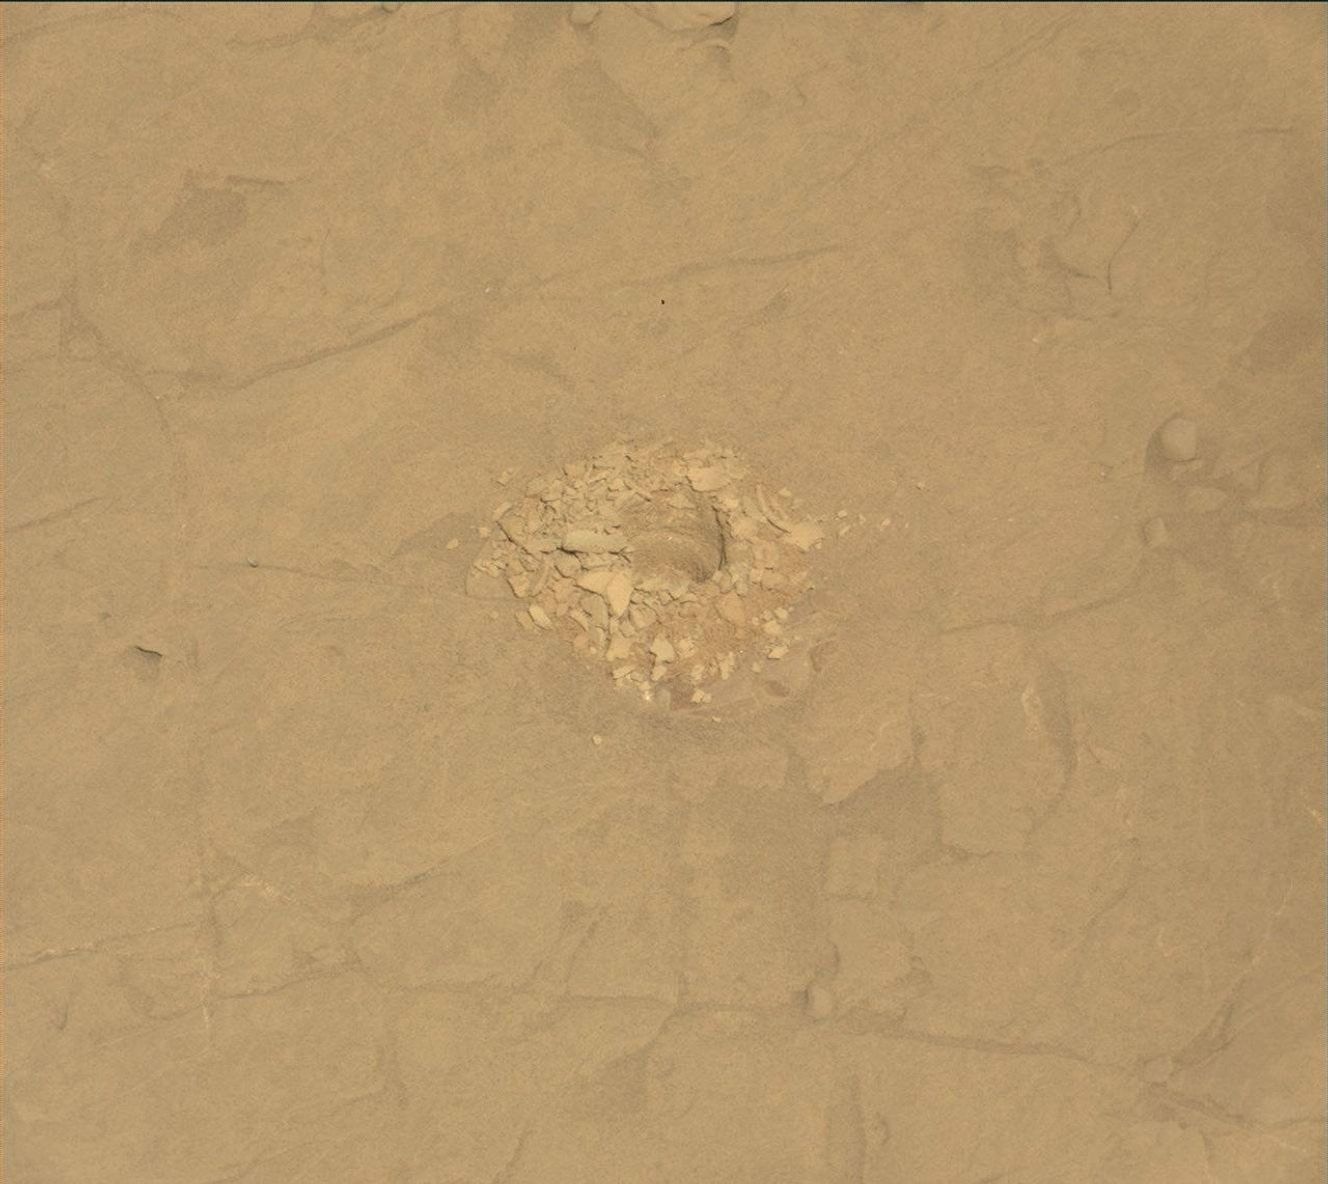
Curiosity Blog, Sols 4568-4569: A Close Look at the Altadena Drill Hole and Tailings
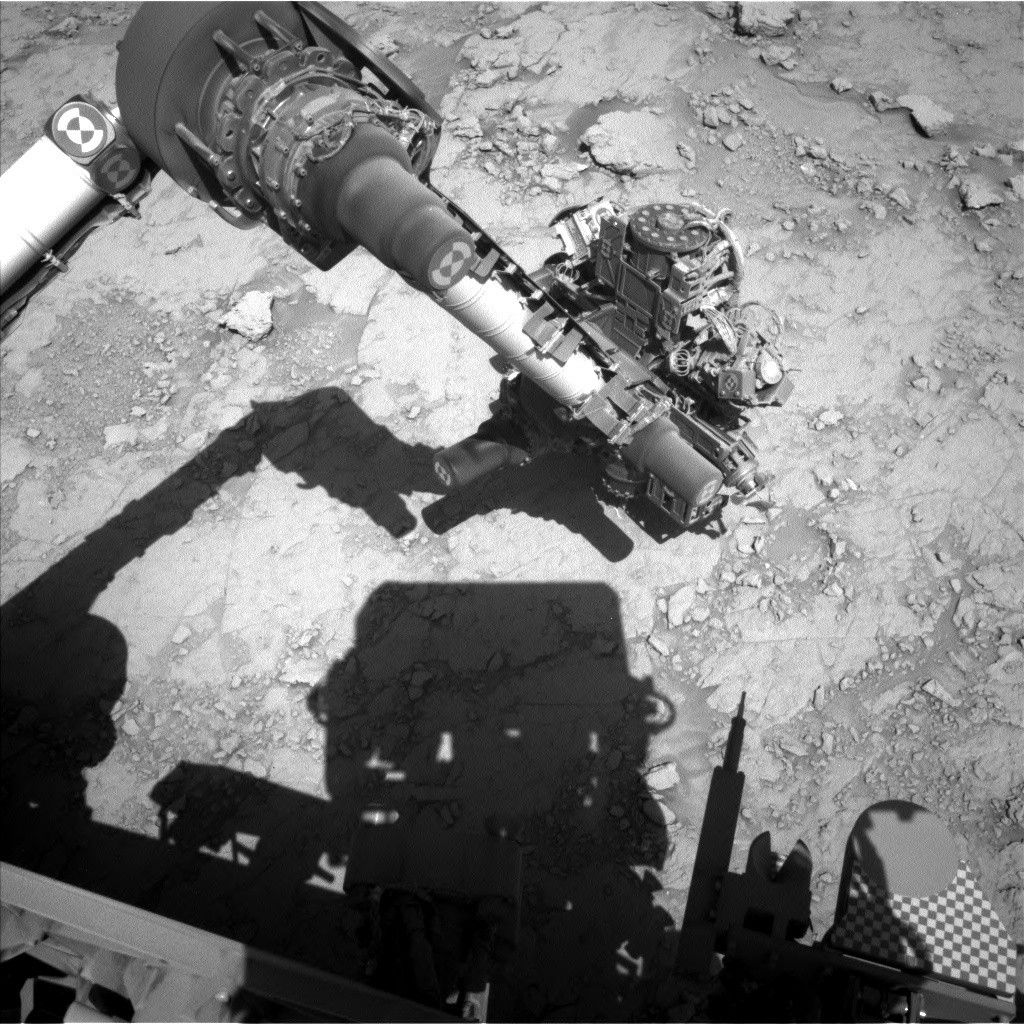
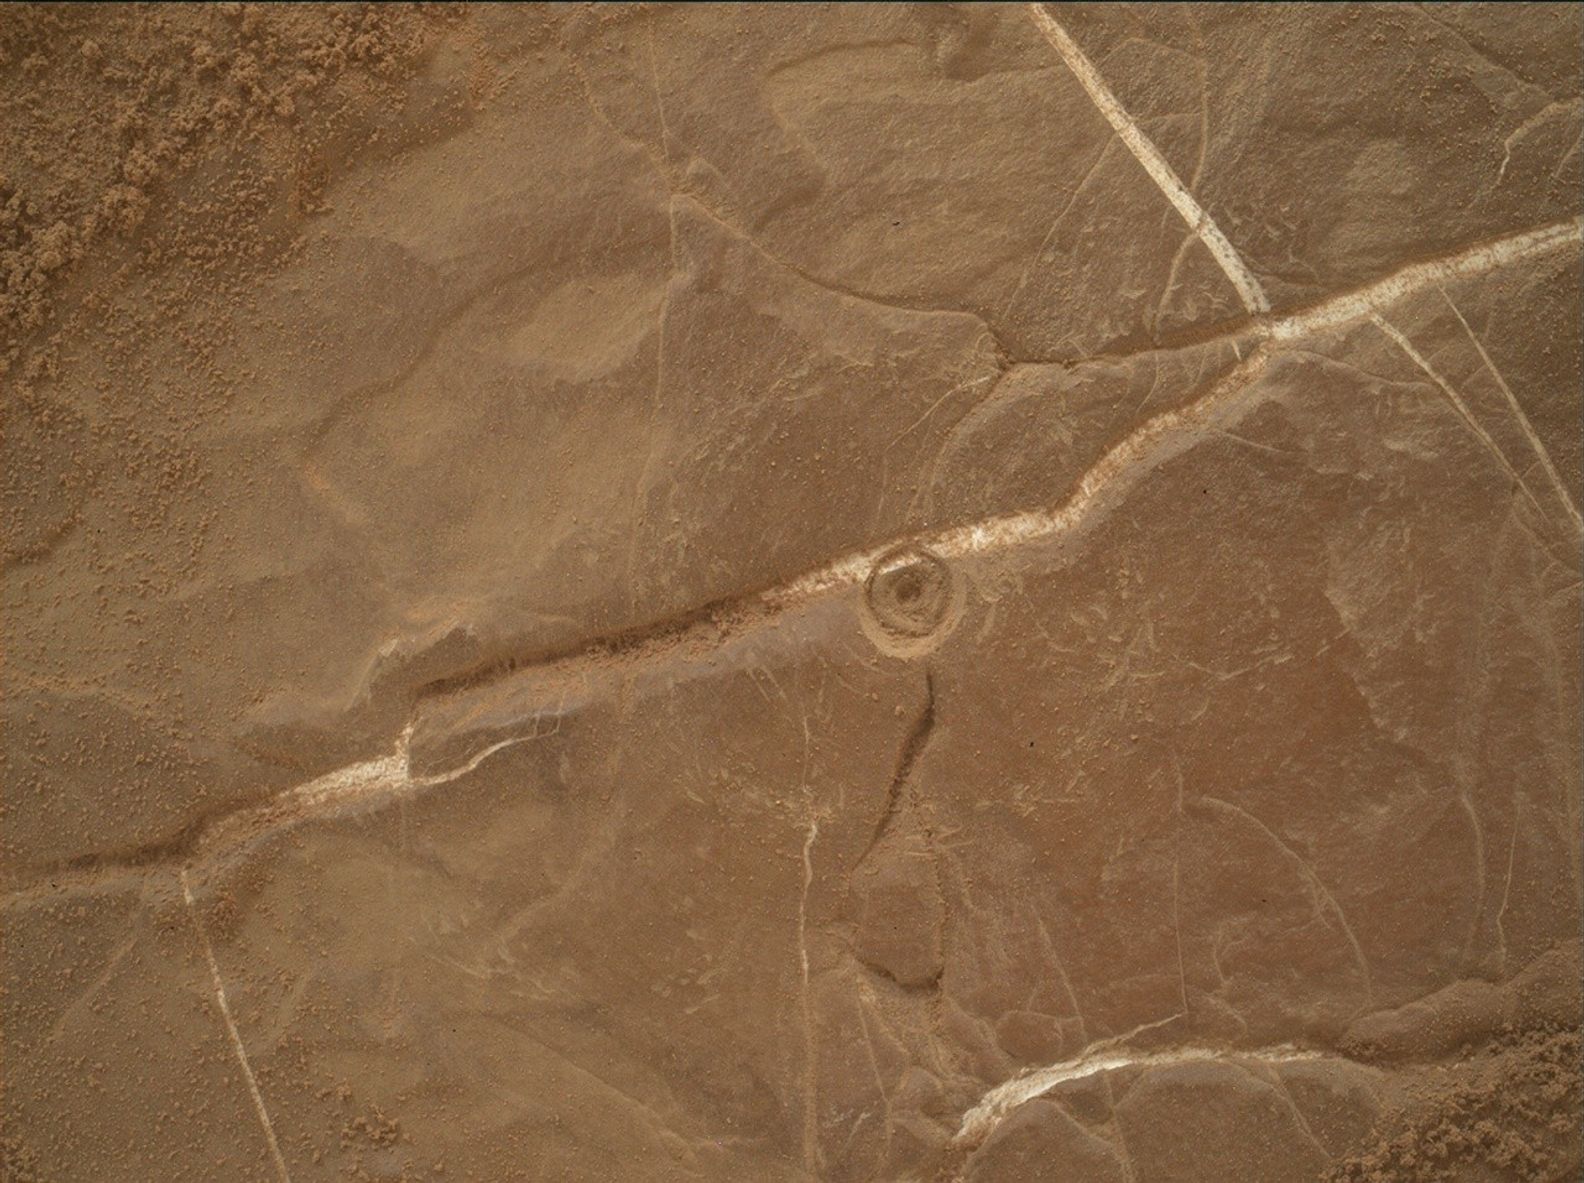
NASA’s Mars rover Curiosity acquired this image of the “Altadena” drill hole using its Mast Camera (Mastcam) on June 8, 2025 — Sol 4564, or Martian day 4,564 of the Mars Science Laboratory mission — at 13:57:45 UTC.
NASA/JPL-Caltech/MSSS
Written by Sharon Wilson Purdy, Planetary Geologist at the Smithsonian National Air and Space Museum
Earth planning date: Wednesday, June 11, 2025
As we near the end of our Altadena drill campaign, Curiosity continued her exploration of the Martian bedrock within the boxwork structures on Mount Sharp. After successfully delivering a powdered rock sample to both the CheMin (Chemistry and Mineralogy) and SAM (Sample Analysis at Mars) instruments, the focus for sols 4568 and 4569 was to take a closer look at the drill hole itself — specifically, the interior walls of the drill hole and the associated tailings (the rock material pushed out by the drill).
In the image above, you can see that the tone (or color) of the rock exposed within the wall of the drill hole appears to change slightly with depth, and the drill tailings are a mixture of fine powder and more solid clumps. If you compare the Altadena drill site with the 42 drill sites that came before, one can really appreciate the impressive range of colors, textures, and grain sizes in the rocks that Curiosity has analyzed over the past 12 years. Every drill hole marks a window into the past and can help us understand how the ancient environment and climate on Mars evolved over time.
In this two-sol plan, the ChemCam, Mastcam, APXS, and MAHLI instruments coordinated their observations to image and characterize the chemistry of the wall of the drill hole and tailings before we drive away from this site over the coming weekend. Outside of our immediate workspace, Mastcam created two stereo mosaics that will image the boxwork structures nearby as well as the layers within Texoli butte. ChemCam assembled three long-distance RMI images that will help assess the layers at the base of the “Mishe Mokwa” hill, complete the imaging of the nearby boxwork structures, and image the very distant crater rim (about 90 kilometers, or 56 miles away) and sky to investigate the scattering properties of the atmosphere. The environmental theme group included observations that will measure the properties of the atmosphere and also included a dust-devil survey.
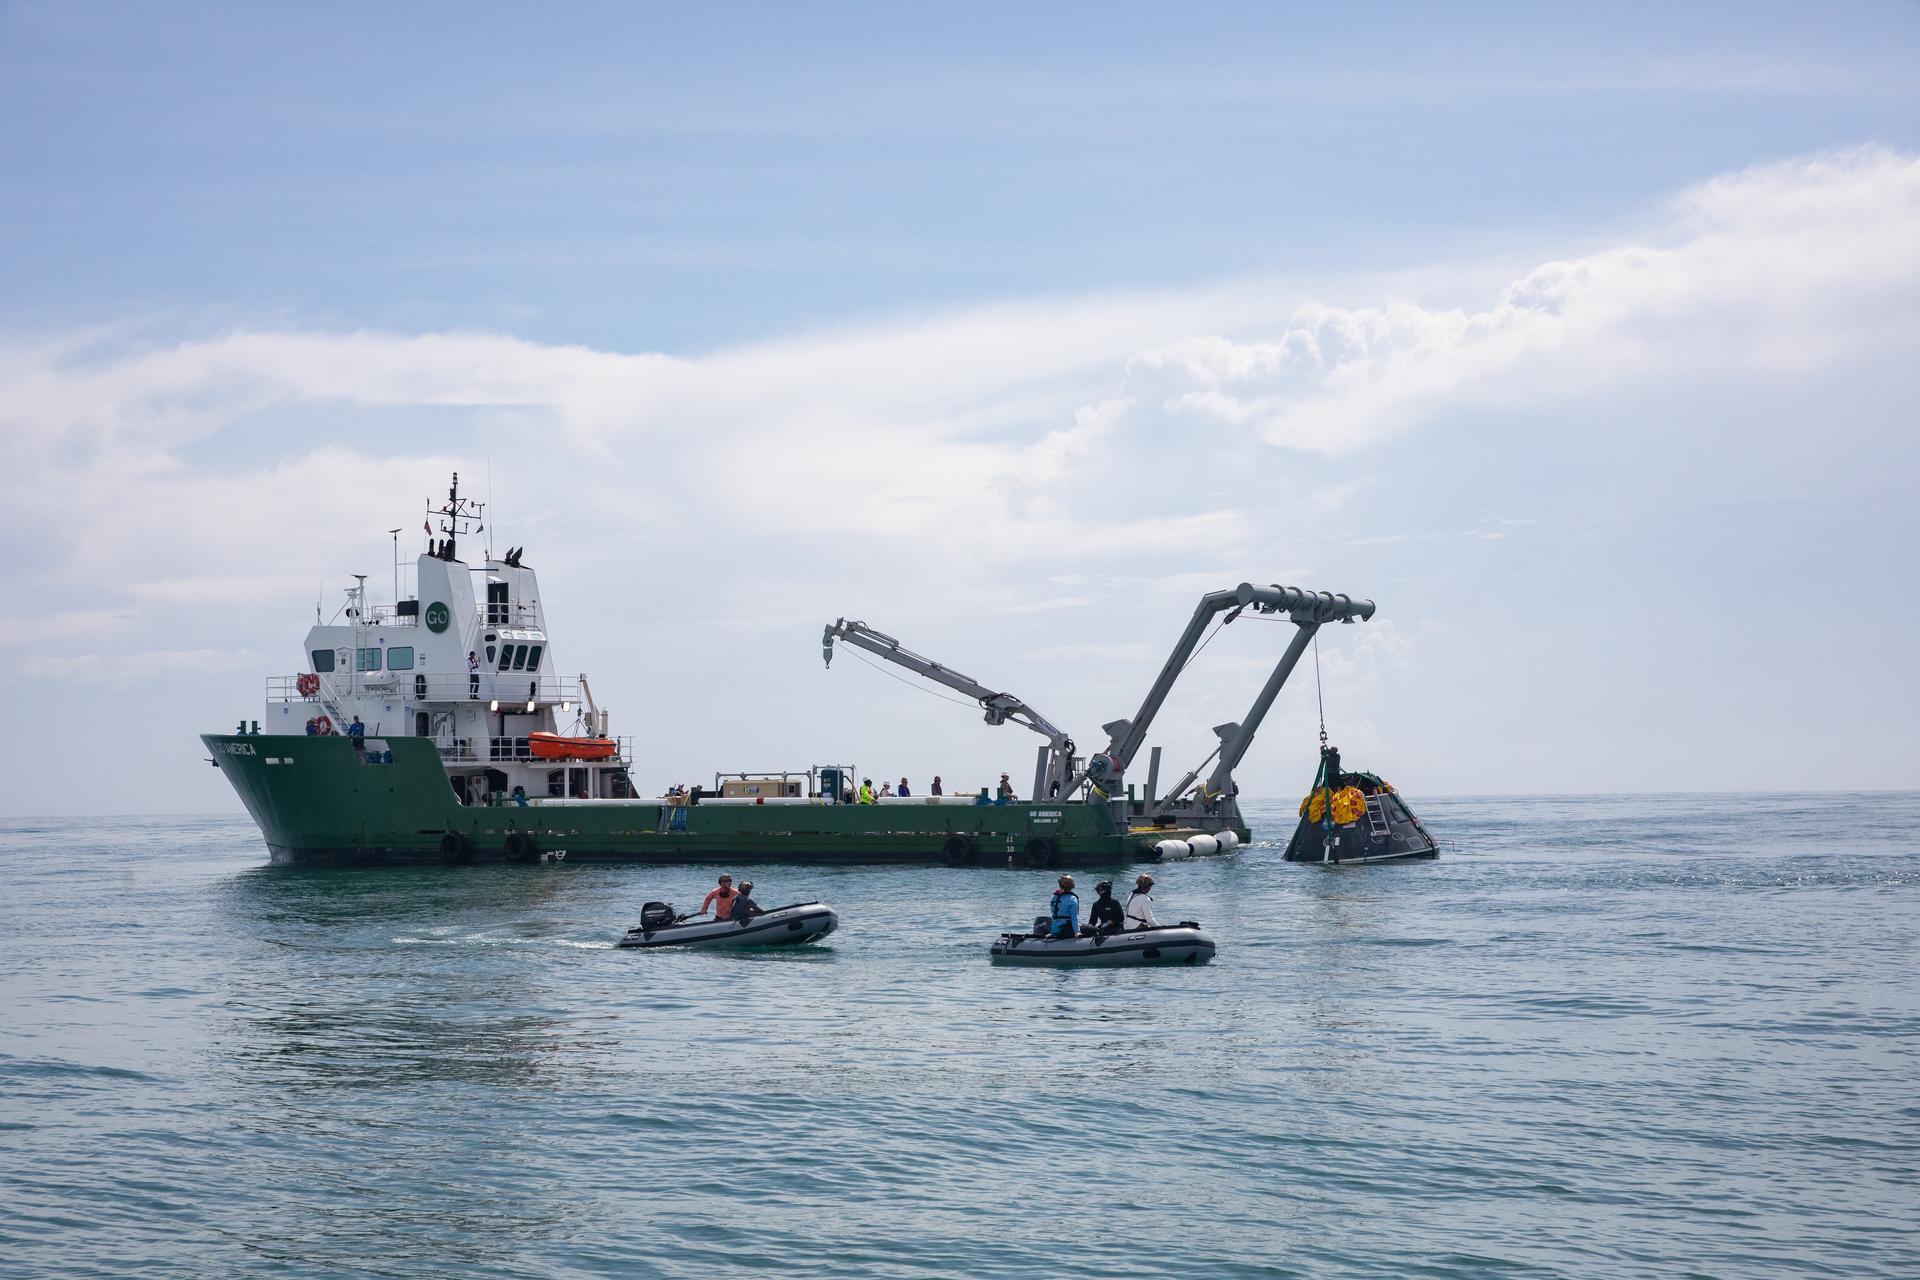
Teams with NASA and the Department of Defense (DoD) rehearse recovery procedures for a launch pad abort scenario off the coast of Florida near the agency’s Kennedy Space Center on Wednesday, June 11, 2025.
NASA/Isaac Watson
NASA and the Department of Defense (DoD) teamed up June 11 and 12 to simulate emergency procedures they would use to rescue the Artemis II crew in the event of a launch emergency. The simulations, which took place off the coast of Florida and were supported by launch and flight control teams, are preparing NASA to send four astronauts around the Moon and back next year as part of the agency’s first crewed Artemis mission.
The team rehearsed procedures they would use to rescue the crew during an abort of NASA’s Orion spacecraft while the SLS (Space Launch System) rocket is still on the launch pad, as well as during ascent to space. A set of test mannequins and a representative version of Orion called the Crew Module Test Article, were used during the tests.
The launch team at NASA’s Kennedy Space Center in Florida, flight controllers in mission control at the agency’s Johnson Space Center in Houston, as well as the mission management team, all worked together, exercising their integrated procedures for these emergency scenarios.
Teams with NASA and the Department of Defense (DoD) rehearse recovery procedures for a launch pad abort scenario off the coast of Florida near the agency’s Kennedy Space Center on Wednesday, June 11, 2025.
NASA/Isaac Watson
“Part of preparing to send humans to the Moon is ensuring our teams are ready for any scenario on launch day,” said Lakiesha Hawkins, NASA’s assistant deputy associate administrator for the Moon to Mars Program, and who also is chair of the mission management team for Artemis II. “We’re getting closer to our bold mission to send four astronauts around the Moon, and our integrated testing helps ensure we’re ready to bring them home in any scenario.”
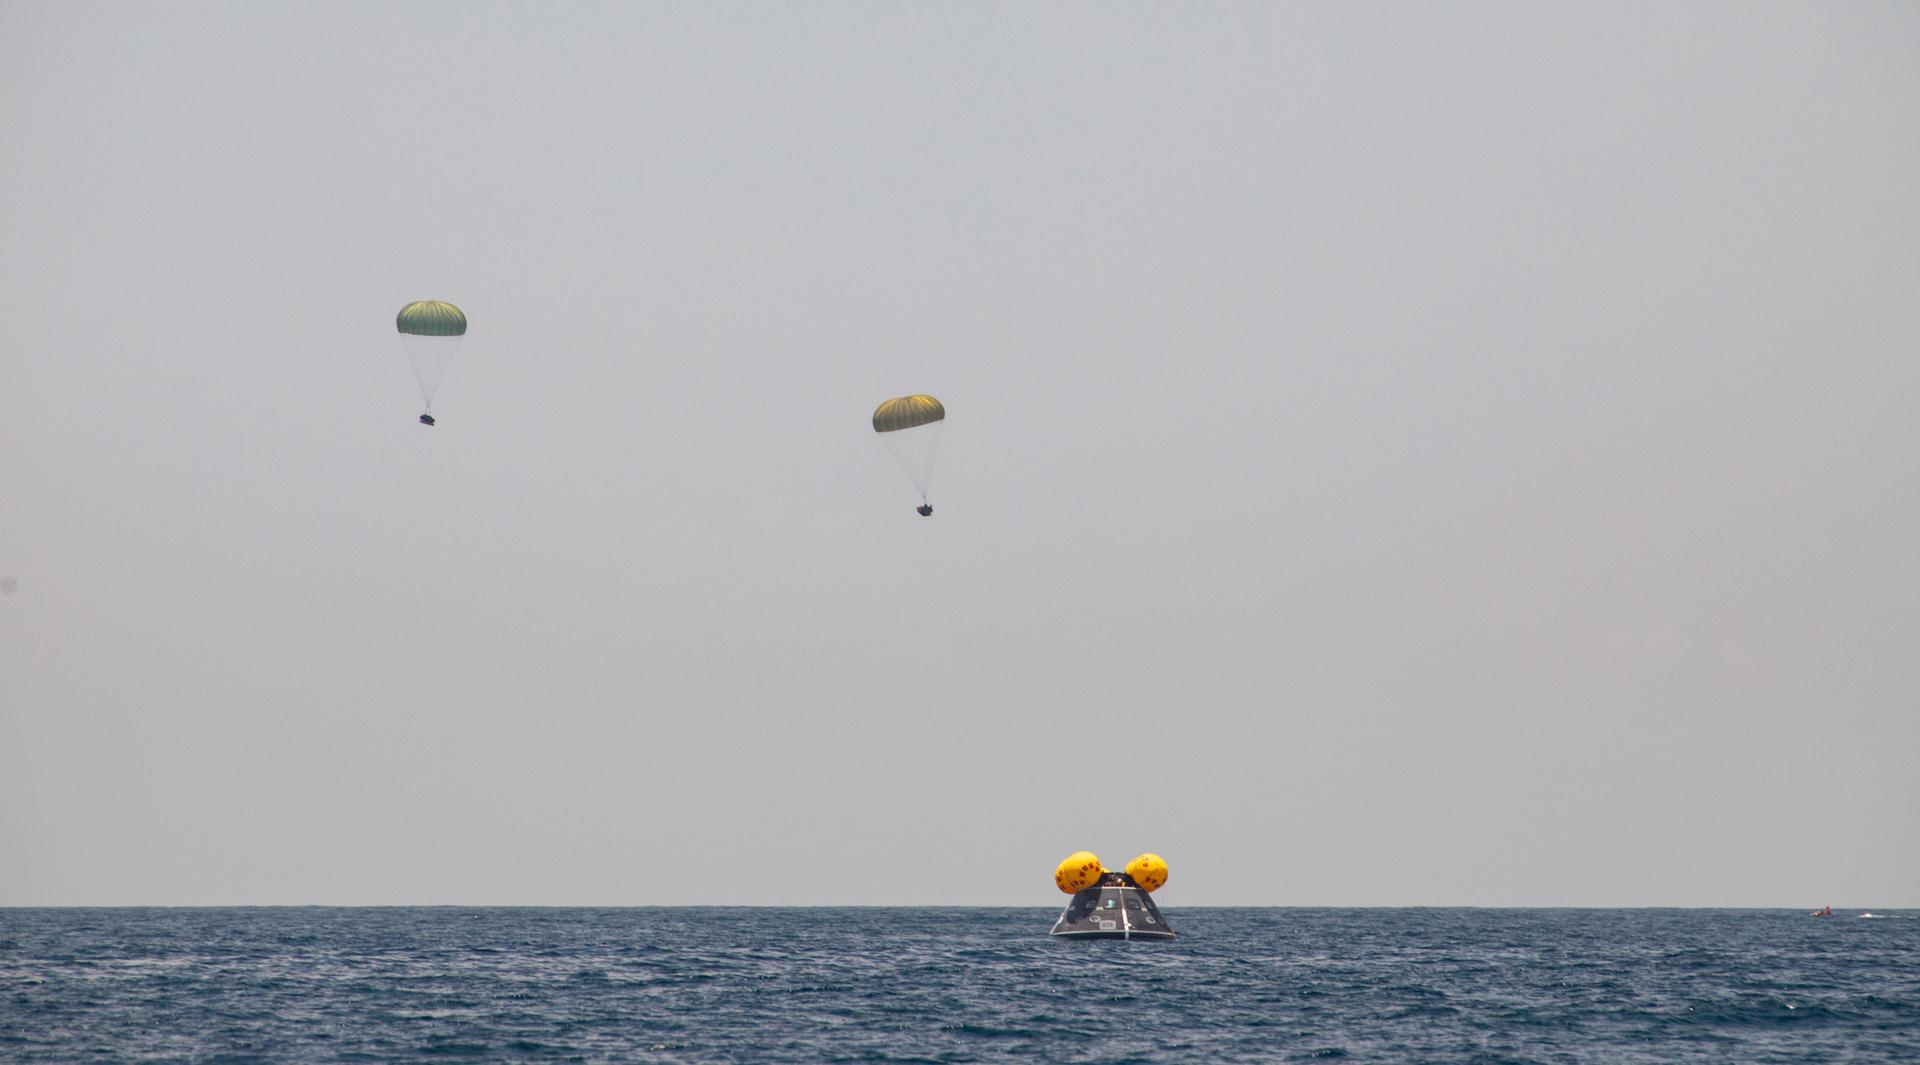
The launch pad abort scenario was up first. The teams conducted a normal launch countdown before declaring an abort before the rocket was scheduled to launch. During a real pad emergency, Orion’s launch abort system would propel Orion and its crew a safe distance away and orient it for splashdown before the capsule’s parachutes would then deploy ahead of a safe splashdown off the coast of Florida.
Teams with NASA and the Department of Defense (DoD) rehearse recovery procedures for a launch pad abort scenario off the coast of Florida near the agency’s Kennedy Space Center on Wednesday, June 11, 2025.
NASA/Isaac Watson
For the simulated splashdown, the test Orion with mannequins aboard was placed in the water five miles east of Kennedy. Once the launch team made the simulated pad abort call, two Navy helicopters carrying U.S. Air Force pararescuers departed nearby Patrick Space Force Base. The rescuers jumped into the water with unique DoD and NASA rescue equipment to safely approach the spacecraft, retrieve the mannequin crew, and transport them for medical care in the helicopters, just as they would do in the event of an actual pad abort during the Artemis II mission.
The next day focused on an abort scenario during ascent to space.
The Artemis recovery team set up another simulation at sea 12 miles east of Kennedy, using the Orion crew module test article and mannequins. With launch and flight control teams supporting, as was the Artemis II crew inside a simulator at Johnson, the rescue team sprung into action after receiving the simulated ascent abort call and began rescue procedures using a C-17 aircraft and U.S. Air Force pararescuers. Upon reaching the capsule, the rescuers jumped from the C-17 with DoD and NASA unique rescue gear. In an actual ascent abort, Orion would separate from the rocket in milliseconds to safely get away prior to deploying parachutes and splashing down.
Teams with NASA and the Department of Defense (DoD) rehearse recovery procedures for an ascent abort scenario off the coast of Florida near the agency’s Kennedy Space Center on Thursday, June 12, 2025.
NASA/Isaac Watson
Rescue procedures are similar to those used in the Underway Recovery Test conducted off the California coast in March. This demonstration ended with opening the hatch and extracting the mannequins from the capsule, so teams stopped without completing the helicopter transportation that would be used during a real rescue.
Exercising procedures for extreme scenarios is part of NASA’s work to execute its mission and keep the crew safe. Through the Artemis campaign, NASA will send astronauts to explore the Moon for scientific discovery, economic benefits, and to build the foundation for the first crewed missions to Mars – for the benefit of all.
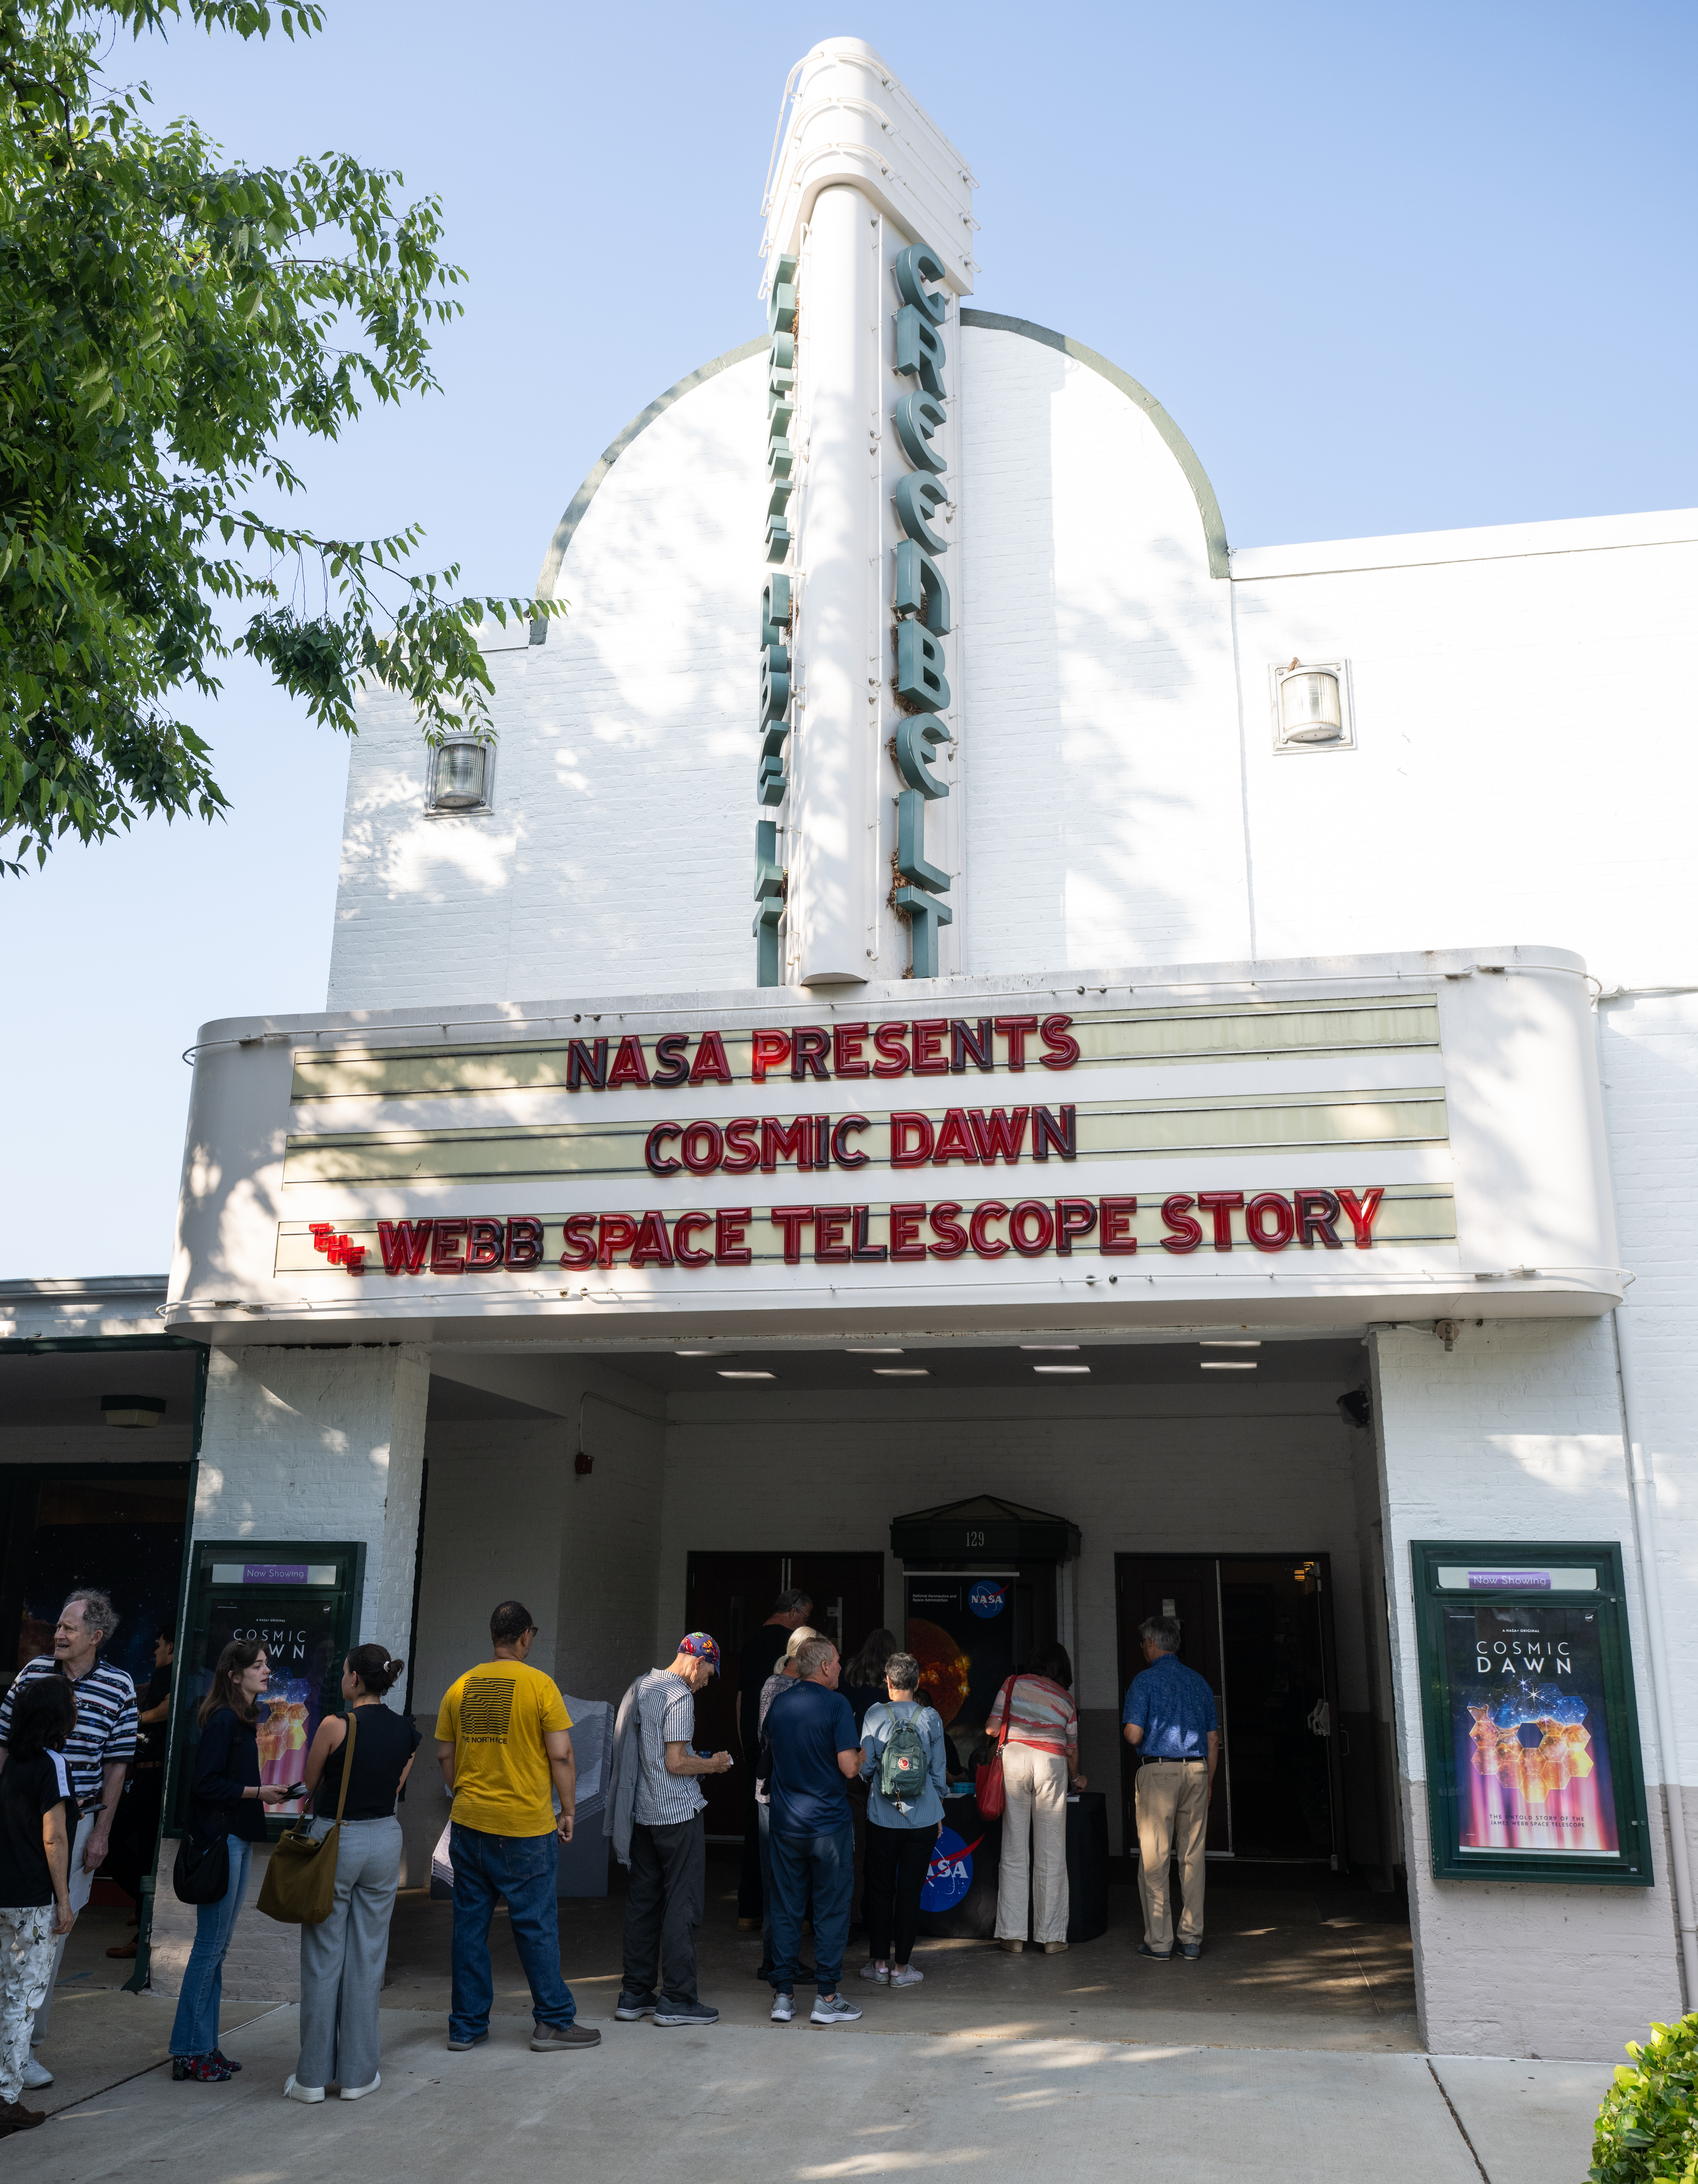
Attendees line up to enter the theater for a screening of the new NASA+ documentary “Cosmic Dawn: The Untold Story of the James Webb Space Telescope,” Wednesday, June 11, 2025, at the Greenbelt Cinema in Greenbelt, Maryland. Featuring never-before-seen footage, Cosmic Dawn offers an unprecedented glimpse into the assembly, testing, and launch of NASA’s James Webb Space Telescope.
NASA/Joel Kowsky
Attendees line up to enter the theater for a screening of the new NASA+ documentary “Cosmic Dawn: The Untold Story of the James Webb Space Telescope,” Wednesday, June 11, 2025, at the Greenbelt Cinema in Greenbelt, Maryland. Following the screening, Jacob Pinter, host of NASA’s Curious Universe podcast, led a discussion with Sophia Roberts, a NASA video producer who documented the Webb project, and Paul Geithner, former deputy project manager for Webb.
Featuring never-before-seen footage, Cosmic Dawn offers an unprecedented glimpse into the assembly, testing, and launch of NASA’s James Webb Space Telescope.
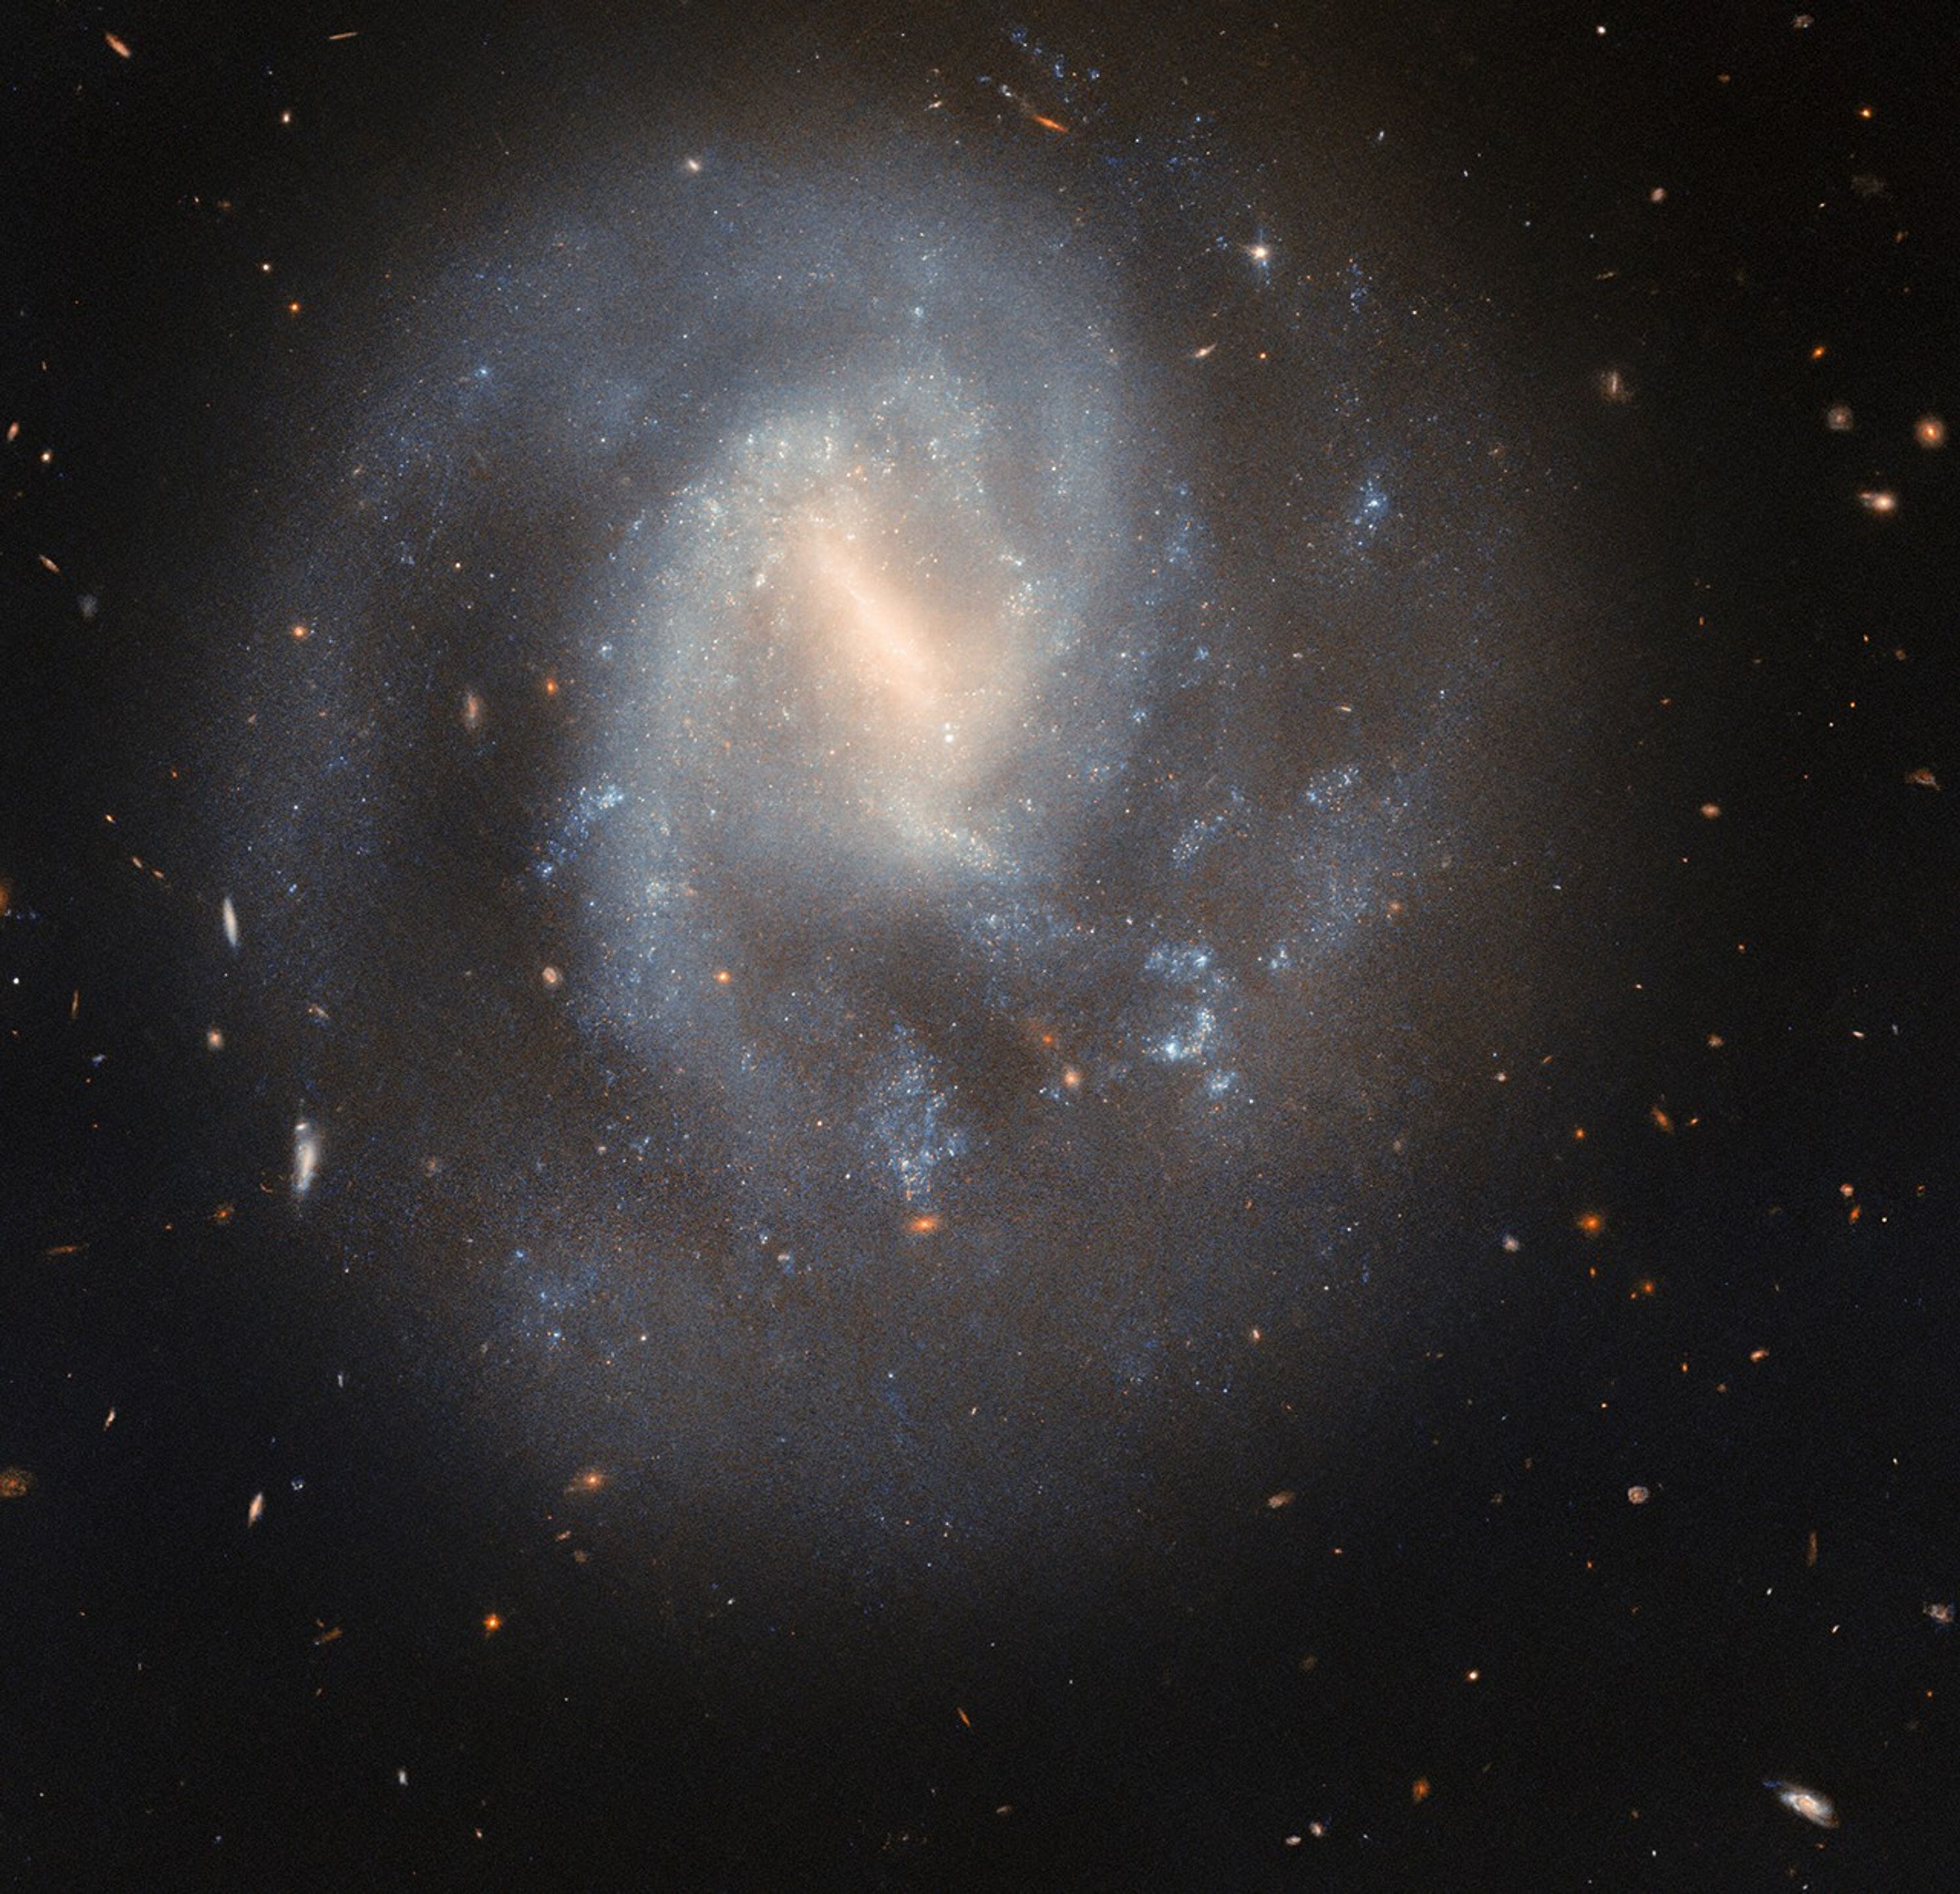
This NASA/ESA Hubble Space Telescope image features the barred spiral galaxy IC 758.
ESA/Hubble & NASA, C. Kilpatrick
This serene spiral galaxy hides a cataclysmic past. The galaxy IC 758, shown in this NASA/ESA Hubble Space Telescope image, is situated 60 million light-years away in the constellation Ursa Major.
Hubble captured this image in 2023. IC 758 appears peaceful, with its soft blue spiral arms curving gently around its hazy barred center. However, in 1999, astronomers spotted a powerful explosion in this galaxy. The supernova SN 1999bg marked the dramatic end of a star far more massive than the Sun.
Researchers do not know exactly how massive this star was before it exploded, but will use these Hubble observations to measure the masses of stars in SN 1999bg’s neighborhood. These measurements will help them estimate the mass of the star that went supernova. The Hubble data may also reveal whether SN 1999bg’s progenitor star had a companion, which would provide additional clues about the star’s life and death.
A supernova represents more than just the demise of a single star — it’s also a powerful force that can shape its neighborhood. When a massive star collapses, triggering a supernova, its outer layers rebound off its shrunken core. The explosion stirs the interstellar soup of gas and dust out of which new stars form. This interstellar shakeup can scatter and heat nearby gas clouds, preventing new stars from forming, or it can compress them, creating a burst of new star formation. The cast-off layers enrich the interstellar medium, from which new stars form, with heavy elements manufactured in the core of the supernova.
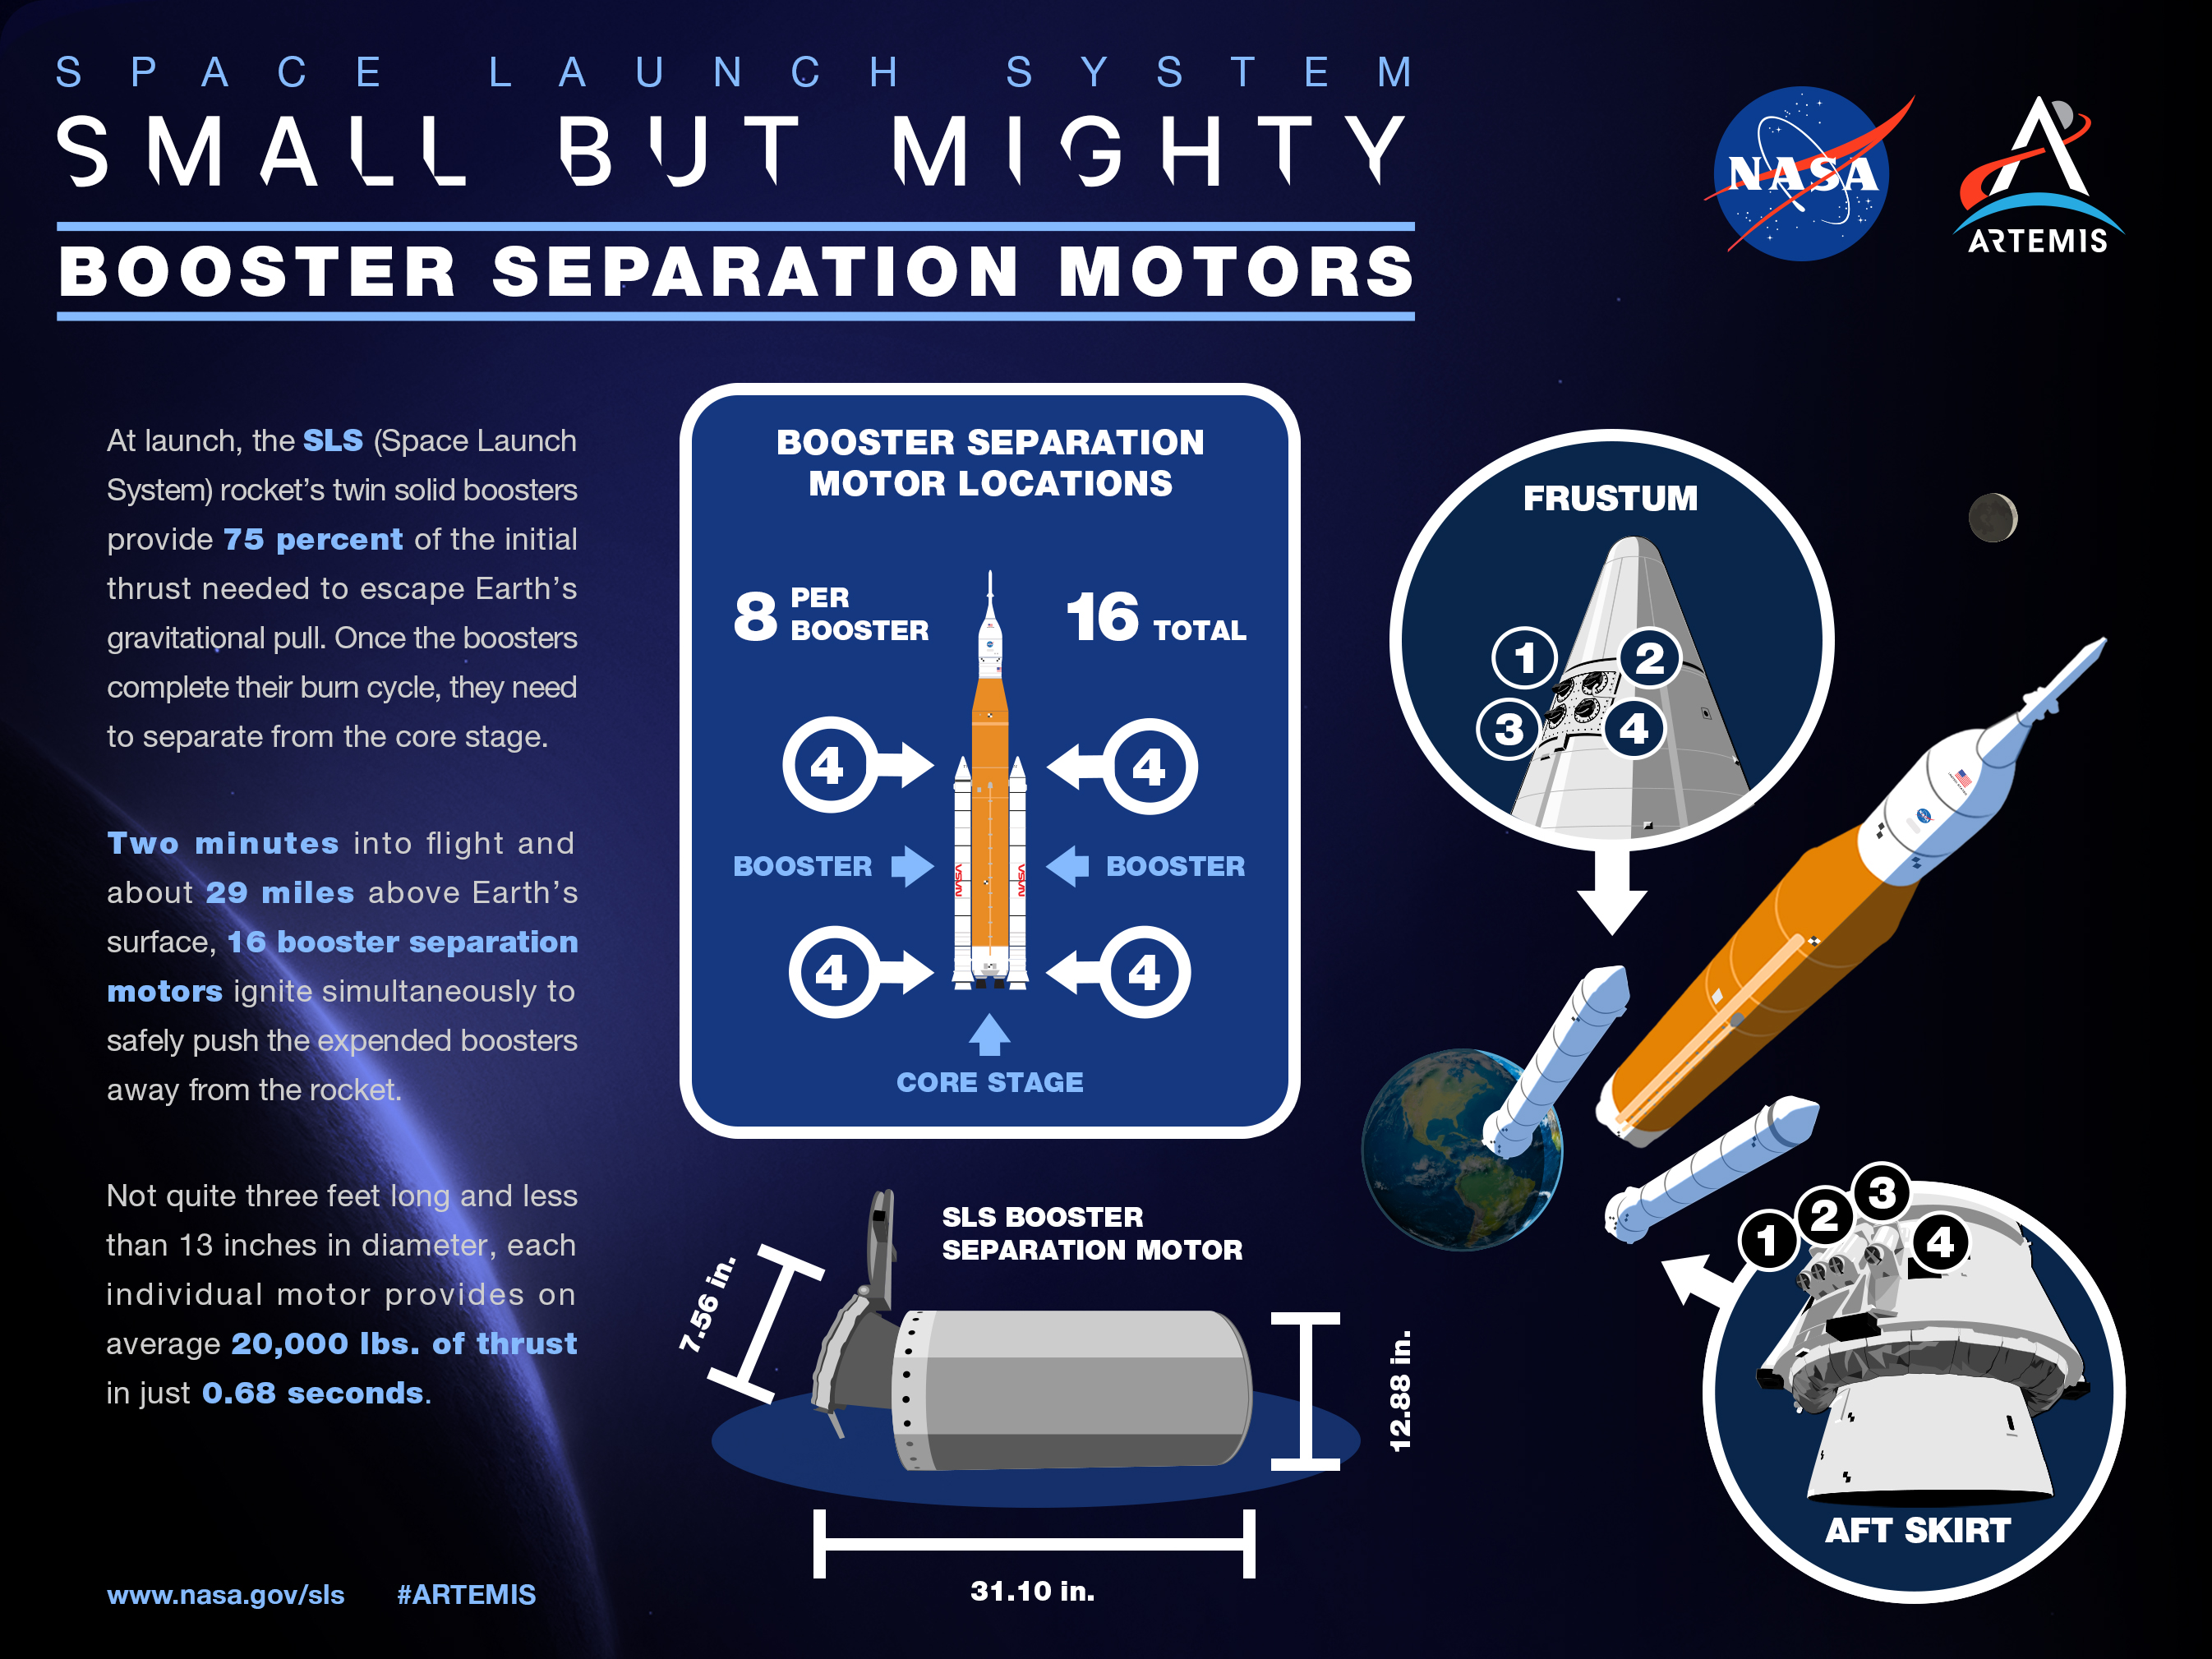
NASA’s SLS (Space Launch System) solid rocket boosters are the largest, most powerful solid propellant boosters to ever fly. Standing 17 stories tall and burning approximately six tons of propellant every second, each booster generates 3.6 million pounds of a thrust for a total of 7.2 million pounds: more thrust than 14 four-engine jumbo commercial airliners. Together, the SLS twin boosters provide more than 75 percent of the total thrust at launch. Each booster houses eight booster separation motors which are responsible for separating the boosters from the core stage during flight.
At the top of each booster is the frustum—a truncated cone-shaped structure that, along with the nose cone, forms the aerodynamic fairing. This frustum houses four of the separation motors, while the remaining four are located at the bottom within the aft skirt.
Image Credit: NASA/Kevin O’Brien
For more information on the Artemis Campaign, visit:
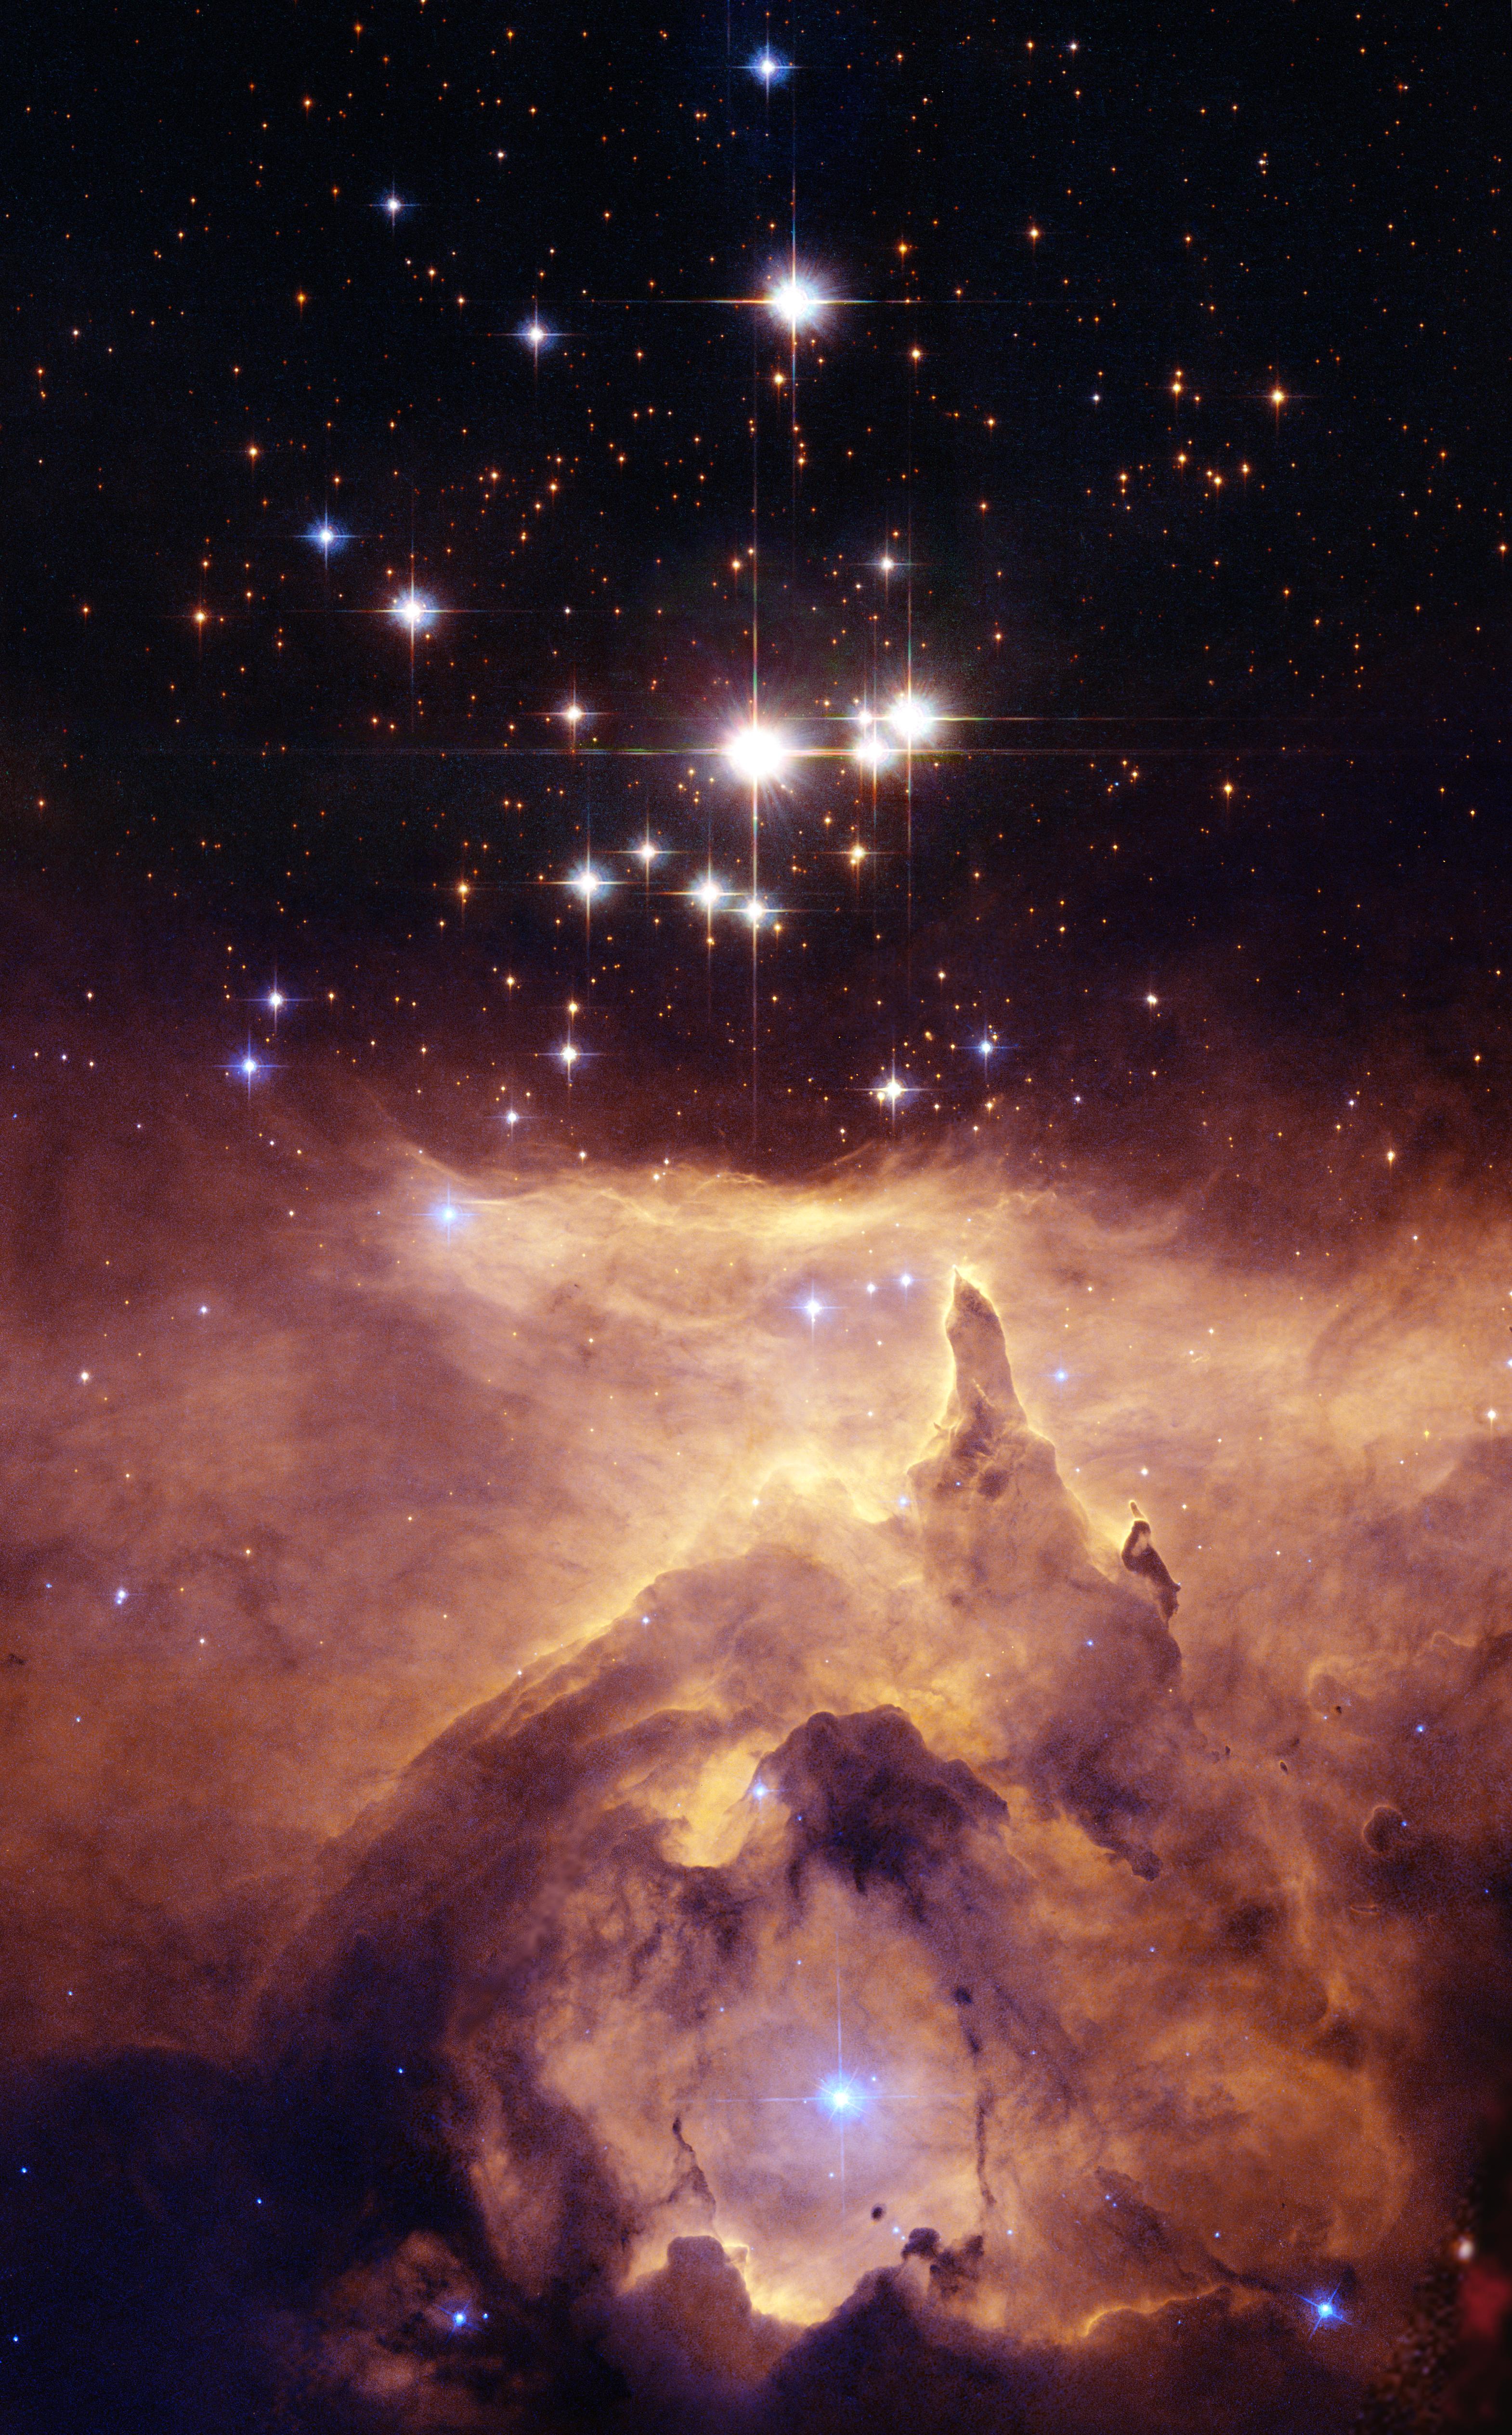
NASA, ESA and Jesús Maíz Apellániz (Instituto de Astrofísica de Andalucía, Spain); Acknowledgment: Davide De Martin (ESA/Hubble)
Pismis 24, the star cluster seen here in an image released on Dec. 11, 2006, lies within the much larger emission nebula called NGC 6357, located about 8,000 light-years from Earth. The brightest object in the picture was once thought to be a single star with an incredibly large mass of 200 to 300 solar masses. That would have made it by far the most massive known star in the galaxy and would have put it considerably above the currently believed upper mass limit of about 150 solar masses for individual stars. Measurements from NASA’s Hubble Space Telescope, however, discovered that Pismis 24-1 is actually two separate stars, and, in doing so, “halved” their mass to around 100-150 solar masses each.
Image credit: NASA, ESA and Jesús Maíz Apellániz (Instituto de Astrofísica de Andalucía, Spain); Acknowledgment: Davide De Martin (ESA/Hubble)
NASA’s Hurricane Science, Tech, Data Help American Communities
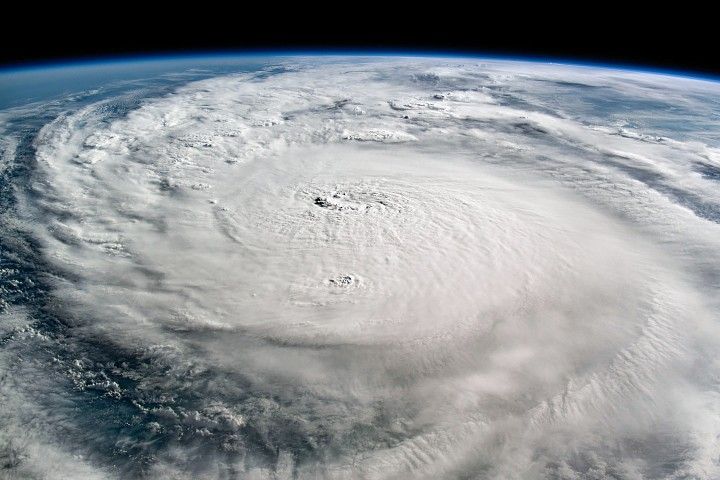
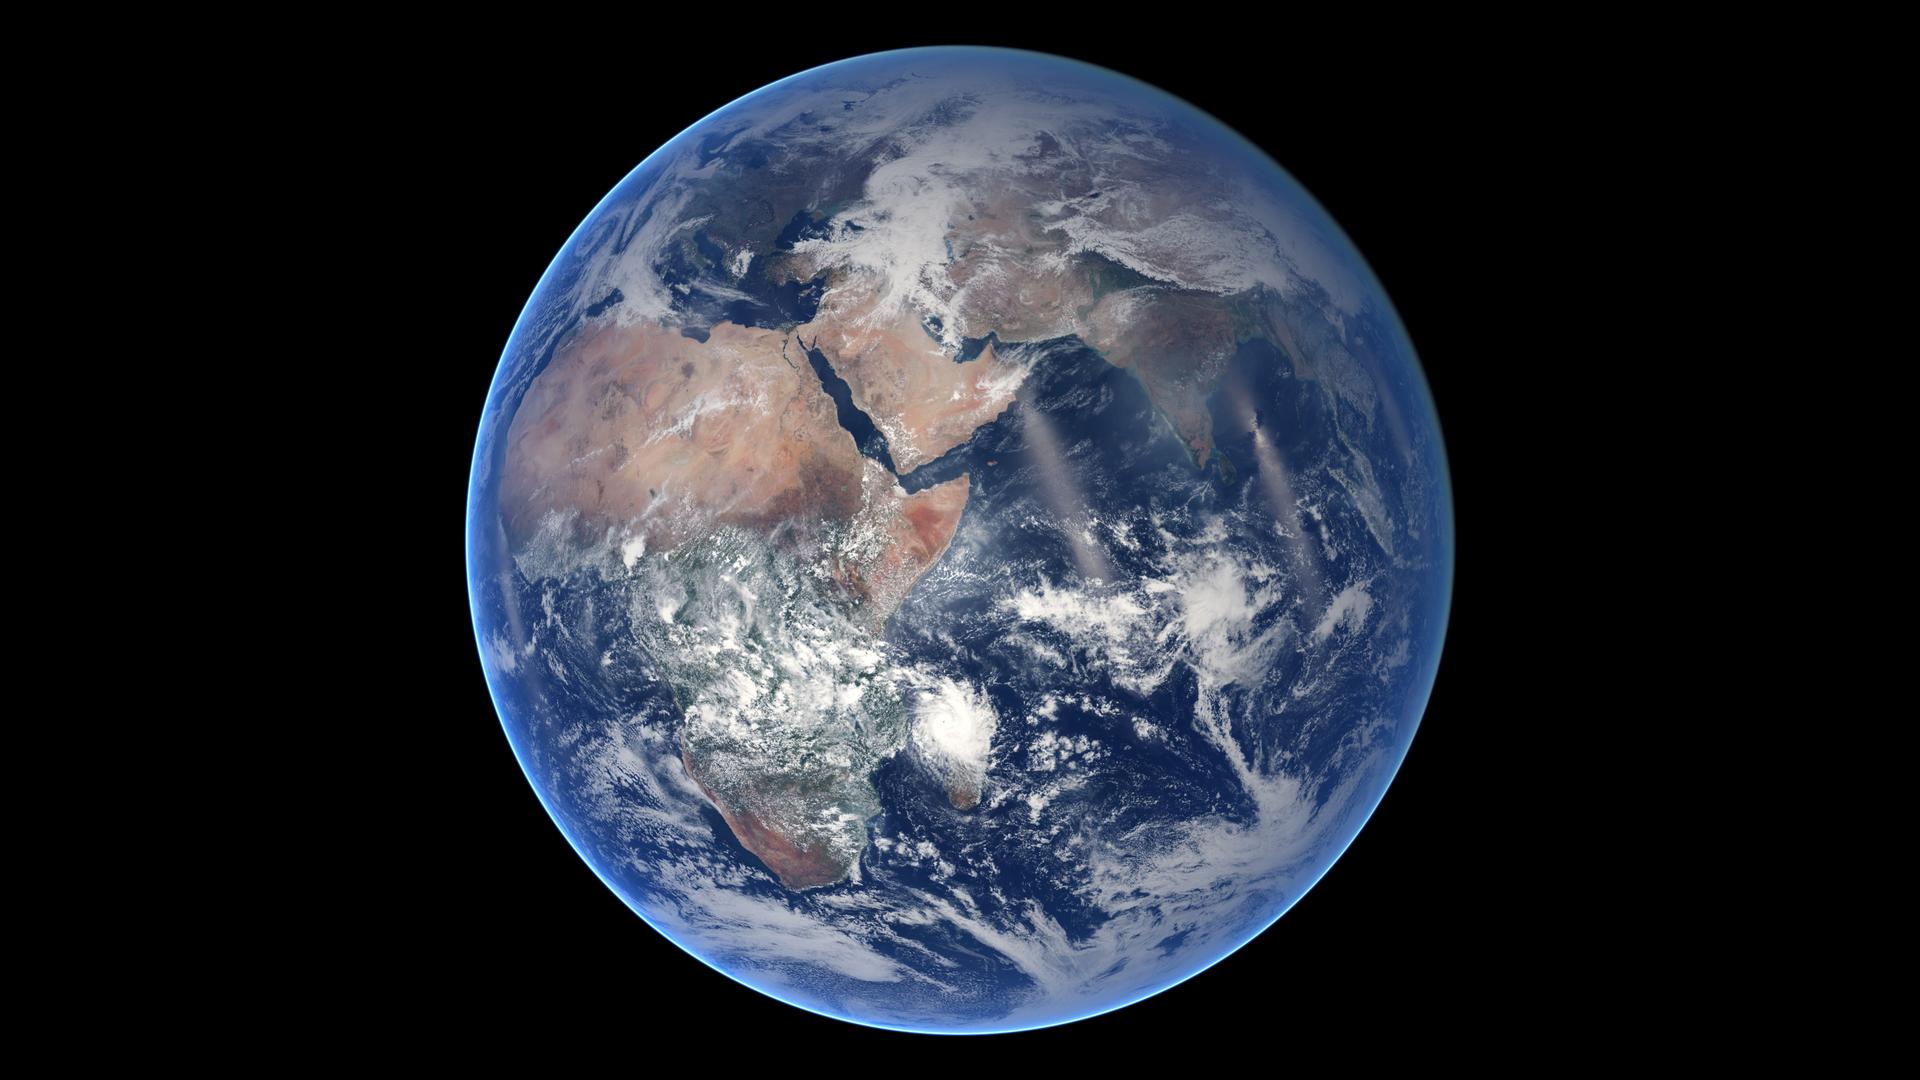
Hurricane Milton swirls over the ocean in this view from the International Space Station.
Credits: ISS Astronaut/Earth Observatory
NASA supports hurricane preparedness and response by providing satellite data and science before, during, and after storms.
During hurricane season, NASA delivers timely flood maps, power outage insights, landslide risk assessments, and more to state and federal partners.
NASA tests innovative technologies, from AI models to mini satellites, to enhance how we monitor hurricanes and their impacts.
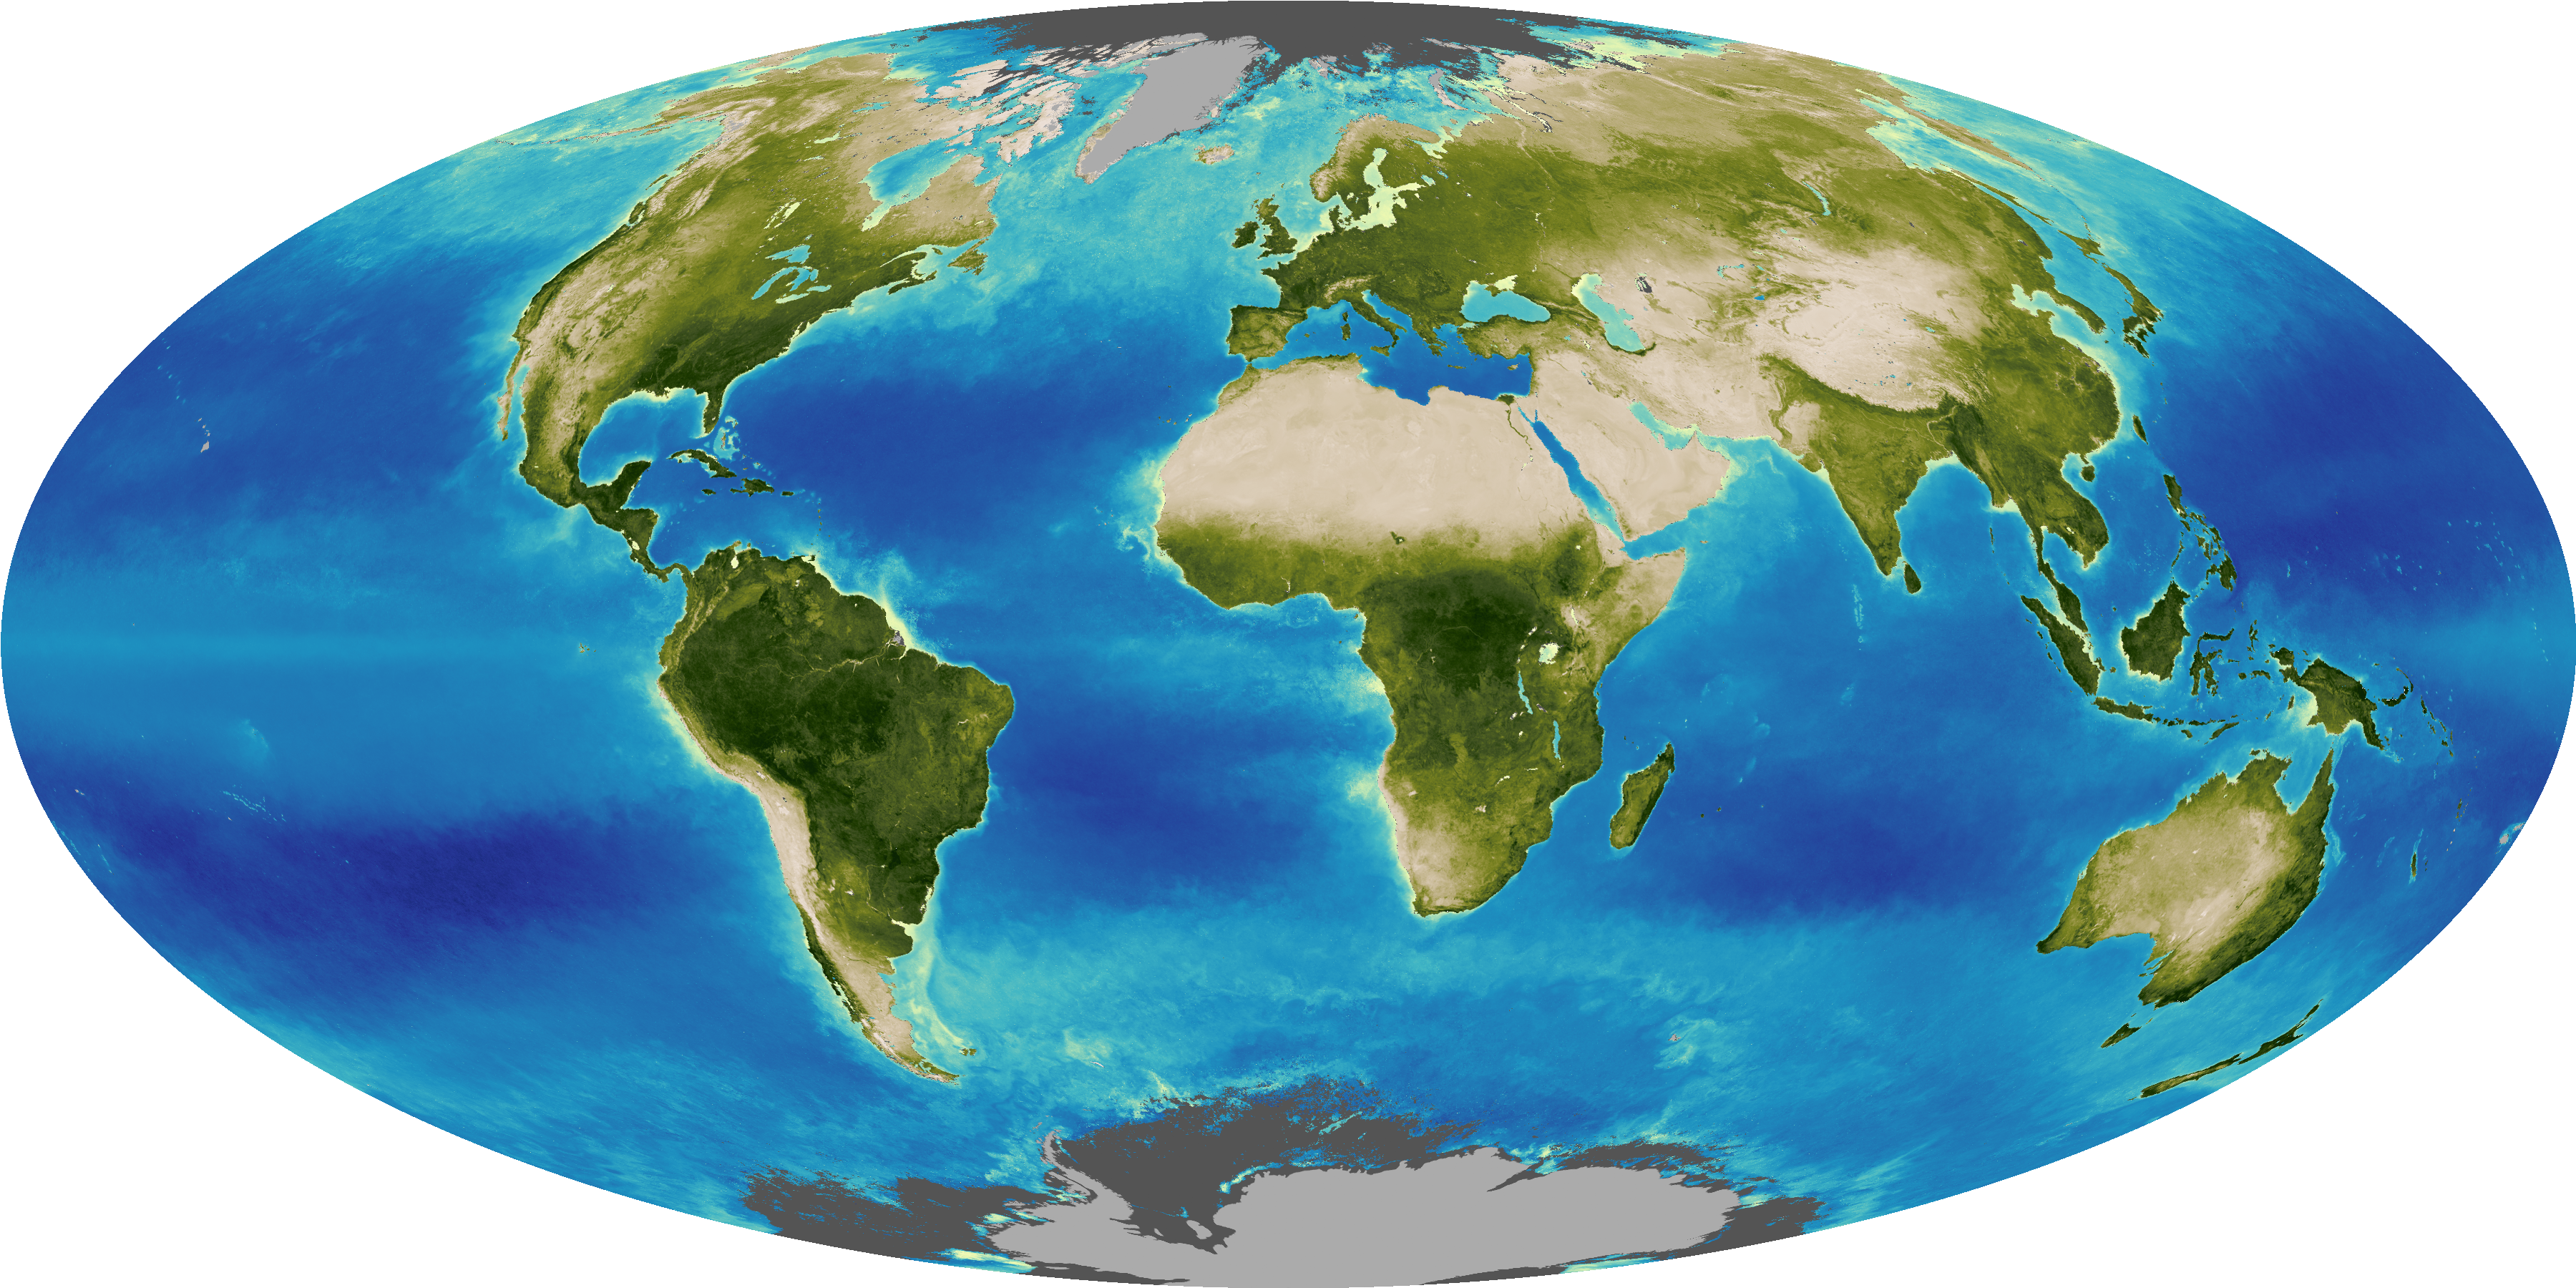
NASA’s long-term tracking of wind, ocean heat, and atmospheric moisture improves understanding of where hurricanes might form and intensify.
With the Atlantic hurricane season underway, NASA is again gearing up to produce cutting-edge research that strengthens the nation’s ability to prepare for and respond to severe weather. From satellite imagery of our planet to improved storm modeling, the agency’s work supports communities in anticipating and reducing the impacts of hurricanes.
In 2024, hurricanes including Helene and Milton showed NASA’s wide-ranging capabilities. As the storms approached the United States, the agency’s network of satellites and scientists swung into action. Within hours of landfall, NASA’s Disasters Response Coordination System was supplying emergency managers and others with flood maps, power outage assessments, and other crucial data.
“People might be surprised how deeply NASA is involved in hurricane science,” said Scott Braun, a research meteorologist at NASA’s Goddard Space Flight Center in Greenbelt, Maryland. “We are not the agencies issuing forecasts or warnings, but our technologies and science are making fundamental contributions to how we understand, predict, and respond to these storms.”
Disaster Response Powered by NASA
When hurricanes strike, NASA’s Disasters Response Coordination System aids state and federal agencies, producing and sharing imagery and data, including the NASA Disasters Mapping Portal, which offers tools to assess storm damage.
One crucial tool is NASA’s Black Marble product suite, produced and maintained by NASA Goddard. Using data from the Visible Infrared Imaging Radiometer Suite (VIIRS), researchers and others can map nighttime lights and detect power outages.
Unlike traditional outage maps, which often show only county-level data, NASA’s Black Marble can provide a more detailed view. It offers calibrated, daily observations, enabling high-confidence tracking of neighborhood-level impacts. Emergency response teams in Florida, for instance, have used this imagery to assess conditions near hazardous waste sites before heading into the field after a hurricane.
before
after
The state faced widespread power outages after winds from Hurricane Helene snapped trees, tore off roofs, and toppled power lines. View the full story
NASA Earth Observatory/Lauren Dauphin
The state faced widespread power outages after winds from Hurricane Helene snapped trees, tore off roofs, and toppled power lines. View the full story
NASA Earth Observatory/Lauren Dauphin
before
after
Scientists with NASA’s Black Marble processed data from VIIRS on the NOAA-NASA Suomi NPP satellite to show how power outages darkened Augusta, Georgia, before and after Hurricane Helene. View the full story
Other NASA technologies map flooding. Scientists at NASA’s Marshall Space Flight Center in Huntsville, Alabama used the European Space Agency’s Sentinel-1 synthetic aperture radar data and other data from the NASA/U.S. Geological Survey Landsat satellites and ESA’s Sentinel-2 to track flooding after multiple hurricanes in 2024, including Helene and Milton.
These maps were shared through the NASA Disasters Mapping Portal with state and federal emergency managers responding to storms’ impacts in Florida, North Carolina, South Carolina, and elsewhere.
“The ability to see floodwaters and landscape changes gives communities a critical edge during response and recovery,” said Shanna McClain, disasters program manager for NASA’s Earth Science Division at NASA headquarters in Washington. “It helps decision-makers act faster when every minute counts.”
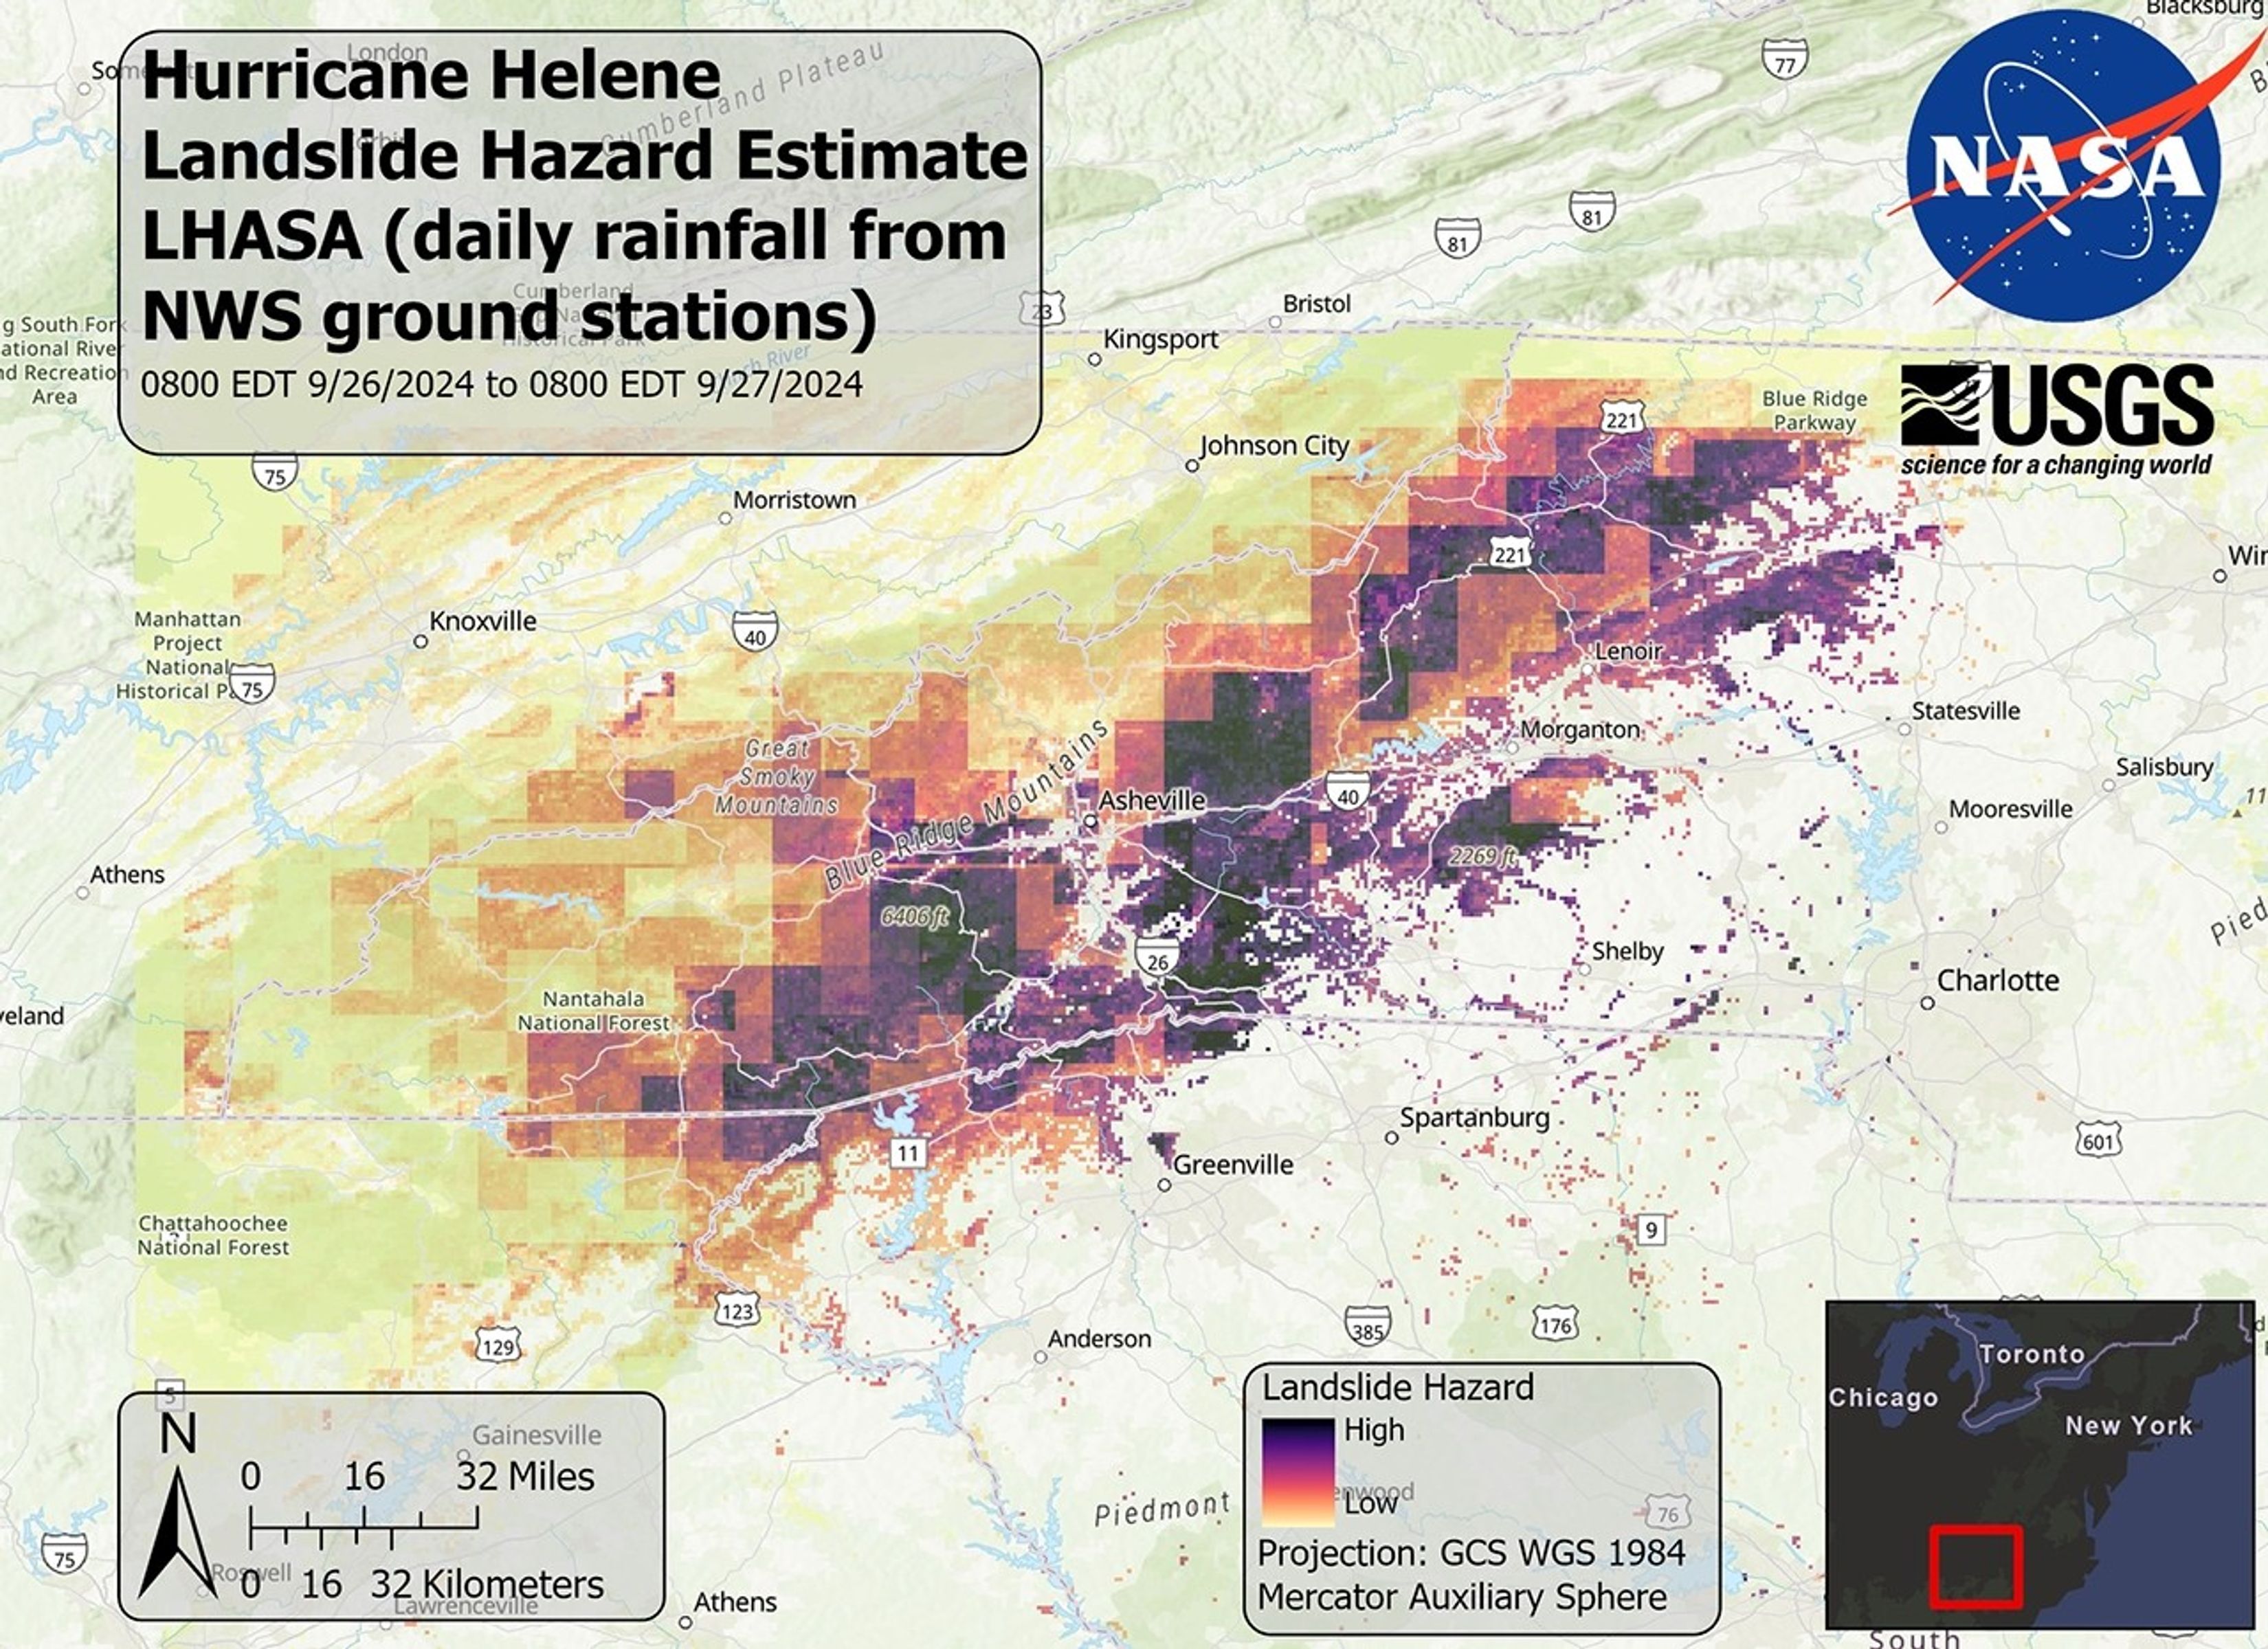
Hurricanes don’t just knock out power or trigger flooding — they can also loosen mountains. After Hurricane Helene, NASA scientists partnered with USGS to tackle a different threat: landslides throughout the southern Appalachian Mountains. NASA’s Landslide Hazard Assessment for Situational Awareness tool, developed at NASA Goddard, can help spot landslide-prone areas by combining different troves of satellite data.
“The landslide model brings together a wide range of Earth science,” said Thomas Stanley, a research scientist at NASA Goddard. “It’s a real convergence of satellite observations — soil moisture, precipitation, elevation — each one adding a key piece to the puzzle.”
NASA and USGS used rainfall data and modeling to estimate landslide hazards in the Appalachians following Hurricane Helene, highlighting high-risk zones across western North Carolina.
NASA/USGS
In the days during and after Helene, a NASA-USGS team adapted this model to incorporate ground-based rainfall measurements. “This collaboration proved crucial during the critical first days when lingering clouds prevented direct satellite imaging of landslides,” said Kate Allstadt, a research geophysicist at USGS. “Combining NASA and USGS landslide models guided aerial reconnaissance over four states and helped prioritize areas for detailed mapping.”
NASA Disasters Response coordinators also partnered with USGS to manually map likely landslide areas in North Carolina, South Carolina, and Virginia, using high-resolution satellite imagery. This partnership enabled early warnings to agencies such as the North Carolina Geological Survey about potential landslide zones before visual confirmation was possible.
Tracking Hurricanes in Near Real Time
As hurricanes gather strength over warm ocean waters, NASA’s satellites begin tracking them. One effort providing essential data on hurricanes is the Global Precipitation Measurement (GPM) mission, a collaboration between NASA and the Japan Aerospace Exploration Agency. Passing over storms once or twice per day, the GPM core satellite captures high-resolution data on rainfall intensity and distribution.
“The GPM mission gives us an inside look at where a storm is dropping the most rain and how intense it is,” said George Huffman, GPM project scientist at NASA Goddard. “That kind of information helps forecasters make better predictions and gives communities more time to prepare for flooding and dangerous conditions.”
Huffman’s team leads NASA’s IMERG (Integrated Multi-satellitE Retrievals for GPM) product, which combines GPM Core Observatory data with observations from other satellites to generate near real-time, global rainfall estimates every 30 minutes. For example, IMERG tracked the record-breaking rainfall that fell during Hurricane Harvey in 2017, when parts of Texas saw more than 50 inches of rain.
Satellite-based rainfall data can be especially vital when a big storm like Harvey or Helene knocks out ground-based rain measurements, Huffman said.
Watch Hurricane Harvey as it makes landfall in Texas and Louisiana in 2017. The visualization depicts precipitation measured by the GPM mission, highlighting record-shattering rainfall over Texas and Louisiana. Blue is frozen precipitation, while green to red is rainfall.
NASA’s Scientific Visualization Studio
NASA also is working to turn precipitation data into practical flood predictions. One such effort, led by NASA-funded hydrologist Ed Beighley at Northeastern University in Boston, merges rainfall estimates from the GPM mission with National Weather Service river discharge models and surface water mapping methods to identify areas likely to experience flooding.
During Hurricane Helene, his team provided early versions of these flood maps to the North Carolina Department of Health and Human Services.
“In some cases, like with Helene, we could see where disasters were likely to be declared just from the rainfall data — days before the disaster declarations were made official,” Beighley said. “That kind of near real-time information could really help counties and health departments prepare and coordinate response efforts.”
That same focus on improving early flood prediction was at the heart of NASA’s response to Hurricane Debby when it made landfall in Florida in August 2024. At NASA Marshall, the Short-term Prediction Research and Transition (SPoRT) team used its Land Information System to track soil moisture levels, crucial for understanding the potential for flooding.
The team’s Streamflow-AI model — a machine learning tool trained to predict how rivers respond to rainfall — also forecasted rising waters in small streams and creeks in Florida and the Carolinas.
“The streamflow tool is used pretty heavily by the National Weather Service now to help inform flood forecasts, which then filters down to evacuation orders,” said Patrick Duran, a NASA Marshall research scientist with SPoRT.
NASA SPoRT’s Streamflow-AI model shows the flooding potential for the Swannanoa River in Asheville, North Carolina, during and after Hurricane Helene.
NASA SPoRT
Reinventing the Tech That Sees Into Storms
NASA doesn’t just collect data on hurricanes or aid in their aftermath — it is redefining the technology we use to observe and understand them. This work is not only improving forecasts and warnings but also helping to fuel the growth of America’s commercial satellite industry.
Take NASA’s TROPICS mission. Short for Time-Resolved Observations of Precipitation structure and storm Intensity with a Constellation of Smallsats, TROPICS represents a fundamental shift in how we might monitor hurricanes from space. Rather than relying solely on intermittent passes by larger satellites, TROPICS uses a group of small, lower-cost satellites working in concert to provide more frequent observations of tropical storm systems — offering a complementary approach to storm monitoring.
During Hurricane Helene, the TROPICS satellites tracked the storm through nearly its entire life cycle, capturing data on its rapid intensification from a tropical depression to a powerful category 4 hurricane before landfall in Florida’s Big Bend region.
Each TROPICS satellite carries a microwave radiometer. Unlike optical sensors, this instrument can see through clouds, making it ideal for tracking storms. The TROPICS’ radiometers are tuned to detect temperature, moisture, and precipitation patterns inside hurricanes.
“The TROPICS mission is really good at providing images of the structure of a storm, showing how well defined the eye is, which is key for improving forecasting,” said William Blackwell, TROPICS principal investigator at MIT Lincoln Laboratory in Massachusetts.
NASA’s TROPICS mission monitored Hurricane Helene throughout its life cycle. This visualization shows how the tropical depression rapidly intensified into a category 4 hurricane before hitting Florida and then moving inland.
NASA’s Scientific Visualization Studio
Tomorrow.io, an American weather company, is using radiometer technology derived from TROPICS as it develops tools for commercial weather forecasting. The company also is working to adapt radar technology first tested on NASA’s RainCube mission.
RainCube, a small satellite about the size of a shoebox developed by NASA’s Jet Propulsion Laboratory in Southern California, operated from 2018 to 2020. It used radar to study precipitation, sending signals toward Earth and analyzing how long they took to bounce back, and how strong they were after reflecting off raindrops, snowflakes, and cloud ice.
Full-scale satellites have been using radar technology to make that kind of measurement for years. “The key thing with RainCube wasn’t bringing in new science,” said Simone Tanelli, RainCube principal scientist at JPL. “Instead, it was showing that we could give you similar data with a box that’s roughly 100 times smaller in volume than a full-size satellite.”
NASA also tests how other small, lower-cost instruments could transform how we monitor tropical storms. Two such tools — COWVR, short for Compact Ocean Wind Vector Radiometer measures ocean surface winds, and TEMPEST, short for Temporal Experiment for Storms and Tropical Systems tracks atmospheric water vapor — were launched to the International Space Station in 2021.
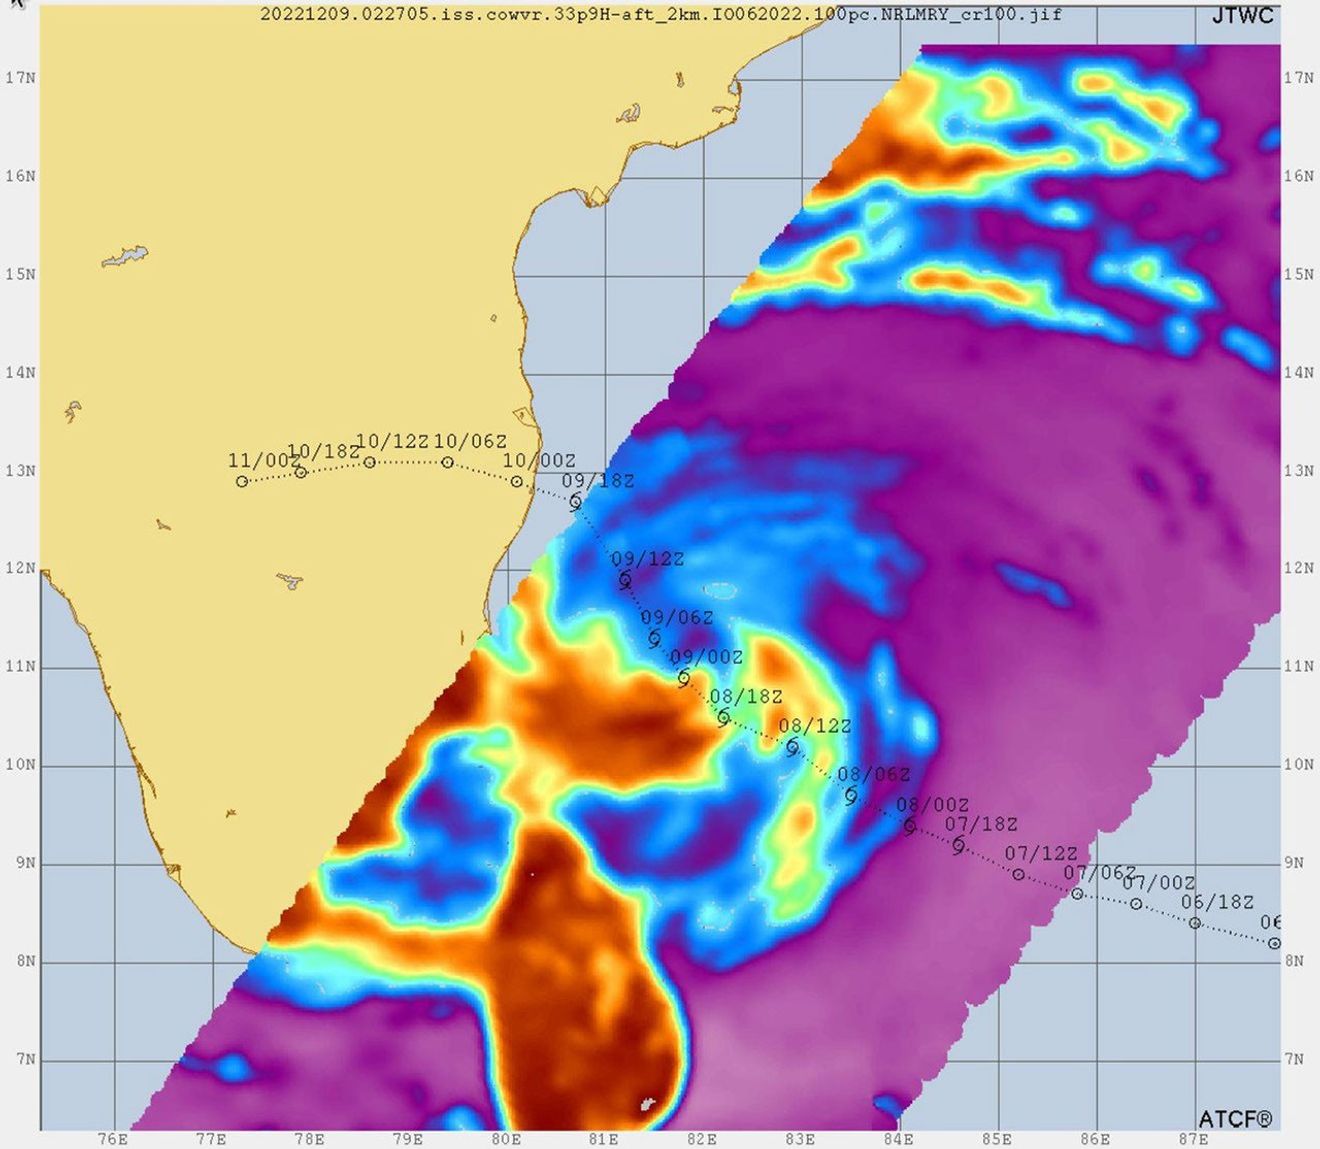
Using technology and designs from JPL and other NASA teams, TEMPEST and COWVR already are proving their value. Their data has been used by the U.S. Joint Typhoon Warning Center to help track and forecast powerful storms, such as Tropical Cyclone Mandous in December 2022.
Data from the COWVR and TEMPEST instruments aboard the ISS was used to create this image of Tropical Cyclone Mandous, which forecasters used to understand the December 2022 storm’s intensity and predict its path toward southern India.
U.S. Joint Typhoon Warning Center/U.S. Naval Research Laboratory
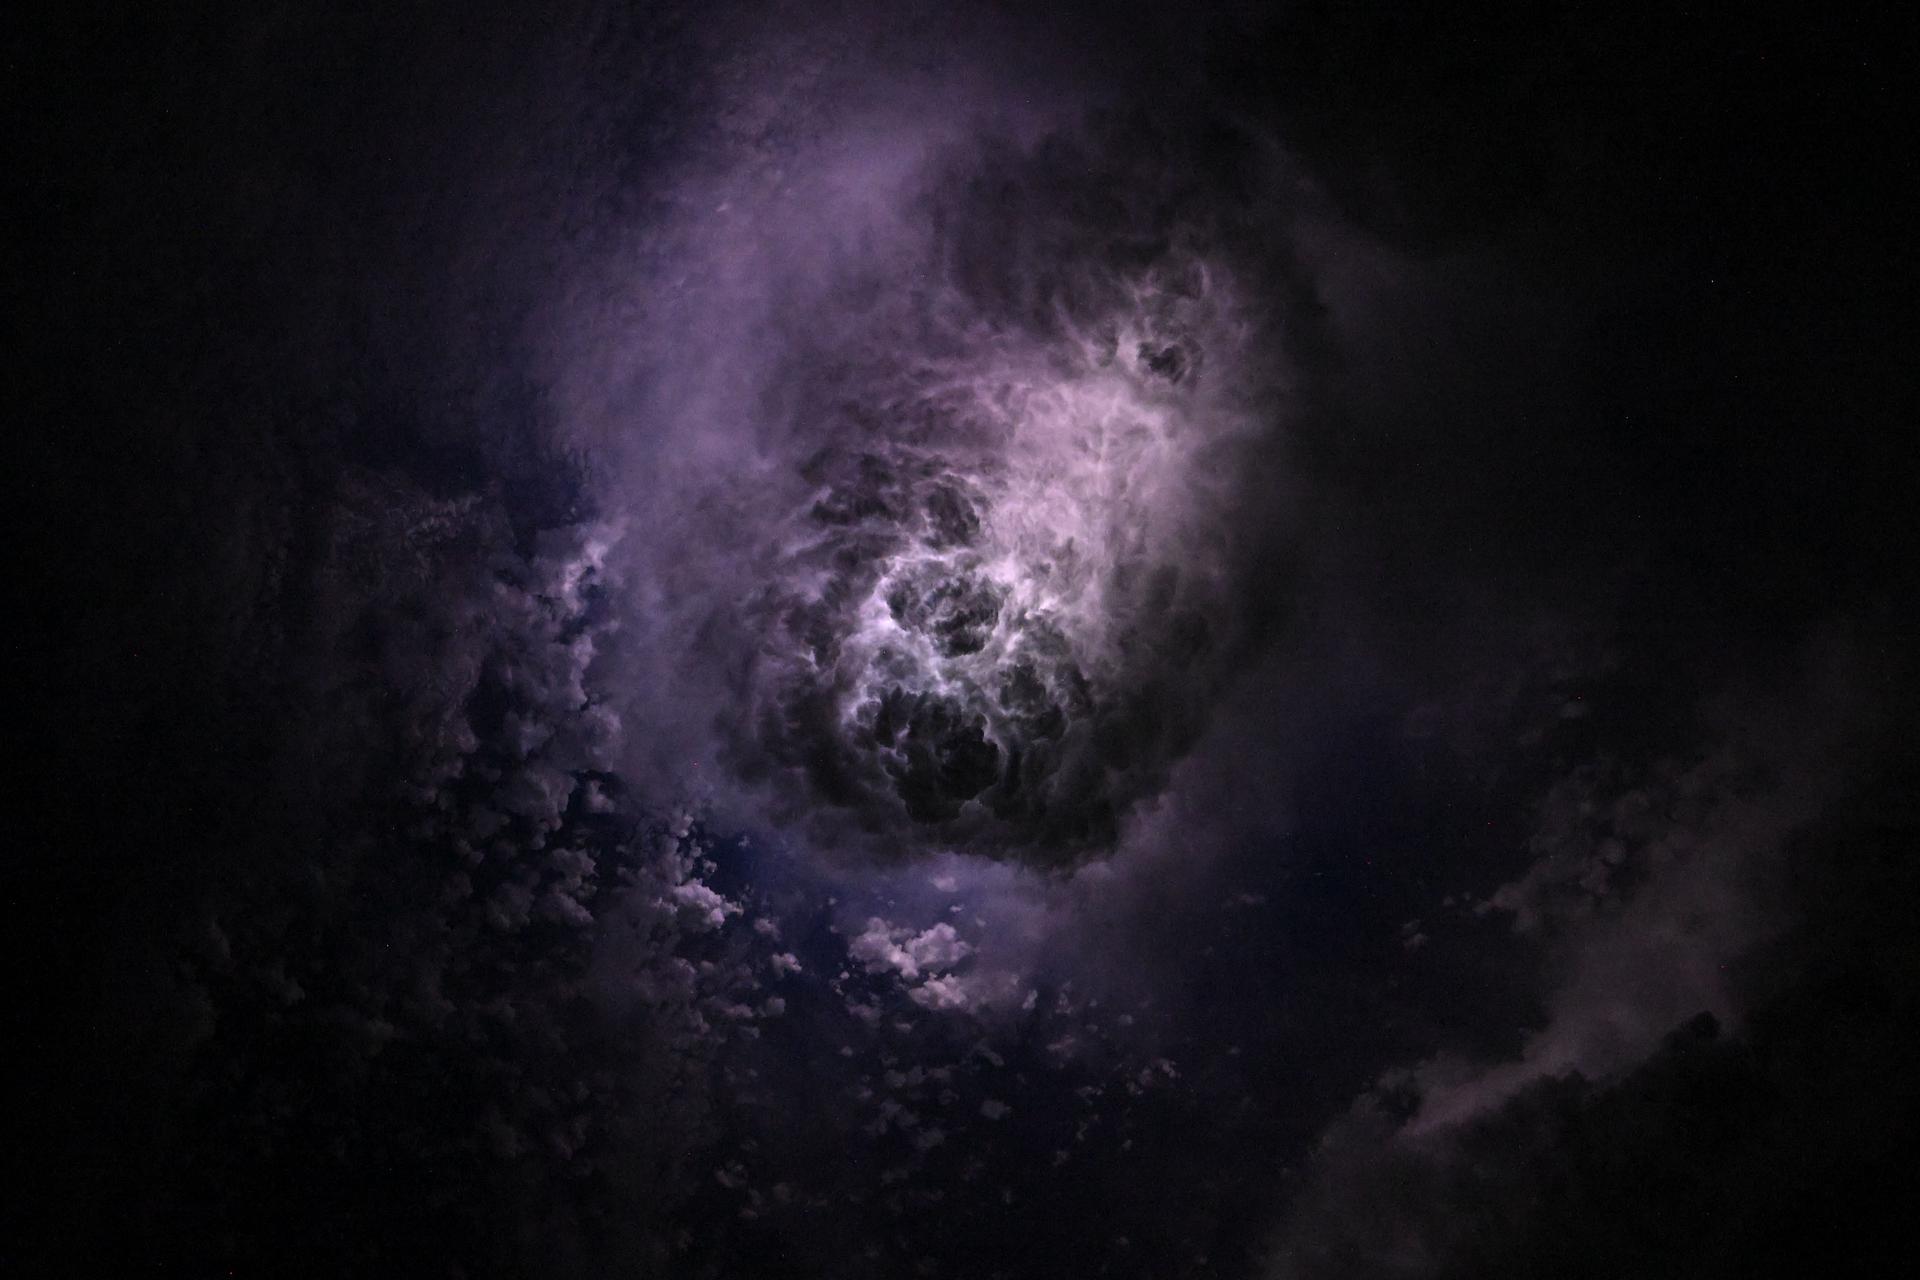
NASA researchers also are investigating lightning, which has emerged as a key clue in predicting rapid storm intensification, a dangerous phase of the hurricane life cycle that is one of the most difficult aspects of hurricane forecasting. Spikes in lightning activity, especially in the eyewall, can be an early sign that a storm is about to strengthen quickly.
The agency’s SPoRT project is researching how lightning data from the Geostationary Lightning Mapper can improve hurricane forecasting. This sensor provides a nearly continuous view of lightning activity over oceans and in remote land regions that have fewer weather observations. The instrument rides aboard NOAA’s (National Oceanic and Atmospheric Administration) GOES weather satellites.
“By studying the size and energy of lightning flashes inside hurricanes, we’re learning how they might signal whether a storm is about to intensify or weaken,” said Duran. “It’s an evolving area of research with a lot of potential.”
During Hurricane Helene, SPoRT’s lightning analyses revealed a burst of strong, frequent flashes in the eyewall just before the storm surged from category 2 to category 4 intensity. That’s exactly the kind of signal researchers hope to detect more reliably in the future.
Bright, large lightning flashes seen in Hurricane Helene’s eyewall, captured by NASA SPoRT’s Geostationary Lightning Mapper viewer, indicate the storm’s rapid intensification from category 2 to 4 just hours before landfall.
NASA SPoRT
NASA frequently uses its airplanes to test new hurricane tech, too. In one recent example, scientists from NASA’s Langley Research Center in Hampton, Virginia, flew a cutting-edge 3-D Doppler wind lidar system across the United States, including making passes through the edges of Hurricane Helene. The instrument is designed to capture high-resolution wind data that can improve predictions of rapidly evolving storms, such as hurricanes and severe thunderstorms, where accurate wind observations are essential, but often lacking.
Braun compared these multiple data streams — from TROPICS, GPM, and other instruments — to medical imaging. “Think about how doctors use different types of scans like X-rays, MRIs, and ultrasound to understand what’s happening inside a patient’s body,” he said. “We’re doing something similar with hurricanes. Each system gives us a different view of the storm’s internal structure and environment, with the goal of improving forecasts.”
Watching For Hurricane Warning Signs
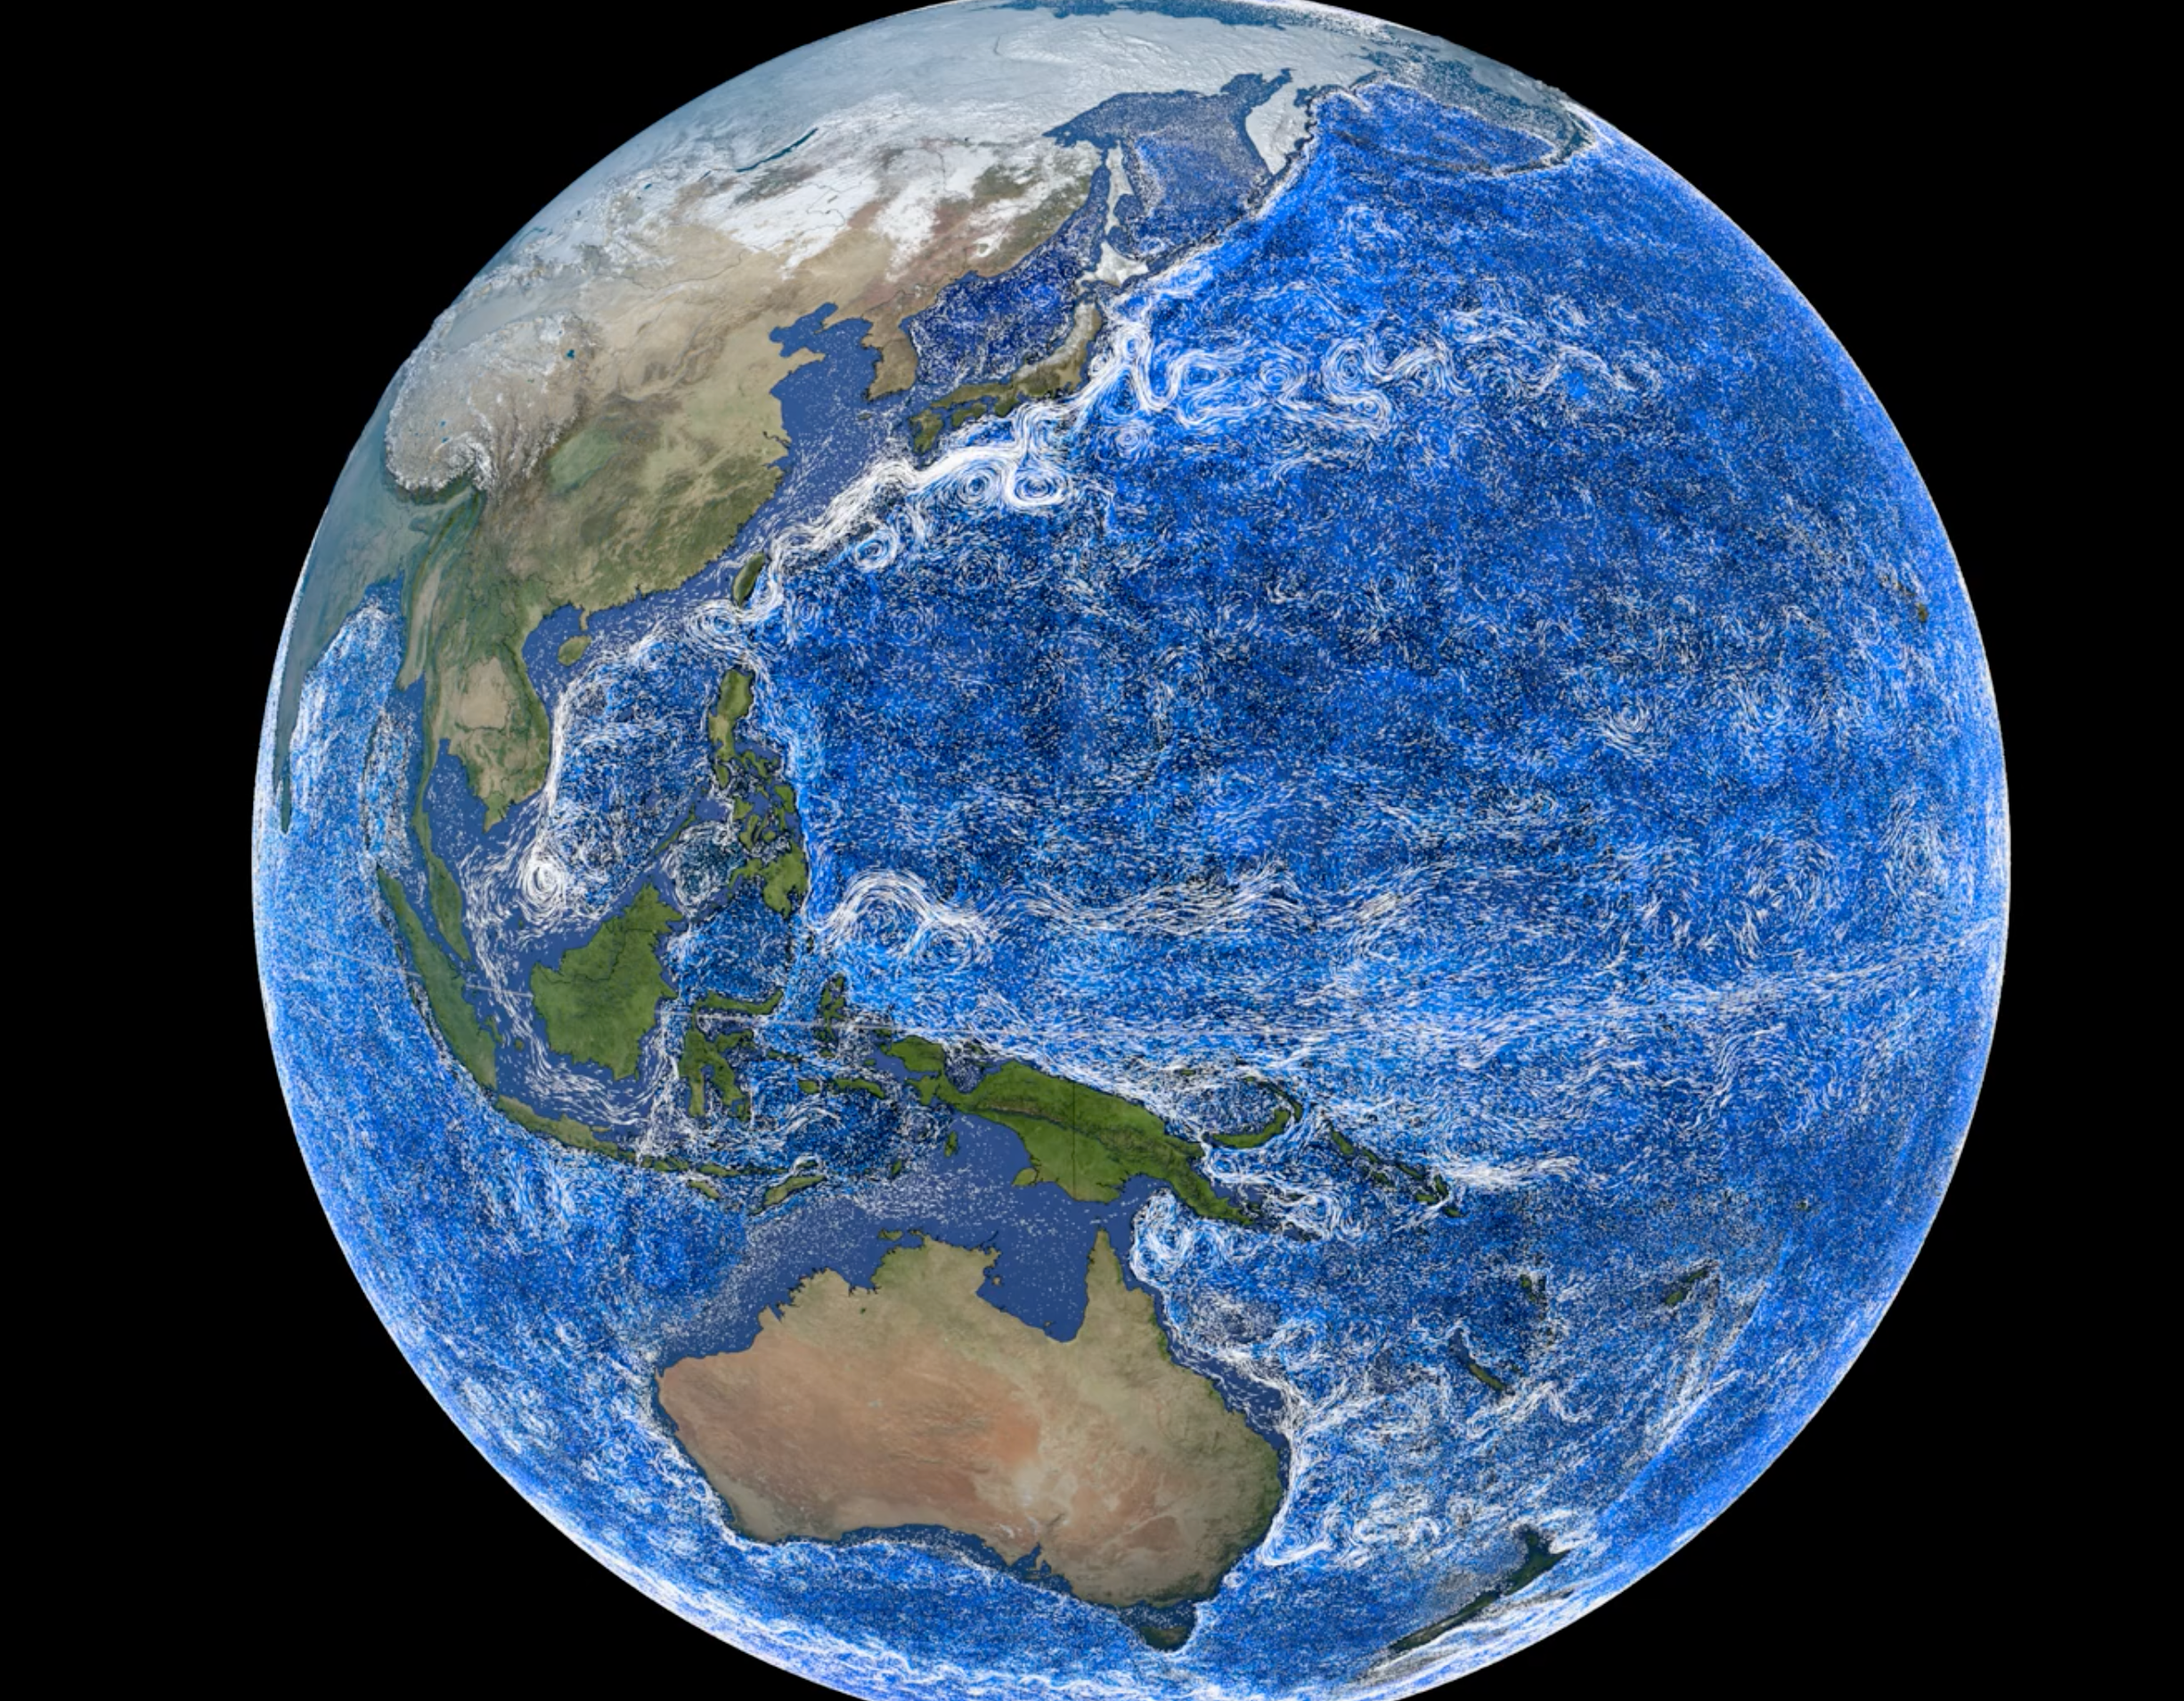
Long before a hurricane takes shape, NASA satellites are already scanning the global ocean and atmosphere, closely tracking the conditions that give rise to powerful storms. One of the most important indicators is sea surface temperature.
NASA combines data from multiple satellites and sensors — such as the Moderate Resolution Imaging Spectroradiometer (MODIS) and VIIRS — to produce sea surface temperature maps like JPL’s Multi-scale Ultra-high Resolution Sea Surface Temperature product and SPoRT’s Sea Surface Temperature Composite product. These global maps, updated daily, support users such as the National Weather Service.
“Having high-resolution, reliable sources of sea surface temperature data is extremely useful,” said Brian McNoldy of the University of Miami, who studies hurricanes. “From one day to the next, these datasets help identify which parts of the tropical Atlantic are above or below average. That information lets forecasters anticipate where storms might strengthen or weaken.”
Hurricane Milton rapidly intensified to category 5 strength over warm gulf waters. View the full story
NASA Earth Observatory/Wanmei Liang
Ocean surface temperatures are only part of the story. NASA also monitors sea surface height with missions such as Sentinel-6 Michael Freilich and SWOT (Surface Water and Ocean Topography), using these measurements as indicators for deeper ocean heat content, a key source of energy fueling hurricanes.
Other NASA-built satellites and sensors measure atmospheric moisture, ocean surface winds, and atmospheric stability, all essential factors influencing whether a storm strengthens or dissipates.
NASA also uses its aircraft to study early storm development up close. In 2022, the agency’s Convective Processes Experiment-Cabo Verde airborne campaign flew off the northwest coast of Africa to study weather systems that can give rise to hurricanes.
The team focused in part on African easterly waves — swirling disturbances in the atmosphere that often become the seeds of Atlantic storms. One of the waves they observed later developed into Tropical Storm Hermine. The mission also gathered data that same year just before hurricanes Fiona and Ian formed.
“The strength of NASA’s pre-storm monitoring lies in both the breadth of measurements we take and the decades-long consistency behind them,” said Will McCarty, manager of weather programs at NASA Headquarters.
“By combining data on sea surface temperature, ocean heat content, wind patterns, and more, we can see early on when conditions align dangerously — often before a storm visibly forms,” McCarty said. “It’s how we turn early warning into early action.”
Preparations for Next Moonwalk Simulations Underway (and Underwater)
Instruments in space are helping scientists map wastewater plumes flowing into the Pacific Ocean from the heavily polluted Tijuana River, seen here with the San Diego sky-line to the north.
NOAA
Proof-of-concept results from the mouth of the Tijuana River in San Diego County show how an instrument called EMIT could aid wastewater detection.
An instrument built at NASA’s Jet Propulsion Laboratory to map minerals on Earth is now revealing clues about water quality. A recent study found that EMIT (Earth Surface Mineral Dust Source Investigation) was able to identify signs of sewage in the water at a Southern California beach.
The authors of the study examined a large wastewater plume at the mouth of the Tijuana River, south of Imperial Beach near San Diego. Every year, millions of gallons of treated and untreated sewage enter the river, which carries pollutants through communities and a national reserve on the U.S.-Mexico border before emptying into the Pacific Ocean. Contaminated coastal waters have been known to impact human health — from beachgoers to U.S. Navy trainees — and harm marine ecosystems, fisheries, and wildlife.
For decades scientists have tracked water quality issues like harmful algal blooms using satellite instruments that analyze ocean color. Shades that range from vibrant red to bright green can reveal the presence of algae and phytoplankton. But other pollutants and harmful bacteria are more difficult to monitor because they’re harder to distinguish with traditional satellite sensors.
A plume spreads out to sea in this image captured off San Diego by the Sentinel-2 satellite on March 24, 2023. Both a spectroradiometer used to analyze water samples (yellow star) and NASA’s EMIT identified in the plume signs of a type of bacterium that can sicken humans and animals.
SDSU/Eva Scrivner
That’s where EMIT comes in. NASA’s hyperspectral instrument orbits Earth aboard the International Space Station, observing sunlight reflecting off the planet below. Its advanced optical components split the visible and infrared wavelengths into hundreds of color bands. By analyzing each satellite scene pixel by pixel at finer spatial resolution, scientists can discern what molecules are present based on their unique spectral “fingerprint.”
Scientists compared EMIT’s observations of the Tijuana River plume with water samples they tested on the ground. Both EMIT and the ground-based instruments detected a spectral fingerprint pointing to phycocyanin, a pigment in cyanobacteria, an organism that can sicken humans and animals that ingest or inhale it.
‘Smoking Gun’
Many beachgoers are already familiar with online water-quality dashboards, which often rely on samples collected in the field, said Christine Lee, a scientist at JPL in Southern California and a coauthor of the study. She noted the potential for EMIT to complement these efforts.
“From orbit you are able to look down and see that a wastewater plume is extending into places you haven’t sampled,” Lee said. “It’s like a diagnostic at the doctor’s office that tells you, ‘Hey, let’s take a closer look at this.’”
Lead author Eva Scrivner, a doctoral student at the University of Connecticut, said that the findings “show a ‘smoking gun’ of sorts for wastewater in the Tijuana River plume.” Scrivner, who led the study while at San Diego State University, added that EMIT could be useful for filling data gaps around intensely polluted sites where traditional water sampling takes a lot of time and money.
EMIT’s Many Uses
The technology behind EMIT is called imaging spectroscopy, which was pioneered at JPL in the 1980s. Imaging spectrometers developed at JPL over the decades have been used to support areas ranging from agriculture to forest health and firefighting.
When EMIT was launched in July 2022, it was solely aimed at mapping minerals and dust in Earth’s desert regions. That same sensitivity enabled it to spot the phycocyanin pigments off the California coast.
Scrivner hadn’t anticipated that an instrument initially devoted to exploring land could reveal insights about water. “The fact that EMIT’s findings over the coast are consistent with measurements in the field is compelling to water scientists,” she said. “It’s really exciting.”
Preparations for Next Moonwalk Simulations Underway (and Underwater)
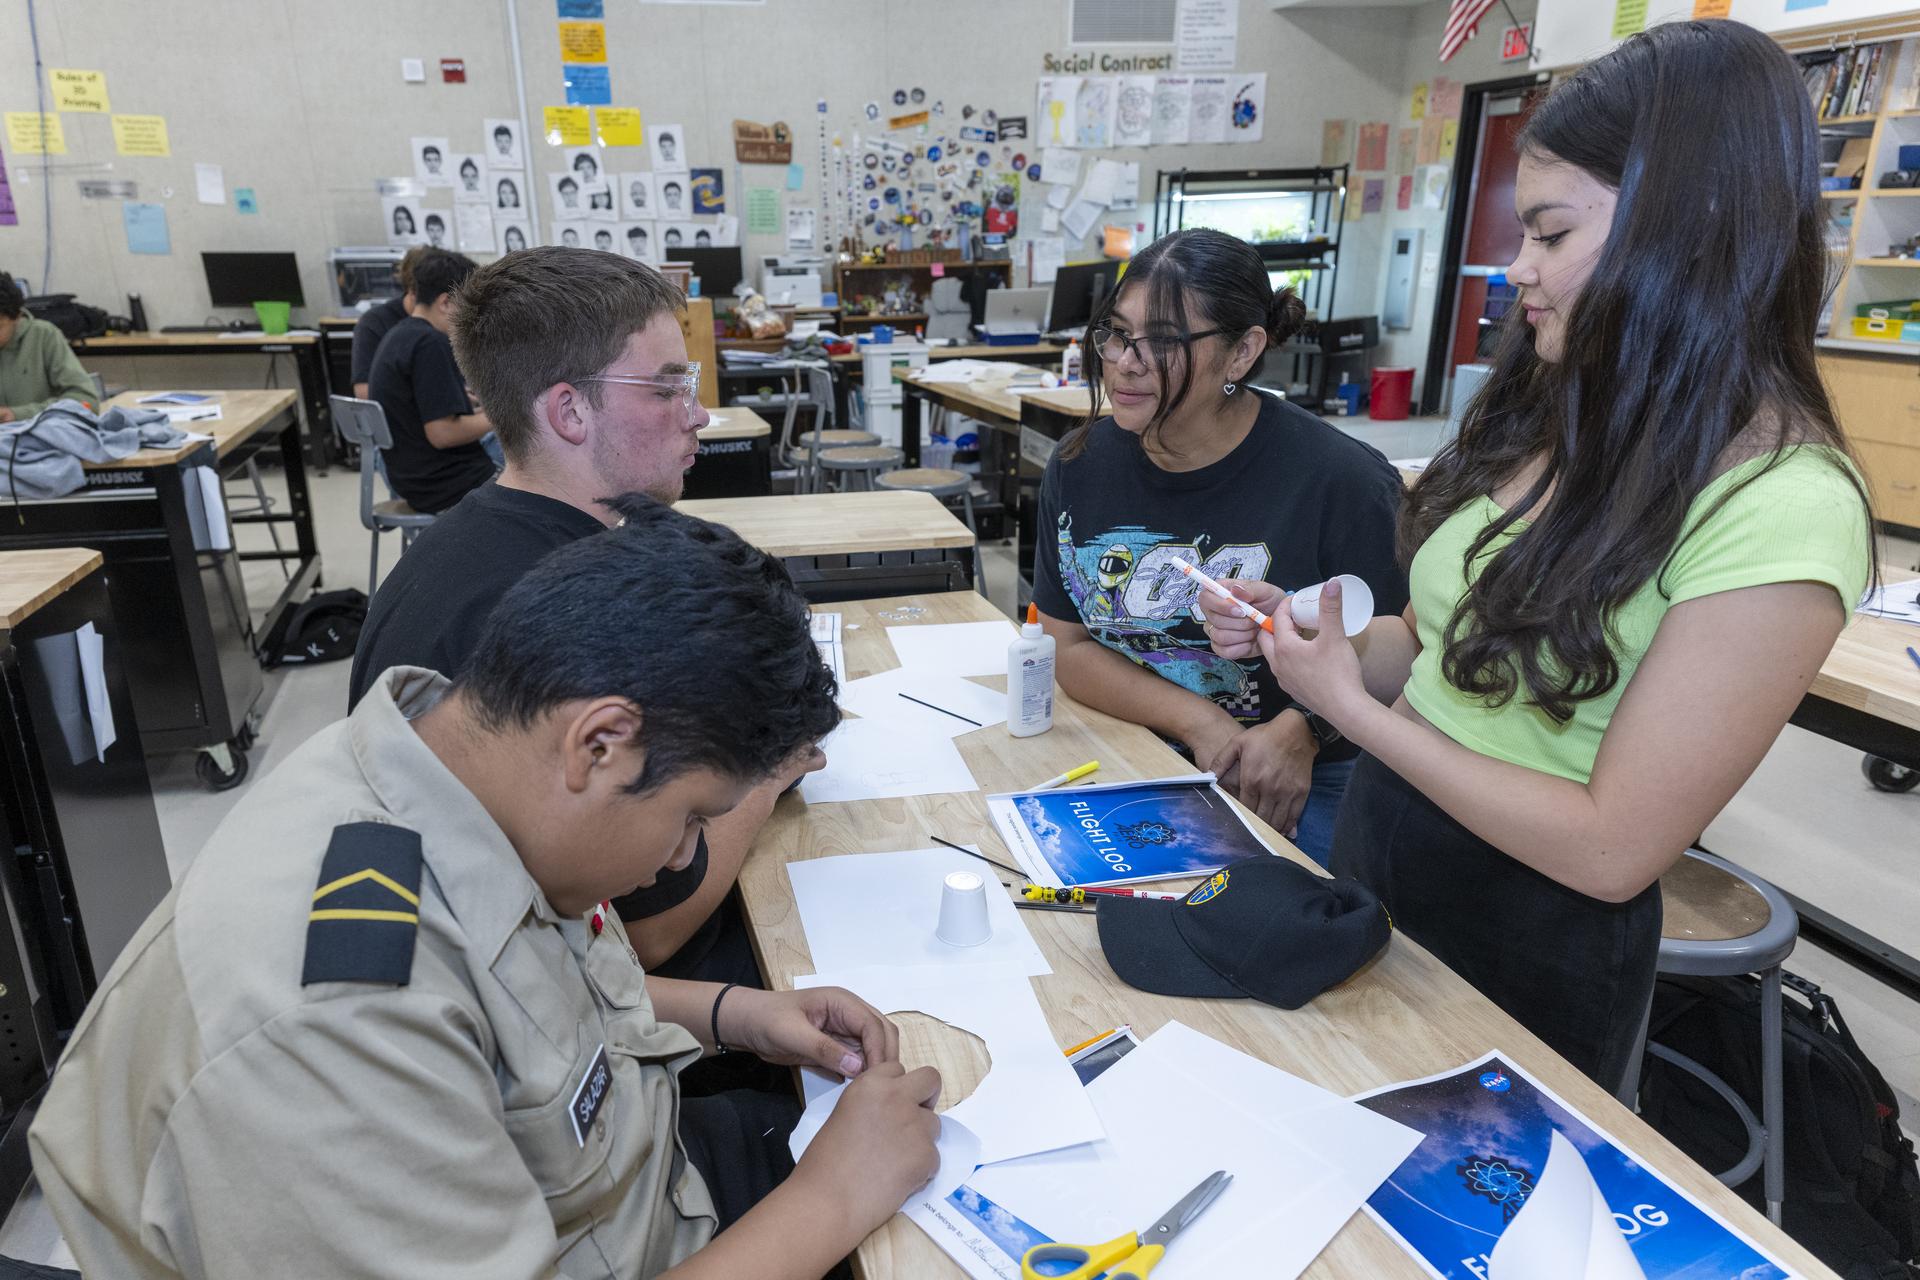
Students from Tropico Middle School in Rosamond, California, build their own paper planes as part of a project during NASA Aero Fair on April 9, 2025.
NASA/Genaro Vavuris
A new generation of aerospace explorers will soon embark on a hands-on summer experience focusing on careers in science, mathematics, engineering, and technology (STEM). This month, NASA’s Armstrong Flight Research Center in Edwards, California, and the Flight Test Museum Foundation will launch the 2025 Junior Test Pilot School.
Held at Blackbird Airpark and Joe Davies Heritage Airpark in Palmdale, California, this six-week program invites elementary-aged students to step into the shoes of test pilots and engineers from 9 a.m. to 2 p.m. Mondays through Fridays, June 16 through July 25. Registration is free through participating school districts and the Flight Test Museum. Students will have direct access to legendary aircraft such as A-12, SR-71, U-2, F-86 Sabre, and NASA Boeing 747 Space Shuttle Carrier Aircraft.
The Junior Test Pilot School combines authentic NASA-designed curriculum, immersive aerospace activities, and direct engagement with engineers, test pilots, and scientists to inspire future aerospace professionals in the Antelope Valley – home to one of the nation’s highest concentrations of STEM careers.
“This program offers more than a glimpse into aerospace, it provides students a hands-on opportunity to solve real-world problems and see themselves in future STEM roles,” said Dr. Amira Flores, program integration manager for NASA’s California Office of STEM Engagement.
Additionally, in collaboration with NASA Armstrong’s Aero Fair program, students will be guided through the program’s Wildfire Design Challenge by a NASA volunteer. Following the engineering design process, students will collaborate to design and build a prototype of an aerial vehicle that suppresses wildfires.
“Our junior test pilots learn to analyze the aircraft to figure out why they were designed the way they are and think like an engineer,” said Lisa Sheldon Brown, director of education at the Flight Test Museum. “Research shows that academic trajectory is set by fifth grade, making this the critical window to inspire STEM interest and career awareness.”
The program is delivered in partnership with the City of Palmdale and is supported by industry sponsors, including Lockheed Martin and Northrop Grumman. These partners not only provide funding and volunteers but also elevate career exposure by introducing students to diverse aerospace professionals within the region.
NASA Armstrong is a hub of aeronautical innovation and STEM workforce development in the Antelope Valley. Through programs like Aero Fair and partnerships like Junior Test Pilots School, Armstrong inspires and equips the next generation of engineers, pilots, and scientists.
The Flight Test Museum Foundation preserves the legacy and promotes the future of aerospace through education programs and historical preservation at the Blackbird Airpark and forthcoming Flight Test Museum at Edwards Air Force Base in Edwards, California.
For more about NASA’s Armstrong Flight Research Center, visit:
This website uses cookies to improve your experience. We'll assume you're ok with this, but you can opt-out if you wish.AcceptRead More
Privacy & Cookies Policy
Privacy Overview
This website uses cookies to improve your experience while you navigate through the website. Out of these, the cookies that are categorized as necessary are stored on your browser as they are essential for the working of basic functionalities of the website. We also use third-party cookies that help us analyze and understand how you use this website. These cookies will be stored in your browser only with your consent. You also have the option to opt-out of these cookies. But opting out of some of these cookies may affect your browsing experience.
Necessary cookies are absolutely essential for the website to function properly. This category only includes cookies that ensures basic functionalities and security features of the website. These cookies do not store any personal information.
Any cookies that may not be particularly necessary for the website to function and is used specifically to collect user personal data via analytics, ads, other embedded contents are termed as non-necessary cookies. It is mandatory to procure user consent prior to running these cookies on your website.
.jpg?w=5438&h=3638&fit=clip&crop=faces%2Cfocalpoint)


.JPG?w=1024&h=512&fit=clip&crop=faces%2Cfocalpoint)