Preparations for Next Moonwalk Simulations Underway (and Underwater)
SARP students peer into the cockpit onboard NASA’s P-3 aircraft, during research flights for the 2025 Student Airborne Research Program (SARP) internship.
NASA/Milan Loiacono
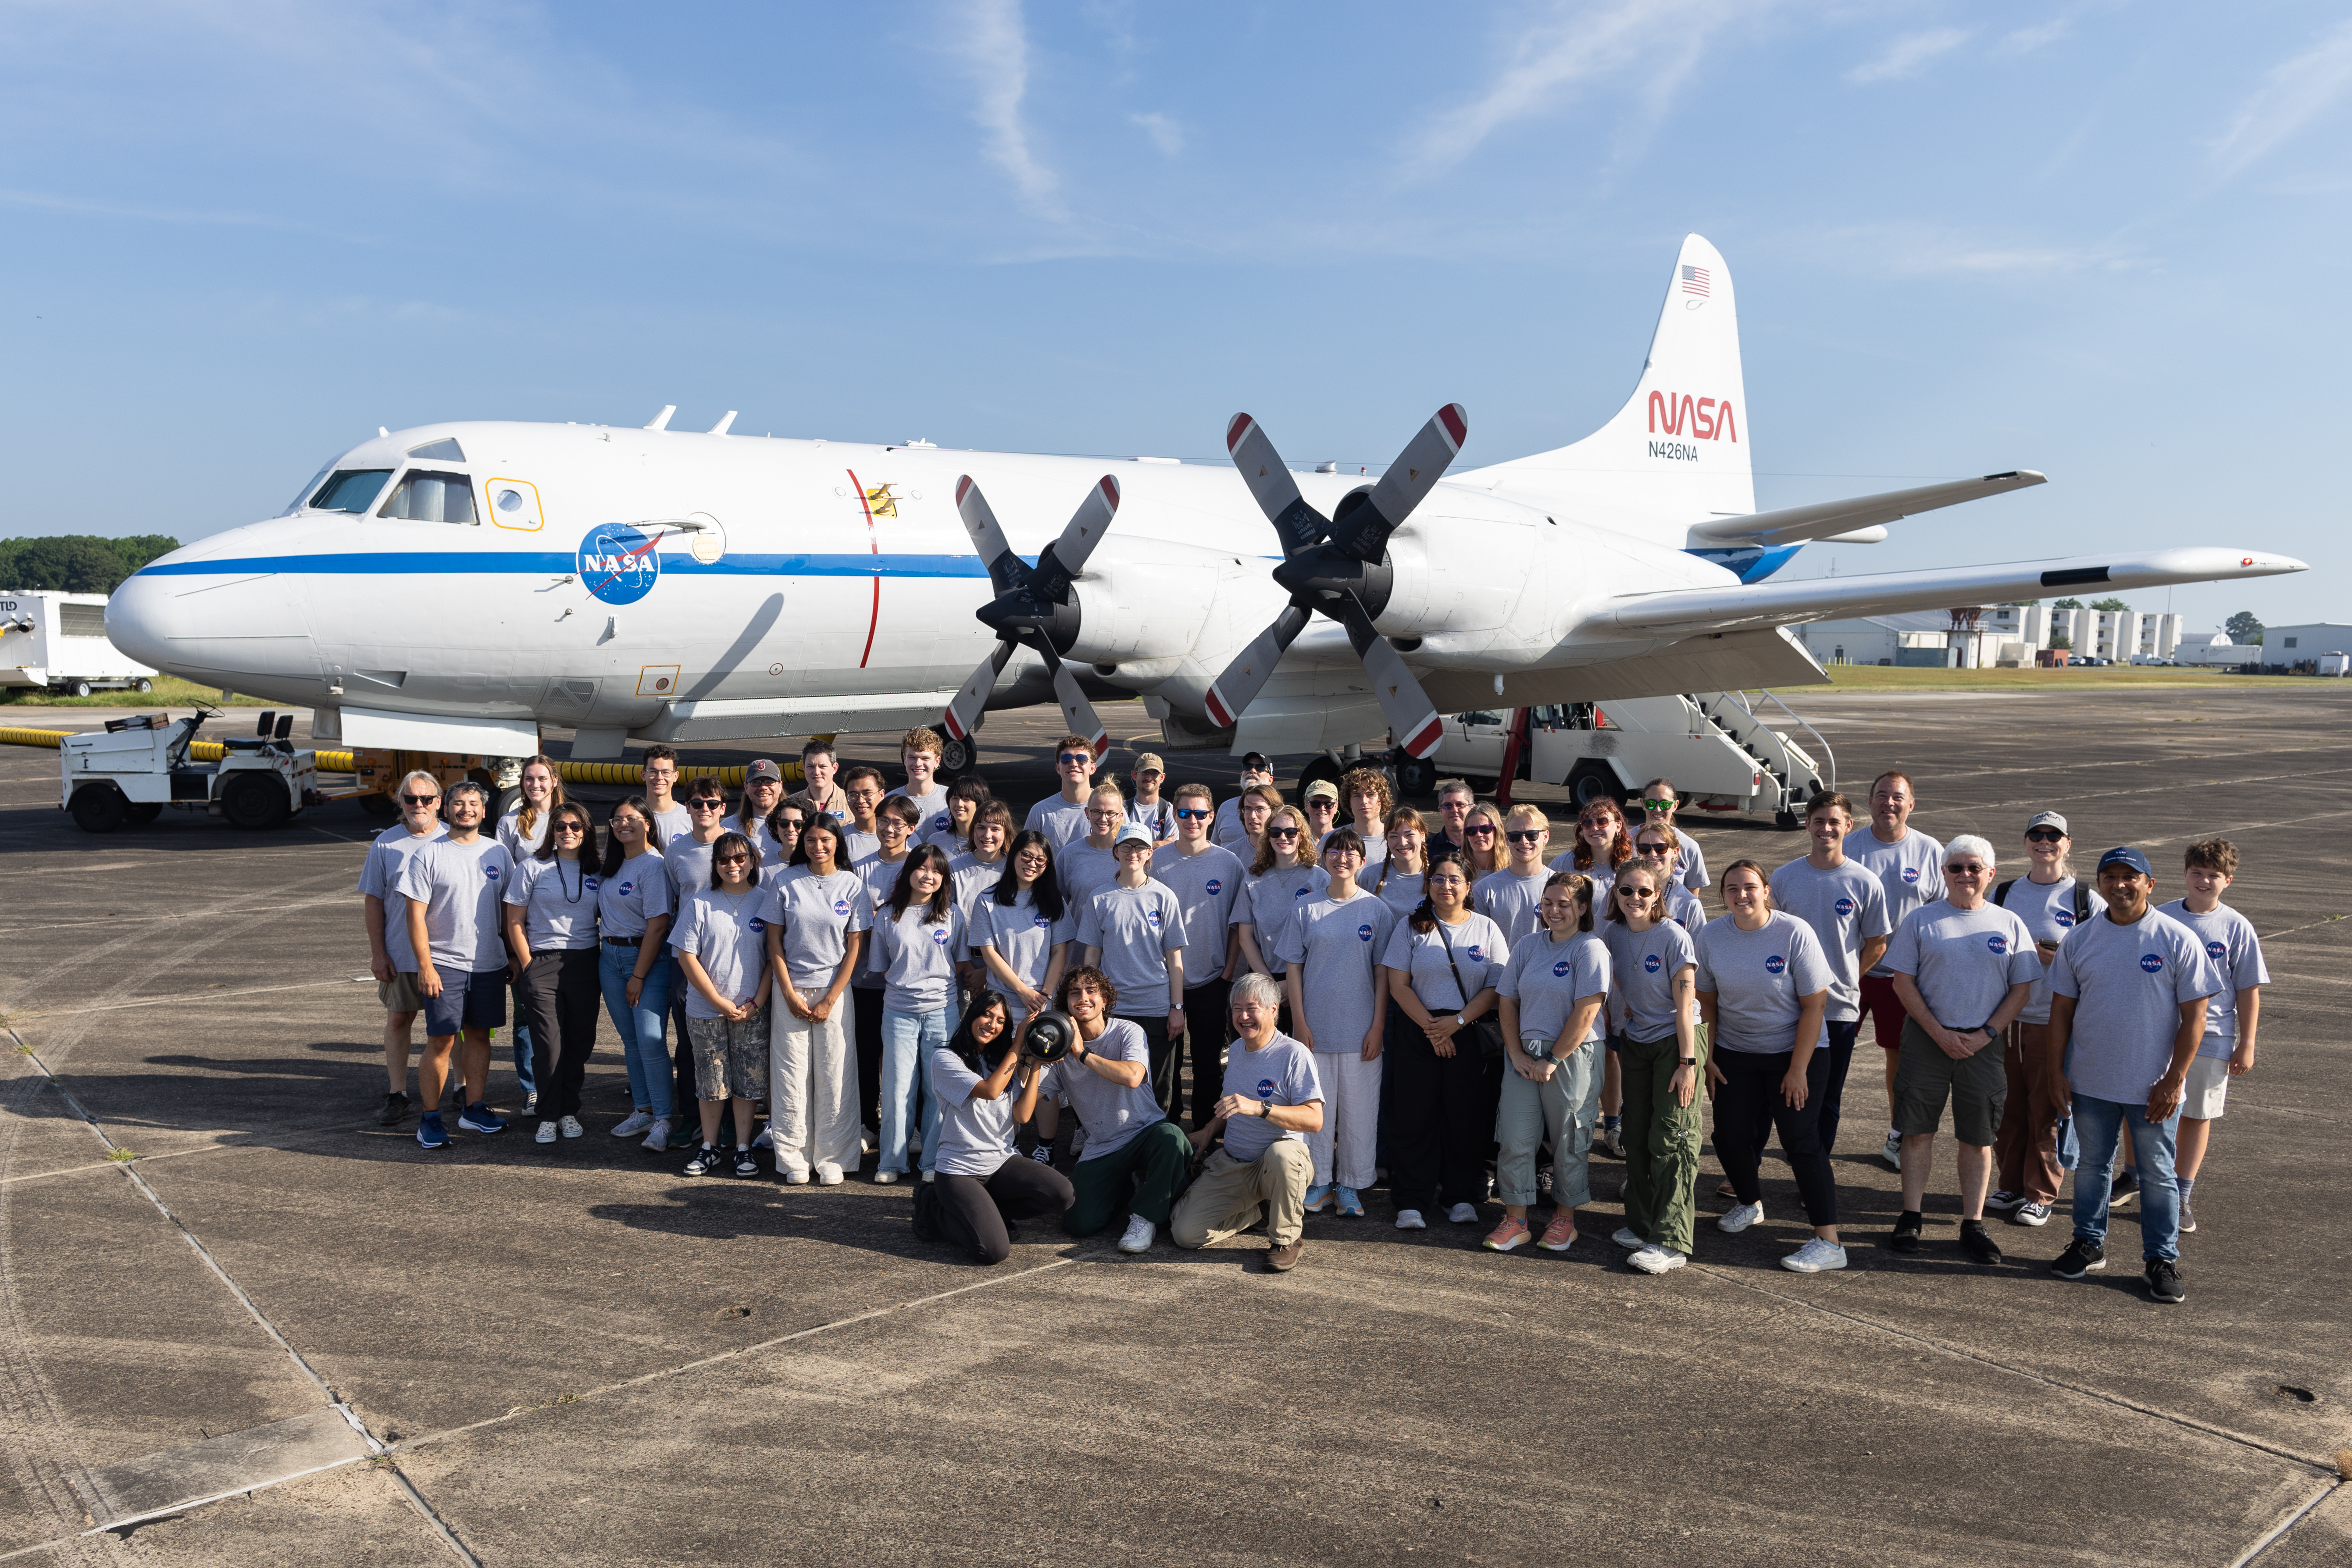
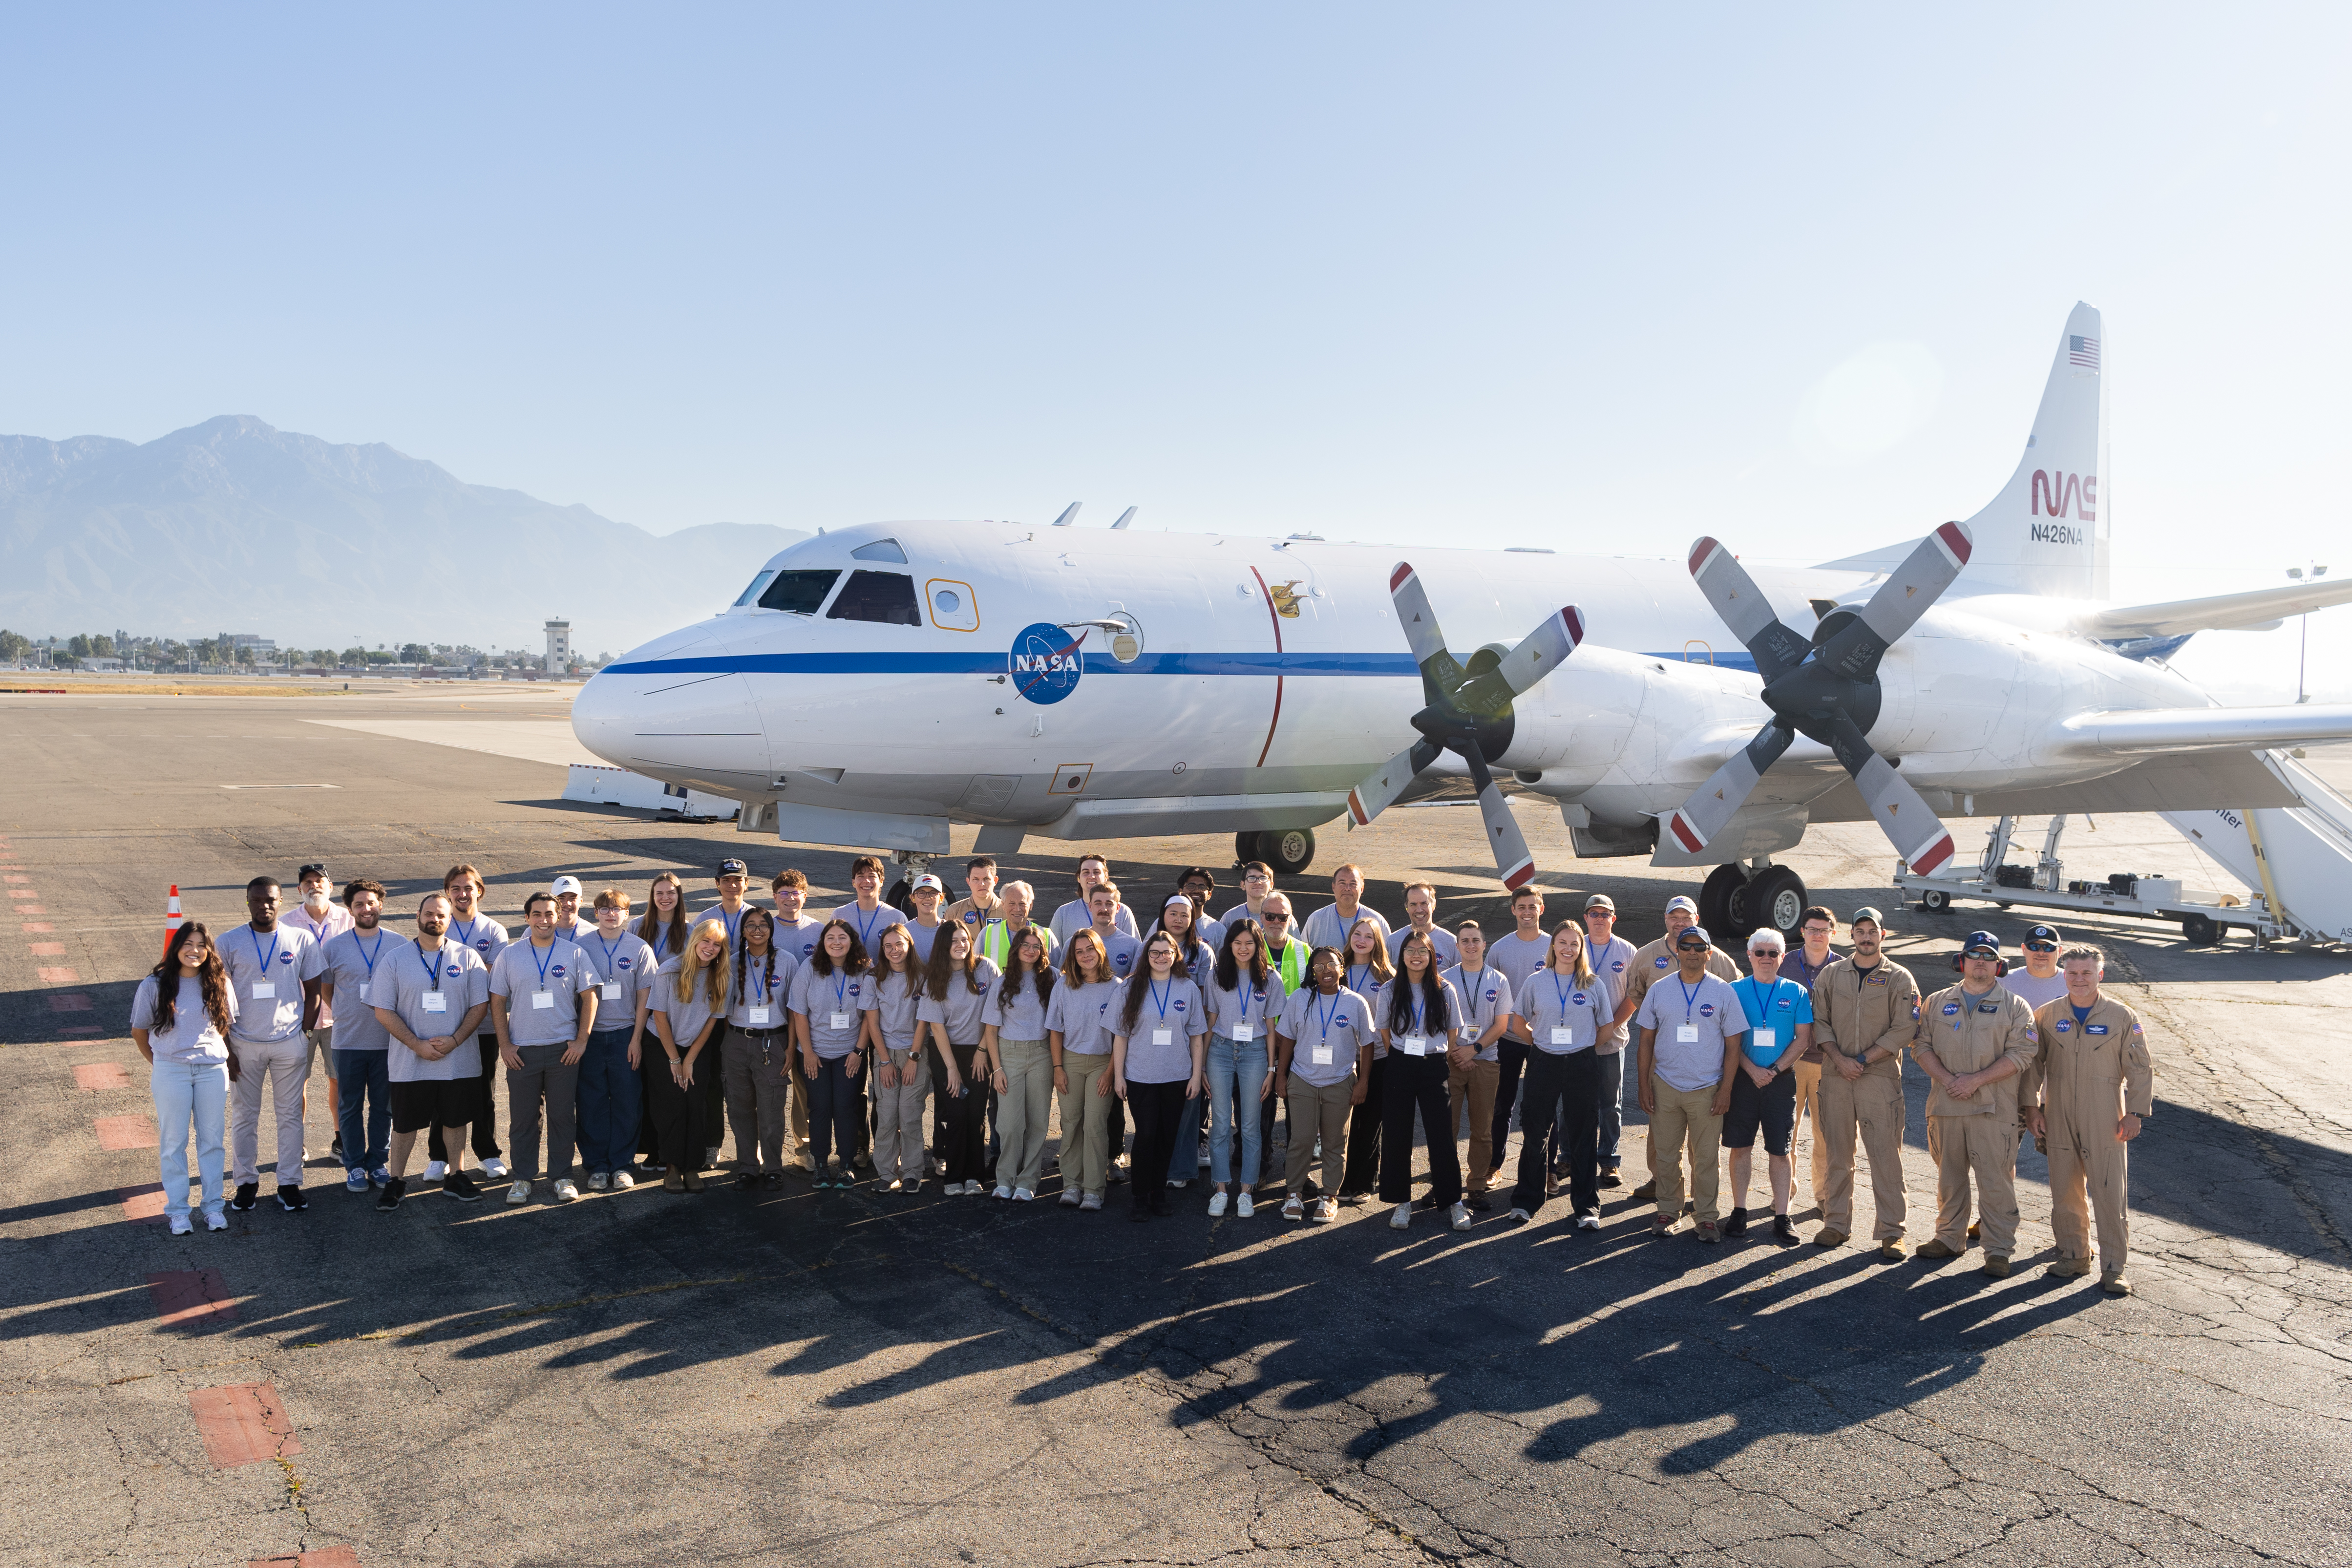
In August 2025, 47 students from NASA’s Student Airborne Research Program (SARP) culminated a summer of science by presenting their research to an audience of mentors, professors, family, friends, and NASA personnel.
SARP is a summer internship for undergraduate students, hosted in two cohorts: this year SARP West operated out of Guardian Jet Center and University of California, Irvine in Southern California, while SARP East operated out of Wallops Flight Facility and Virginia Commonwealth University in Virginia.
SARP randomly assigns students into one of four research disciplines, to encourage interdisciplinary collaboration and give them the opportunity to work outside of their usual field. Each discipline is led by a faculty researcher who is an expert in their field, and supported by a graduate mentor. This year, SARP research topics spanned three spheres: atmosphere, biosphere, and hydrosphere, covered between the two cohorts.
The beauty of Earth science lies in its interconnectedness. As a student who primarily researches atmospheric science, stepping out of my comfort zone to explore something new was truly eye-opening, and I am incredibly grateful for the experience.
Nimay mahajan
2025 SARP West student
Over the course of two months, students learned more about NASA’s Airborne Science Program and Earth Science through lectures led by SARP faculty and guest speakers from NASA and the Earth science community, engaged in Earth science data collection while flying onboard Dynamic Aviation’s B-200 and NASA’s P-3 aircraft, and participated in field trips to perform ground sampling fieldwork. Students also visited NASA’s Jet Propulsion Laboratory, Goddard Space Flight Center, and NASA Headquarters. The program also includes other enriching opportunities such as visiting the University of California San Diego’s WAVElab and Virginia Commonwealth University’s Rice Rivers Center.
Students were also provided the opportunity to attend introductory programming sessions and receive hands-on support from a coding mentor to develop and strengthen their experience with code, and incorporate code in their research project.
SARP really made me realize that science is bigger than all of us, but it needs every one of us – even those just stepping into the scientific world – to contribute. Every effort, no matter how big or small, is a step forward in a mission greater than any one individual.
TJ Ochoa Peterson
2025 SARP East student
To watch videos of these student’s presentations, read their research abstracts, or see more photos from the summer, please follow the links below.
2025 SARP East Research Presentations
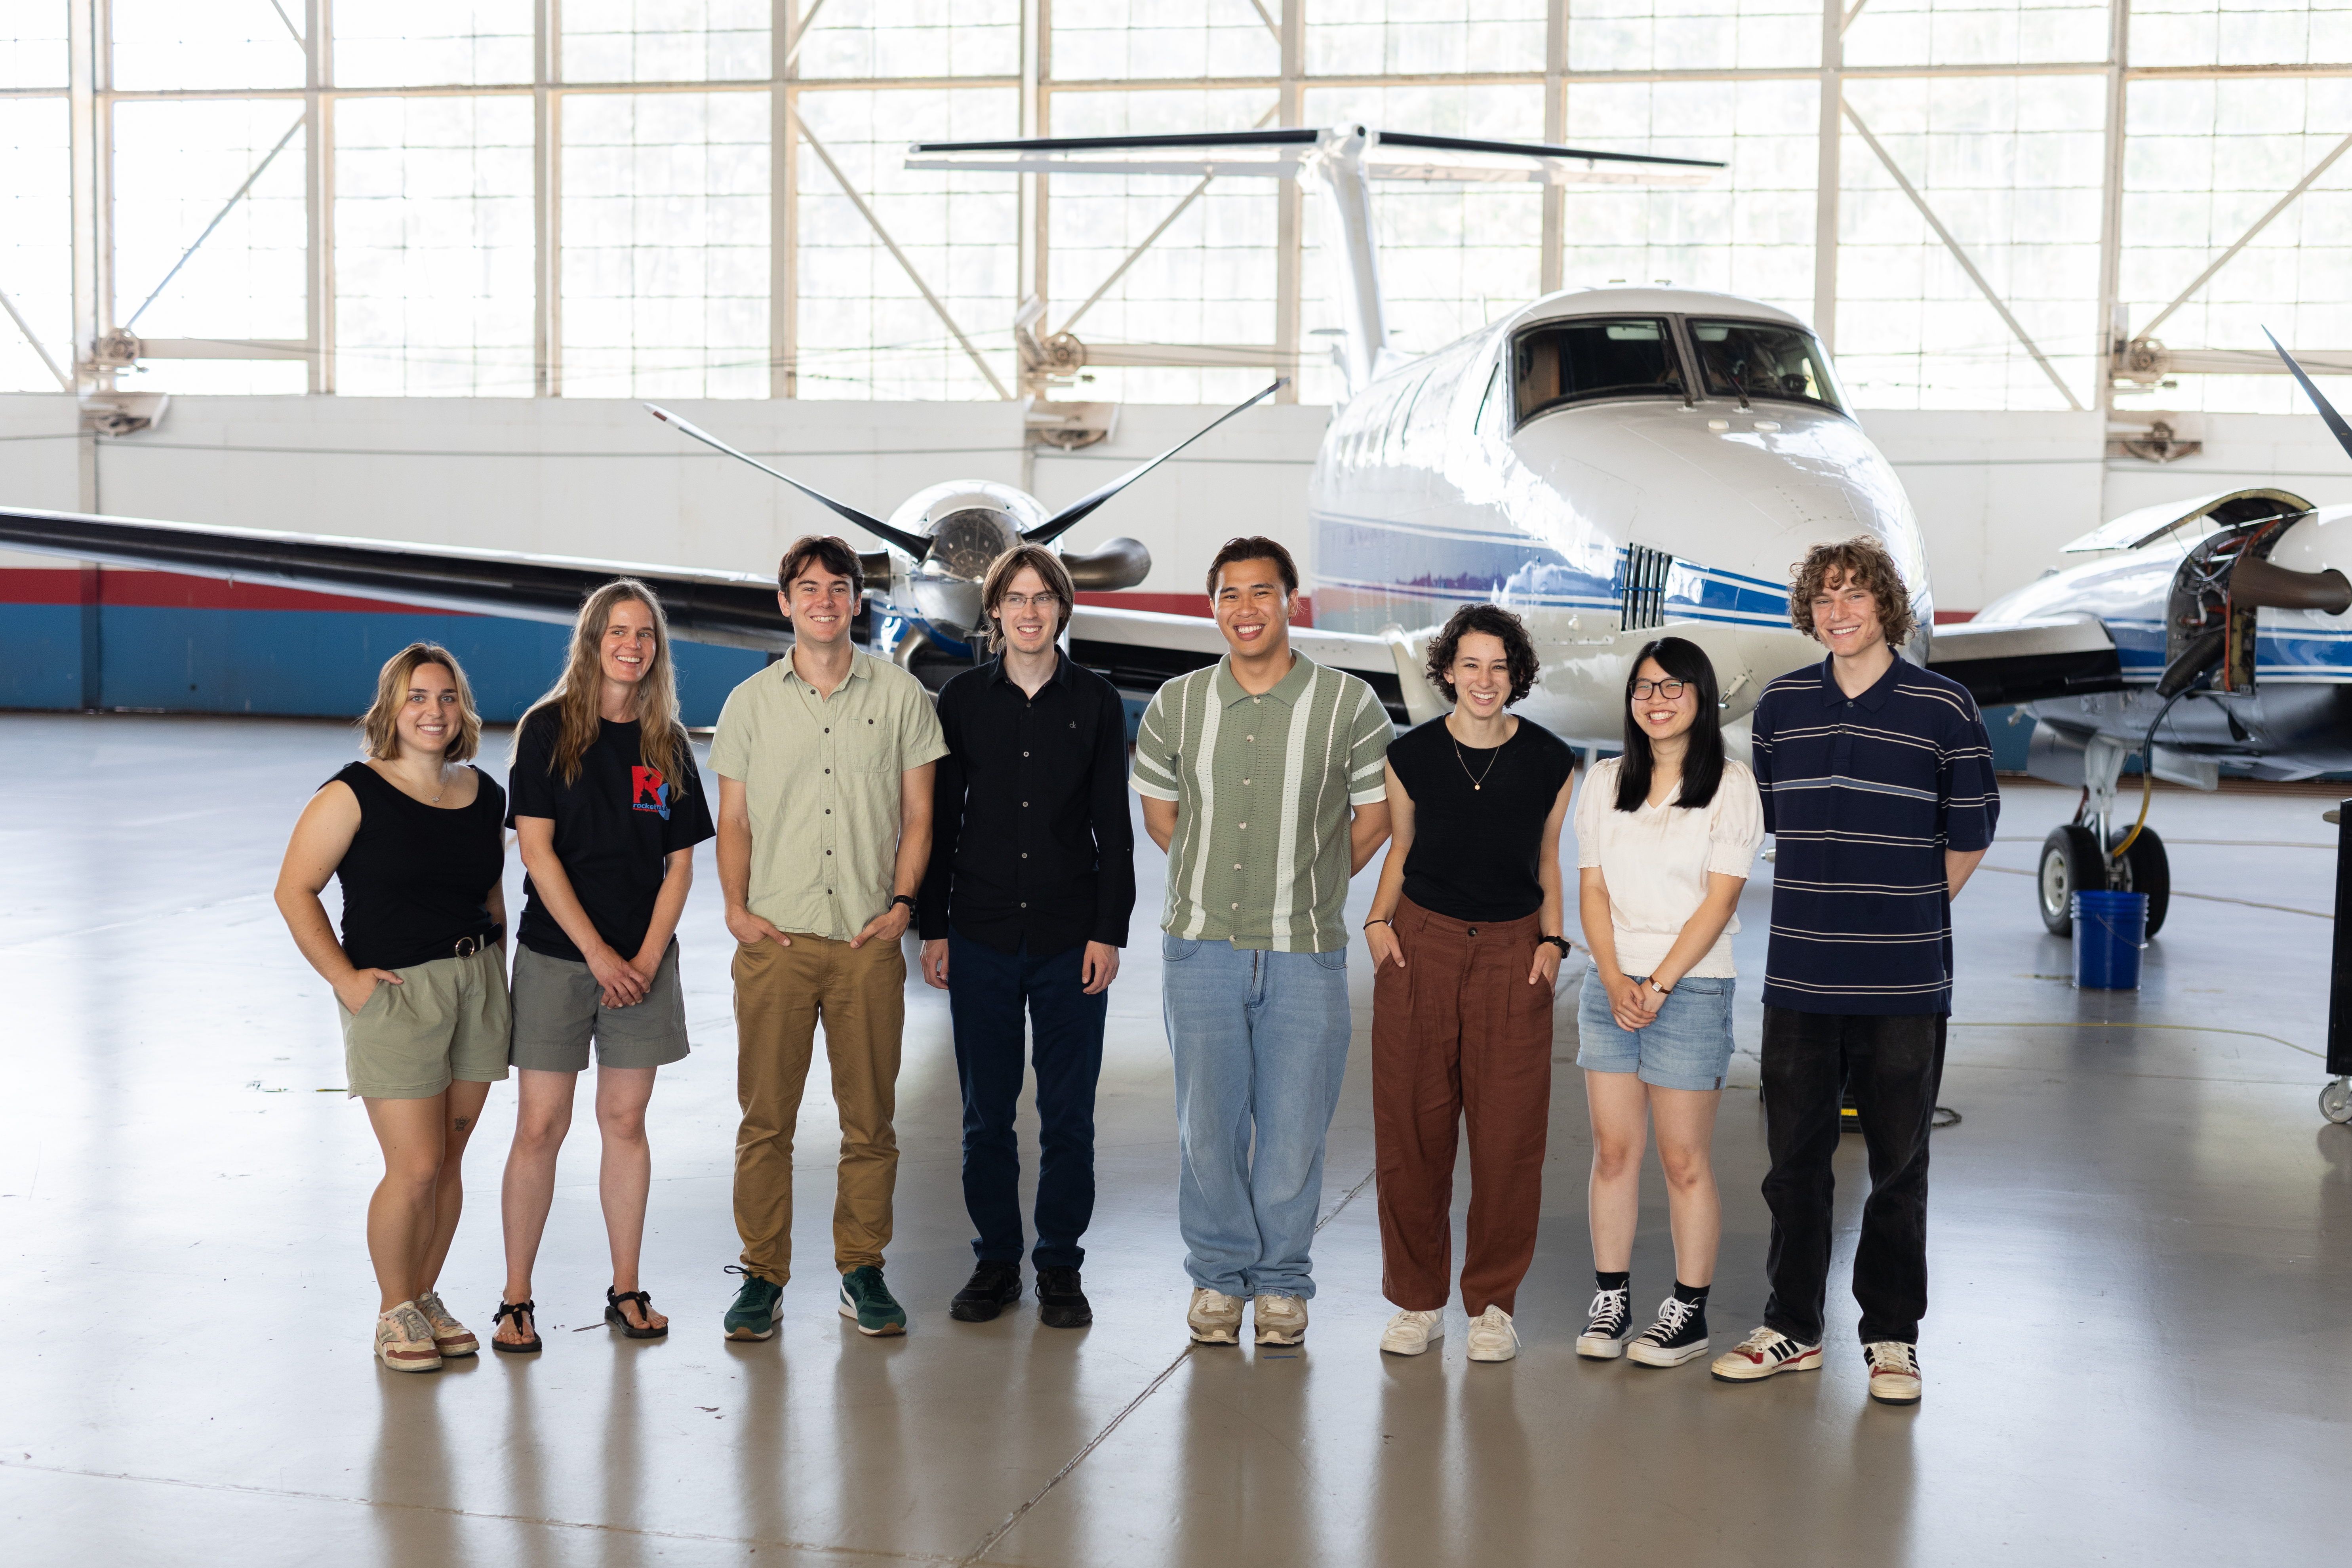
The 2025 SARP East Aerosols Group poses in front of the Dynamic Aviation B-200 aircraft, parked in a hangar at NASA’s Wallops Flight Facility in Virgina. During the internship, students spend a week engaged in Earth science data collection and learning from instruments specialists while flying onboard both the B-200 and NASA’s P-3 aircraft.
Preparations for Next Moonwalk Simulations Underway (and Underwater)
The 2025 SARP East Terrestrial Fluxes Group poses in front of the Dynamic Aviation B-200 aircraft, parked in a hangar at NASA’s Wallops Flight Facility in Virginia. During the internship, students spend a week engaged in Earth science data collection and learning from instruments specialists while flying onboard both the B-200 and NASA’s P-3 aircraft.
Brandon Alveshere, Virginia Commonwealth University
Graduate Mentor:
Kayla Preisler, University of Arizona
Terrestrial Fluxes Group Introduction
Rice Rivers Center Director Chris Gough and Graduate Mentor Kayla Preisler
Quinn Koch
Monitoring Postfire Ecosystem Recovery With Spectral Indices and Eddy-Covariance Flux Towers
Quinn Koch, University of California, Los Angeles
Fire is a common ecological disturbance in forest ecosystems, leading to changes in forest structure and function that have implications for the Earth’s carbon budget. Observations of post-fire carbon fluxes provide insight into the trajectory of forest recovery and its future as a carbon sink. Eddy-covariance flux towers measure high frequency greenhouse gas exchange between forests and the atmosphere, yielding measurements of net ecosystem exchange (NEE), gross primary productivity (GPP), and ecosystem respiration (Reco). While flux towers are the gold standard for quantifying ecosystem scale fluxes, vegetation indices derived from remote sensing are highly correlated with tower flux data and may provide broader spatial scale understanding of how carbon fluxes vary following fire and other disturbances. The objective of our study is to examine the relationship between tower carbon flux data and NASA Landsat-derived spectral indices at five sites in the United States and Australia that were disturbed by severe fire. Specifically, we evaluated changes following fire in two Landsat-derived spectral indices, Normalized Difference Vegetation Index (NDVI) and Normalized Burn Ratio (NBR), examining whether spectral indices paralleled temporal variation in NEE, GPP, and Reco. We found that the recovery of spectral indices outpaced the recovery of NEE and GPP at sites that experienced severe fire, highlighting how lags in structural and functional responses to disturbance may decouple vegetation indices from carbon fluxes. This suggests that a temporal lag should be considered when using vegetation indices as a proxy for carbon fluxes in post-fire ecosystems compared to unburned systems. This analysis represents a small snapshot of ecosystems worldwide; therefore, continuing to monitor these trends at future burned flux tower sites will be crucial to further understanding this relationship.
Sara Typrin
Characterizing Forest Response Pathways in the Blackwater National Wildlife Refuge
Sara Typrin, Carleton College
Coastal forests along the Chesapeake Bay are rapidly becoming marshes due to sea level rise and extreme weather events. Predicting these ecosystem shifts is essential for climate adaptation responses. Previous studies have employed Normalized Difference Vegetation Index (NDVI) time series trends to characterize the resilience of coastal ecosystems; however, few have assessed NDVI variation trends within the Chesapeake Bay coastal region, where rates of sea level rise far exceed the global average. This study examines the spatial distribution of forest response pathways in relation to elevation within Maryland’s Blackwater National Wildlife Refuge and the surrounding Eastern Shore region. We used the Landsat 8 record (2014-2024) to extract NDVI values for areas classified as upland forest. We calculated trends in NDVI and NDVI variation using Kendall’s τ (rank correlation) to characterize each 30m pixel into one of four ecosystem shift trajectories: abrupt transition, gradual transition, recovering, or stable. We found that 14.7% of the study area is in abrupt transition, 27.4% in gradual transition, 17.3% is in recovery, and 40.6% is stable. Mapping these regions qualitatively shows that in the BNWR, areas closer to the coast tend to experience abrupt or gradual transitions, and areas farther from the coast are typically stable or in recovery. Recovering forests have higher and more variable elevations than other pathways in a subset of BNWR’s southwest region. Future work can examine how elevation and distance to the coast relate to forest response pathways at a regional scale.
Austin Jeffery
Structural Characteristic Variation Between Upland Forests and Forested Wetlands
Austin Jeffery, The University of Texas at Austin
Forested wetlands are important for regulating the Earth’s climate, cycling nutrients, and providing vital habitats, but are far less studied than upland forests. Prior work in upland forests has illustrated that canopy structural traits vary widely within and across forest types, and that these traits affect crucial ecosystem functions and services such as primary production and carbon sequestration. However, how canopy structure varies within and across forested wetlands has not been thoroughly explored. This study uses waveform lidar data collected during the 2024 SARP East flight campaigns over the Chesapeake Bay region using the LVIS (Land, Vegetation, and Ice Sensor) airborne platform. The LVIS Facility L2 Geolocated Surface Elevation and Canopy Height Products were used to investigate how canopy structure varies across forested wetlands and to compare canopy structural variation between forested wetlands and upland forests. To analyze the data, each lidar granule was first divided into upland and wetland forests by overlaying the granules over a USGS NLCD land use map and a USFS forest type map. Then, 20 plots were created of 100 granules each based on four tree species and whether it was an upland forest or forested wetland plot. Two upland and two wetland species were used with 5 plots each. Then, the data were used to assess variation in structural characteristics, including canopy height and vertical complexity, among forested wetlands and upland forests. The analysis resulted in a significant statistical difference between forested wetlands and upland forests structural characteristics. Additionally, forested wetlands showed a general larger variance in canopy structural complexity suggesting variation in canopy height, canopy density, layering, and forest age. This study serves as a benchmark for LiDAR-based structural characterization of forested wetlands, and informs management and conservation of forested wetlands in the mid-Atlantic region.
Ellery Moore
Arctic Ecosystem Carbon Dynamics: Comparing Greenhouse Gas Measurements in Alaska and Northern Canada Using MODIS Satellite Data and Atmospheric Flask Samples
Ellery Moore, Colby College
As global temperatures continue to warm, the International Panel on Climate Change (IPCC) has called attention to thawing permafrost as a potential tipping point leading to “irreversible” change to Earth’s ecosystems. Currently, permafrost holds an estimated 1,400 Pg of carbon, which will be released primarily as greenhouse gases (GHGs), methane (CH4), and carbon dioxide (CO2), through microbial activity as temperatures continue to rise, thus exacerbating the atmospheric GHG effect and further warming. In Alaska and Northern Canada, permafrost underlies most of the land, with regions determined by the percentage of frozen soil: continuous (90-100%) and discontinuous (50-90%). Upon examination of spatial maps, the continuous region tends to correspond to the tundra ecosystem, and the discontinuous region to the boreal forest ecosystem. We quantified the permafrost regions using Moderate Resolution Imaging Spectroradiometer (MODIS) derived Normalized Difference Vegetation Index (NDVI) and land surface temperature (LST). In this study, we aim to determine if CO2 and CH4 concentration measurements differ between the two ecosystems using atmospheric flask samples collected during the Arctic Boreal Vulnerability Experiment (ABoVE) in 2017. Overall, the results showed a positive correlation between NDVI and LST, with the boreal forest characterized by higher NDVI and LST than the tundra. Additionally, higher CO2 concentrations were associated with lower NDVI and LST. However, when separating the samples into the two ecosystems, no difference was seen in their diurnal cycles. In general, CH4 measurements did not show a clear relationship with NDVI and LST, but predominantly higher measurements were seen in the tundra when separating the samples by ecosystem. The different CH4 concentrations could be influenced by other environmental sources not considered in this study, such as thermokarst lakes and anthropogenic factors. Further work to differentiate the ecosystems and confirm findings can be done by examining soil moisture samples and comparing permafrost active layer thicknesses. Additionally, to better understand the rates of carbon release, eddy covariance measurements could be examined between the tundra and boreal forest over time.
Rayyane Matonding
San Francisco BVOC Emissions: The Role of Urban Vegetation in HCHO/NO2 Ratios
Rayyane Matonding, University of San Francisco
Biogenic Volatile Organic Compounds (BVOCs) influence local air quality, especially during summer when emissions and photochemical activity peak. BVOCs can oxidize to form ground level ozone, which poses respiratory health risks. Formaldehyde (HCHO), a key photooxidation product of BVOCs, serves as a useful proxy for biogenic emissions in remote sensing studies. Likewise, nitrogen dioxide (NO2) indicates combustion-related activity and anthropogenic VOC influence. This study examines the relationship between urban tree cover and BVOC-related ozone formation using the HCHO to NO2 photochemical regime, which reflects the balance between biogenic and anthropogenic sources. HCHO and NO2 data were obtained from NASA’s TEMPO instrument, and tree cover data from SF OpenData. San Francisco was selected due to its urban greening efforts, high anthropogenic emissions, and prevalence of invasive tree species. Two neighborhoods were selected, Sunnyside with approximately 22 percent canopy cover and Potrero Hill with approximately 2 percent canopy cover, to compare temporal trends in HCHO to NO2 ratios using time series plots. These neighborhoods were chosen based on the availability of hyperlocal weather data, which allowed for more localized atmospheric analysis. No consistent relationship between tree cover and HCHO to NO2 ratios was observed, except during 15:11 and 18:11 on June 18, 2024, which may be associated with elevated photolysis. When weather variables such as zonal wind, meridional wind, and temperature were included in the analysis, no significant correlations were found. Further research should include other cities, additional time periods, and tree species information.
Emmanuel Kaiser-Veyrat
Vegetation Traits to Methane Fluxes: A Machine Learning Approach Across Diverse Wetlands
Emmanuel Kaiser-Veyrat, Cornell University
Wetlands are the largest and most uncertain biological source of CH4, a greenhouse gas with 56 times the radiative forcing of CO2 over a 20-year time horizon. Given the spatiotemporal constraints of these dynamic ecosystems for consistent on-site observations, remotely sensed vegetation indices (VIs) offer a scalable approach to capturing the biophysical and biochemical conditions that govern CH4 exchanges. However, their reliability in wetland environments is challenged by signal saturation in dense vegetation as well as spectral mixing of water, soil, and plants. Seeking to quantify these limitations, we employ the machine learning algorithm, Random Forest Regressor (RFR), to answer the question: Can remotely sensed vegetation traits predict CH4 fluxes across freshwater and saltwater marshes? VIs from the Index DataBase are derived from the Landsat Collection 2 Level-2 products for Landsat-7 ETM+ and Landsat-8 OLI. The FLUXNET-CH4 Community Product yields 17 wetland sites across the contiguous U.S. with daily mean methane flux values spanning some or all of the 2011 to 2018 interval. Generalized flux footprints were computed for every site adopting a uniform approach scaling fetch with increasing measurement height. Extracting feature importances from RFR, we found the Green Vegetation Moisture Index (GVMI) to consistently outperform all other indices, including two meteorological covariates measured from flux tower sites: air temperature and shortwave radiation. Grouping the VIs into five categories (moisture and water, greenness and productivity, structure and soil, pigments, and burn), we found that moisture and water indices consistently scored higher in feature importance than all other categories combined.
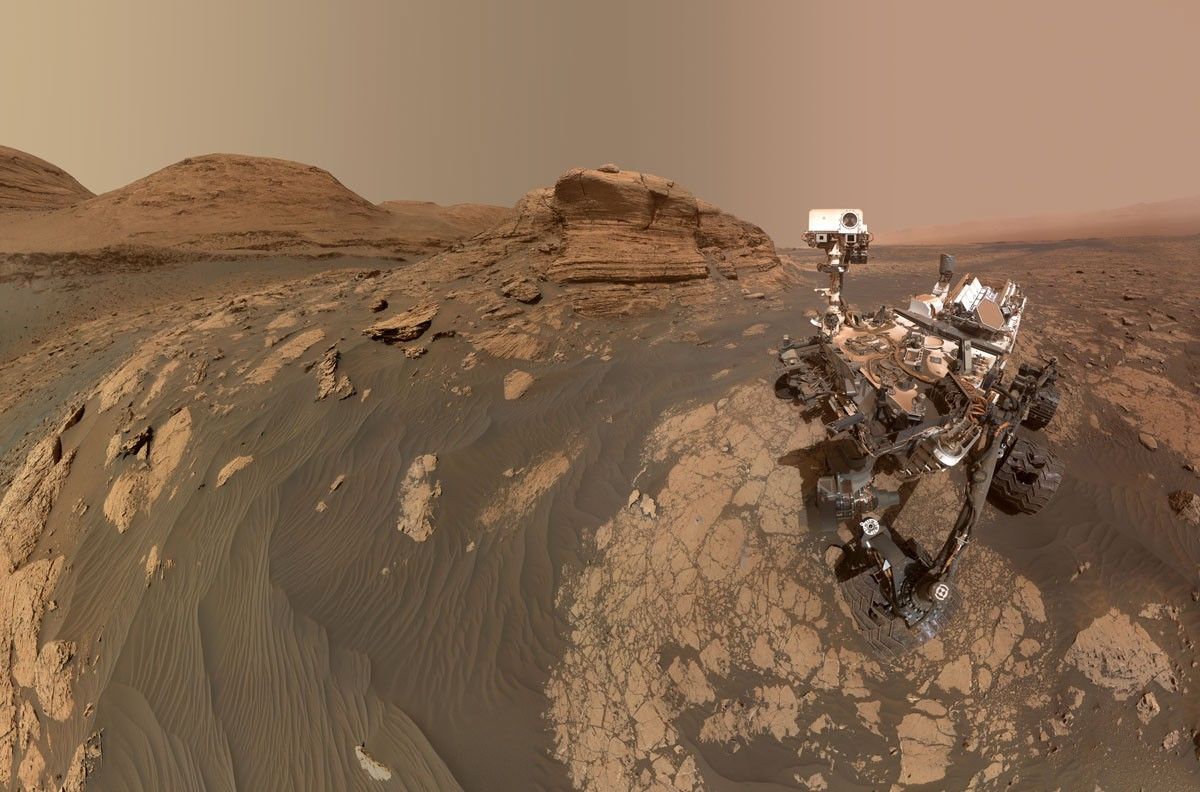
Curiosity Blog, Sols 4716-4722: Drilling Success at Nevado Sajama
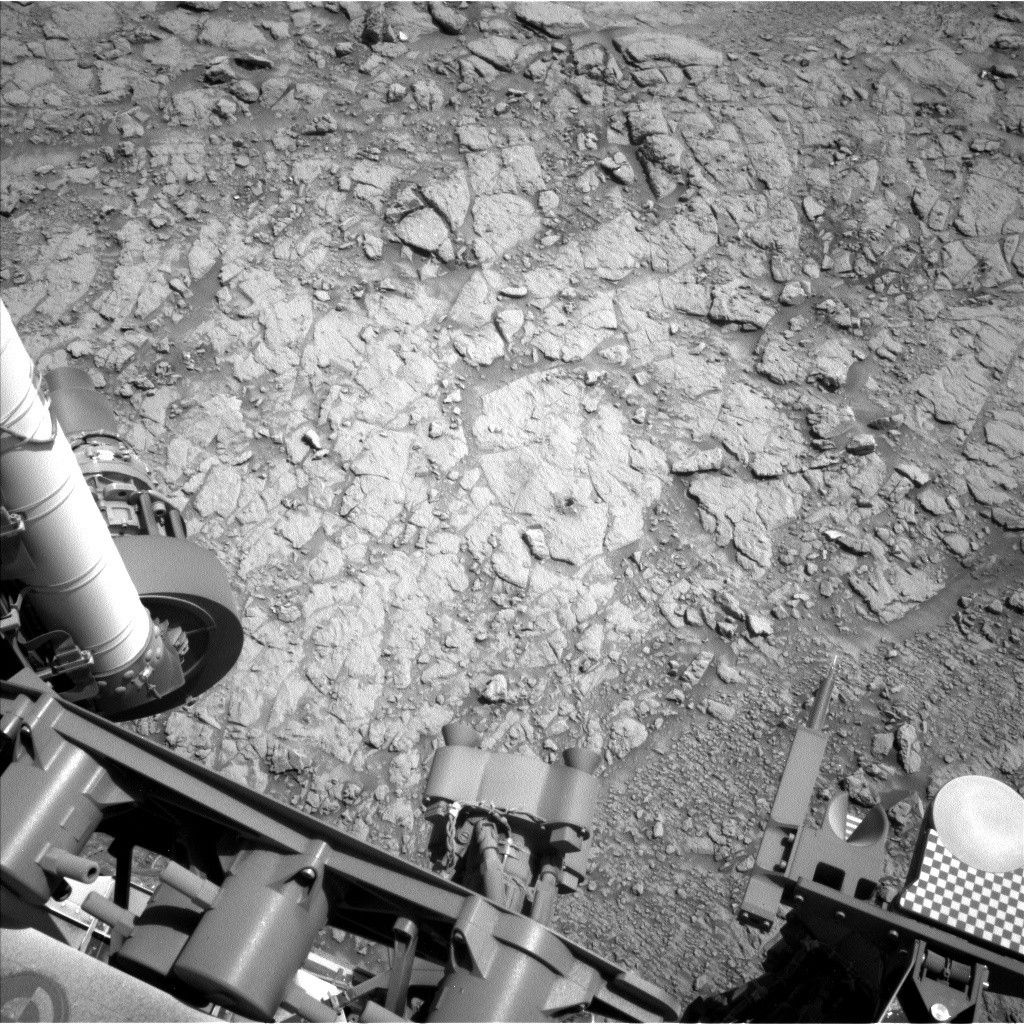
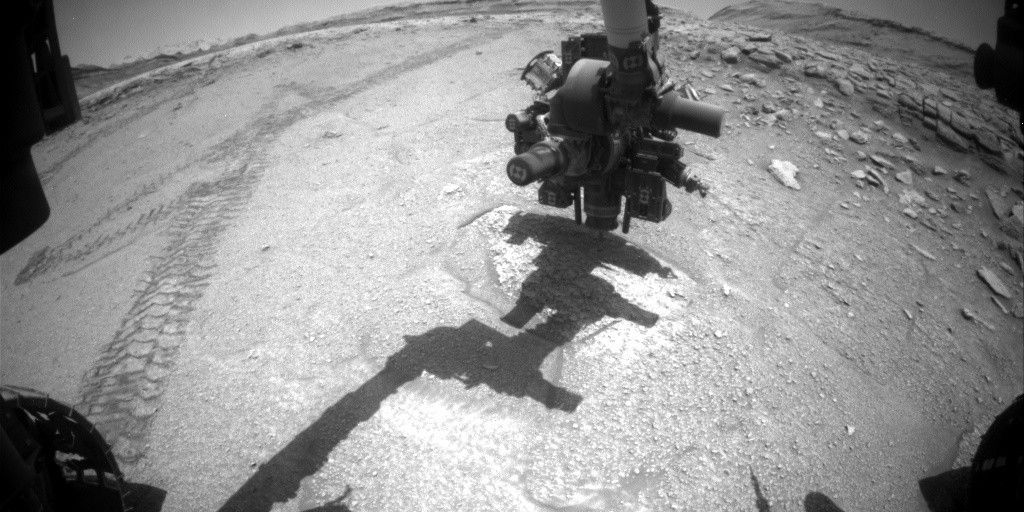
NASA’s Mars rover Curiosity acquired this image of the “Nevado Sajama” drill hole, using its Left Navigation Camera on Nov. 13, 2025 — Sol 4718, or Martian day 4,718 of the Mars Science Laboratory mission — at 19:46:43 UTC.
NASA/JPL-Caltech
Written by Michelle Minitti, MAHLI Deputy Principal Investigator at Framework
Earth planning date: Friday, Nov. 14, 2025
From Curiosity’s ridge-top perch among the boxwork unit, the highlight of the week was the successful drilling of the “Nevado Sajama” target. The data collected by APXS, ChemCam, and MAHLI from the rover workspace and its immediate vicinity gave the team confidence to proceed with sampling. APXS and ChemCam data from two targets cleared by the DRT — Nevado Sajama (before it was drilled) and “Tesoro del Pangal” — demonstrated that the chemistry of the workspace was in family with the many ridge-top targets analyzed during the boxwork unit campaign. MAHLI imaging revealed the presence of fine veins in both targets, and also confirmed the structural soundness of the drill target after the rover engineers tested the strength of Nevado Sajama by pressing down on it with the drill tip. The types of veins observed by MAHLI were investigated by ChemCam on broken bedrock faces that exposed both bright white and gray materials. These targets, “Arenas Blancas,” “Camarones,” and “Exaltación,” will provide more insight into the fluids that penetrated the boxwork ridges, perhaps contributing to their erosion resistance. DAN collected data for long stretches across the sols over which all these activities occurred, gaining data on the hydrogen (and by extrapolation, water) content of the ridge. Mastcam began and will continue to build a large mosaic of our location which will include both Nevado Sajama and the drill target “Valle de la Luna” within an adjacent hollow.
The rover payload was not only focused on studying the ridge and drill target, but also added to the systematic environmental dataset Curiosity has built over the last 13 years. REMS and RAD regularly recorded Martian and space weather, respectively, throughout the week. Mastcam and Navcam measured dust loading in the atmosphere, and looked for clouds and dust devils while ChemCam and APXS took turns measuring different chemical components in the atmosphere.
The drill activity itself completed on Sol 4718. This weekend, the first portions of the drilled material will be delivered to and analyzed by CheMin. The whole team is anxiously awaiting the CheMin results in order to compare them to the Valle de la Luna mineralogy derived from the hollow below us. We hope their comparison will provide us with new insights into how the boxwork unit came to be.
Curiosity Blog, Sols 4709-4715: Drilling High and Low in the Boxwork Unit
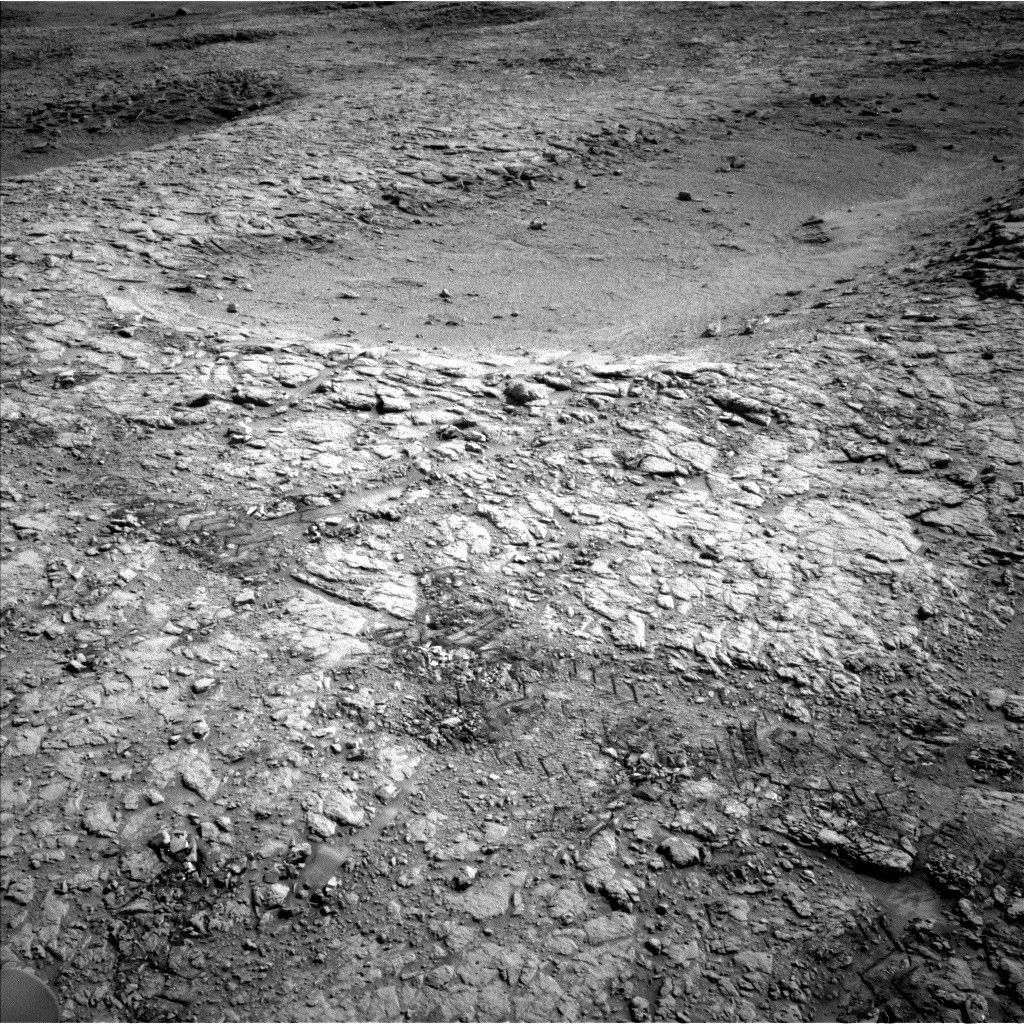
NASA’s Mars rover Curiosity acquired this image of the “Nevado Sajama” drill site workspace, which is on the patch of more coherent ridge bedrock in front of the hollow, towards the right-hand side of the image. Curiosity used its Left Navigation Camera on Nov. 4, 2025 — Sol 4709, or Martian day 4,709 of the Mars Science Laboratory mission — at 15:10:44 UTC.
NASA/JPL-Caltech
Written by Catherine O’Connell-Cooper, APXS Strategic Planner and Payload Uplink/Downlink Lead, University of New Brunswick, Canada
Earth planning date: Friday, Nov. 7, 2025
We are in the most intensive phase of the boxwork structures investigation — the drill campaign. The boxwork campaign group requested a pair of drilled targets — one in a hollow (the topographic low) and one on an adjacent ridge, surrounding the hollow.
As we noted in a previous blog, finding a drill target in the hollows proved to be tricky, as the hollow floors are often covered by sand and pebbles, with minimal bedrock exposed. But over the past two weeks, we successfully drilled the bedrock target “Valle de la Luna” in a large hollow called “Monte Grande.” We finished up at Valle de la Luna on Monday and moved quickly up onto the ridge to get our second target, about 10 meters away (about 33 feet).
We wanted to name our targets to reflect the difference in location — from the topographic low to the (relatively speaking) high point on the nearby ridge. Our hollow target, Valle de la Luna, was named after an area of valleys in the Atacama Desert, in Chile. This area is one of the driest on Earth, with a unique environment and an incredible sculpted landscape with geological formations that would not look out of place in Gale crater.
Although there is a mere 2-meter difference in elevation (about 6½ feet) between the hollow floor and the ridge top, we decided to name our ridge target “Nevado Sajama,” which is an extinct volcano and the highest peak in Bolivia. Go big or go home!
Wednesday’s plan centered around our “Drill Sol Zero” activities. We use this day to finesse our position for drilling with a small drive (we refer to this kind of positioning drive as a “bump” as it is usually less than a couple of meters, which is less than 6 feet) to the most suitable potential drill target. On Wednesday, we bumped our way forward very slightly on the workspace, and this morning (Friday) the best potential target for drilling was in the perfect location. Today we do our Drill Sol 1 activities, which focus on triaging the Nevado Sajama bedrock block for drilling (the center of this Mastcam image; the lower block in this Navcam image). The Rover Planners (RPs) will test the coherency of the rock, to assess how it will hold up under the pressure of drilling. APXS and ChemCam will analyze the brushed bedrock in the intended drill area. We can compare this to targets from the very nearby Wednesday workspace (“Volcan Isluga” for APXS and “Luna Muerte” for ChemCam), so we can determine how homogenous or heterogenous this area is. MAHLI will image the bedrock here too, and again compare to targets from the Wednesday workspace (Volcan Isluga and the MAHLI-only target “Sipe Sipe,” which was an area of freshly broken rock, broken as we drove over it).
The drill campaign for the boxwork area has been two years in the planning. Over those years, the boxwork campaign focus group (including me) have had regular meetings and presentations and brainstorming sessions. It is so rewarding to finally be here, in the middle of this active drill campaign.
Image credit: X-ray: NASA/CXC/SAO; Optical/IR: NASA/ESA/CSA/STScI (HST and JWST); Radio: NSF/NRAO/VLA; Image Processing: NASA/CXC/SAO/J. Schmidt and N. Wolk
NGC 1068, a relatively nearby spiral galaxy, appears in this image released on July 23, 2025. The galaxy contains a black hole at its center that is twice as massive as the Milky Way’s. NASA’s Chandra X-ray Observatory data shows a million-mile-per-hour wind is being driven from NGC 1068’s black hole and lighting up the center of the galaxy in X-rays.
Brian Alpert’s path was always destined for the aerospace industry, but his journey turned toward NASA’s Johnson Space Center during his sophomore year in college. That was when Tricia Mack, who works in NASA’s Transportation Integration Office within the International Space Station Program, spoke to his aerospace seminar about planning spacewalks, training crews, and supporting operations from the Mission Control Center in Houston.
Alpert was inspired to join the agency and later earned a spot as an engineering co-op student at Johnson. “My first stop after new employee orientation was Tricia’s office,” he said.
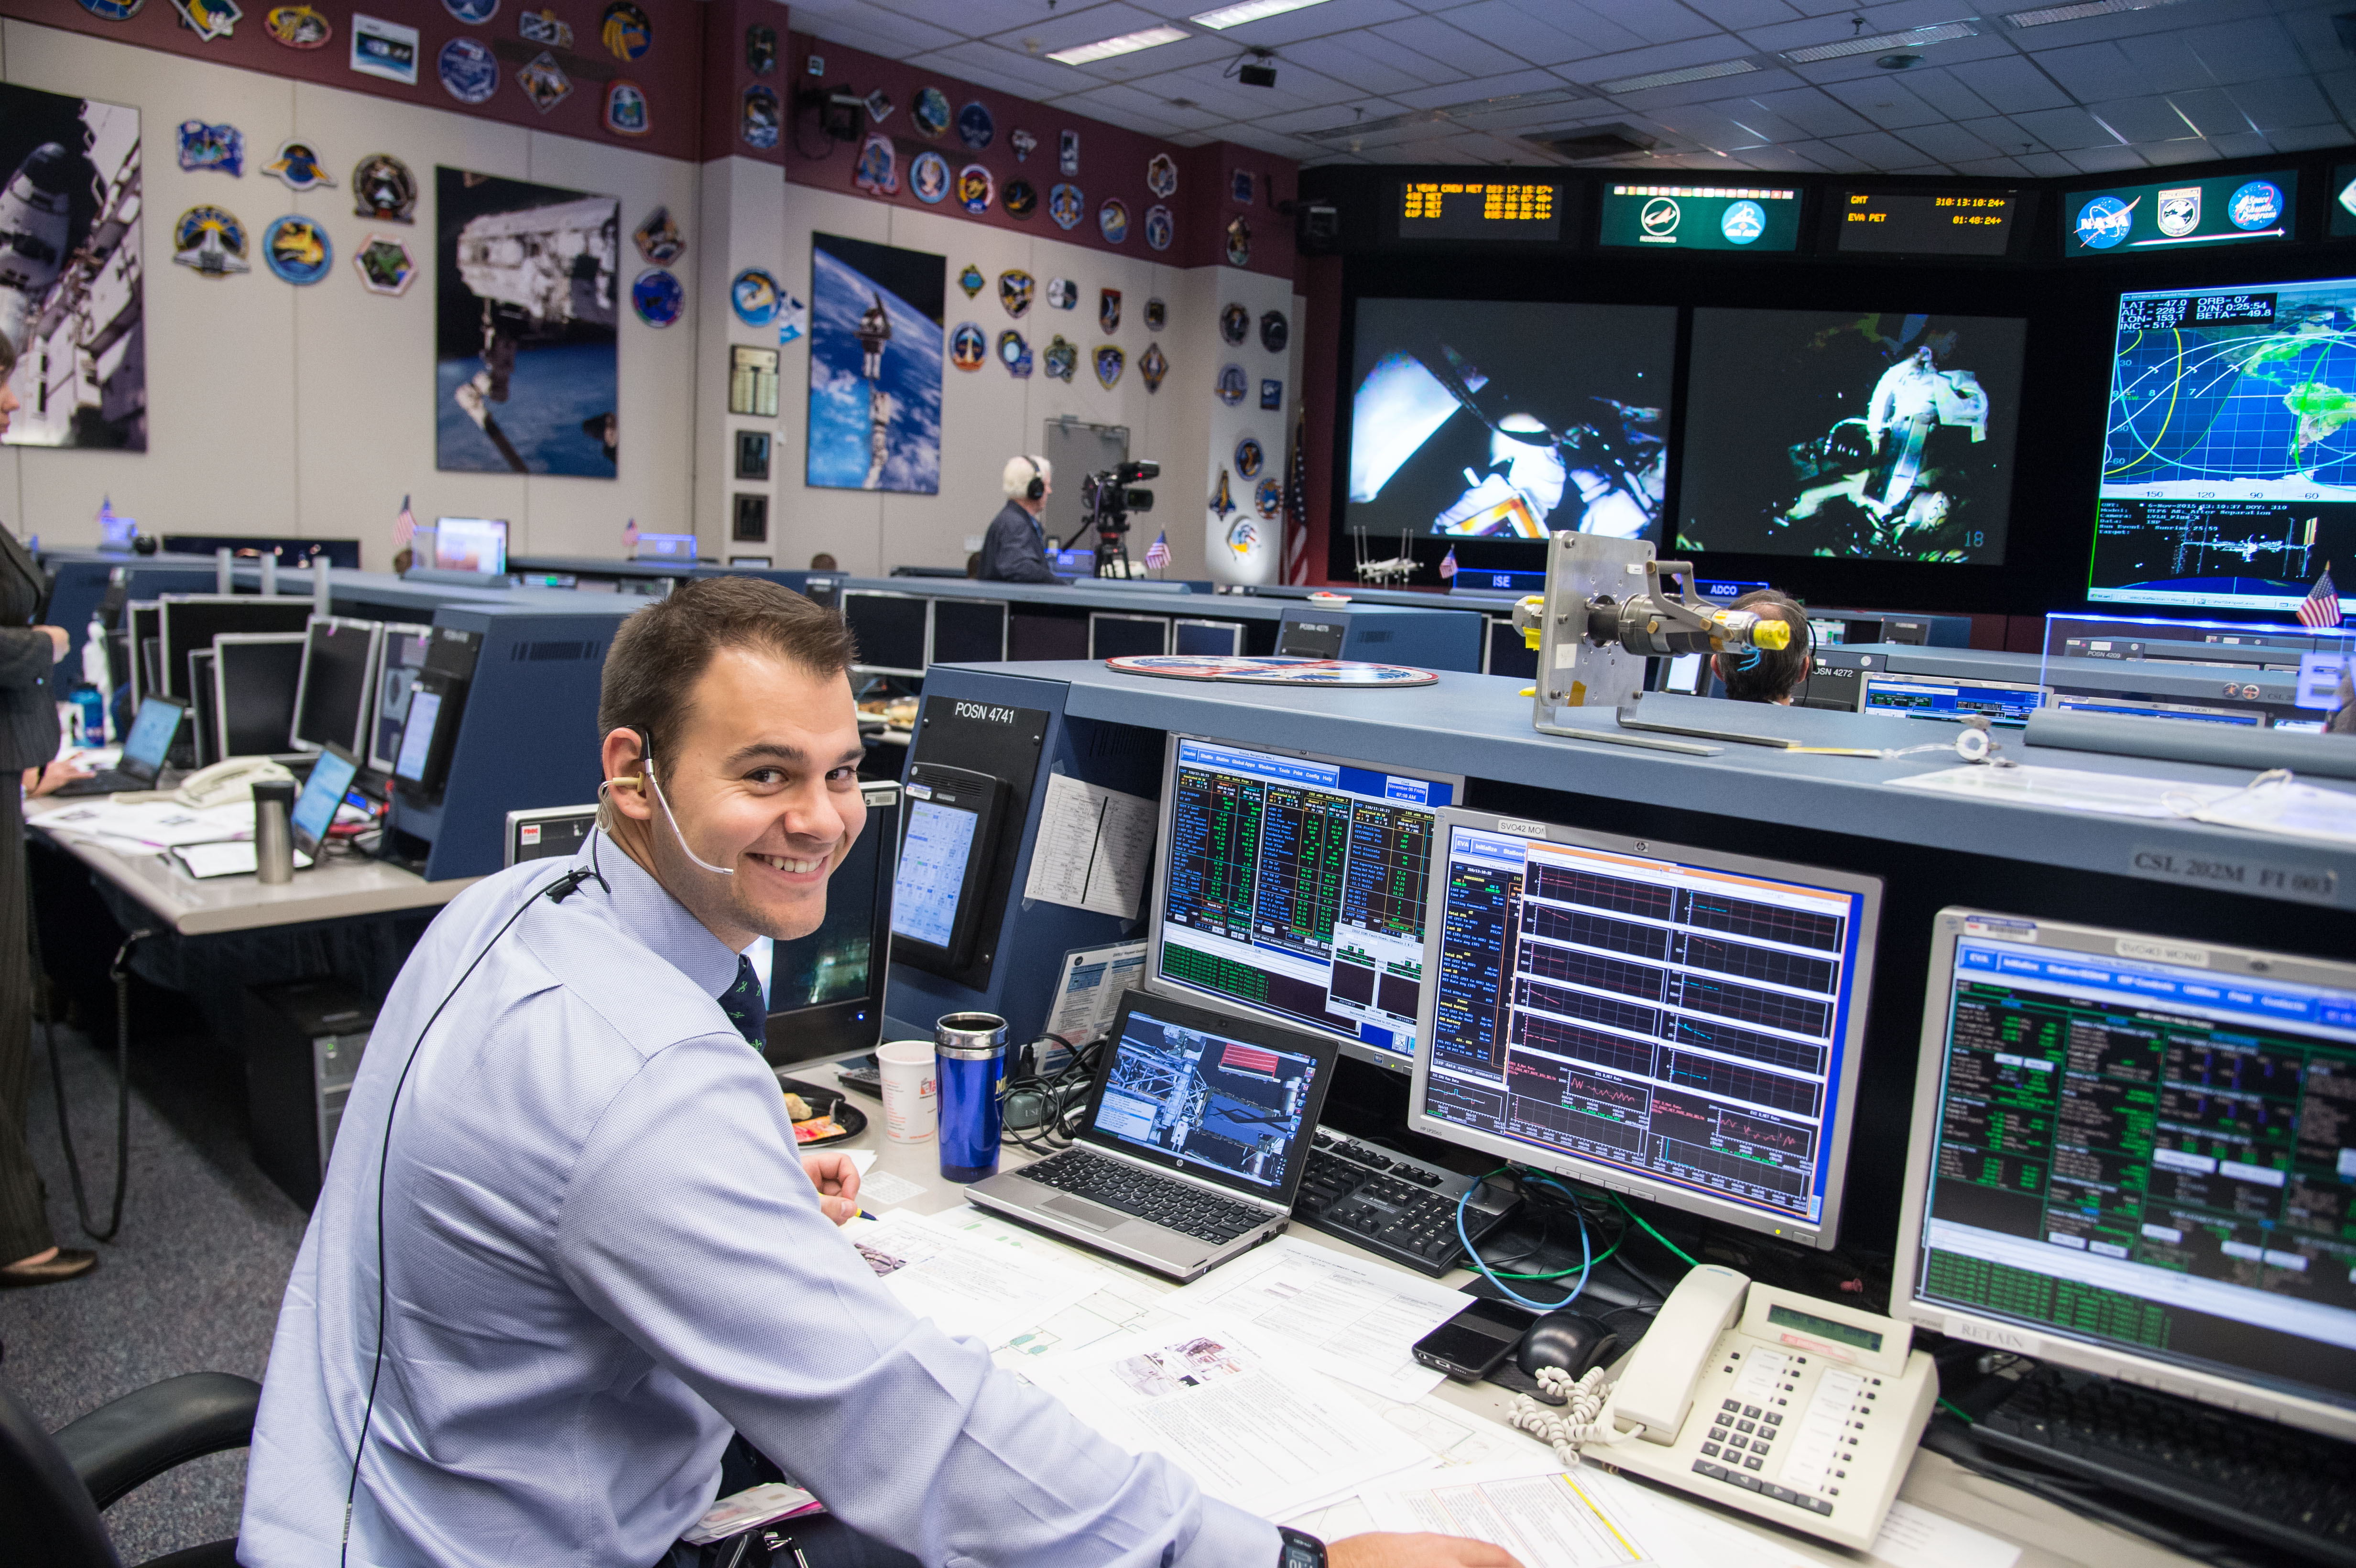
Brian Alpert supports a spacewalk outside of the International Space Station from the Mission Control Center at Johnson Space Center in 2015.
NASA/Bill Stafford
Eighteen years later, Alpert is the cross-program integration deputy for NASA’s human landing system (HLS) – the mode of transportation that will take astronauts to the lunar surface as part of the Artemis campaign. In his role, Alpert is responsible for coordinating with other Artemis programs, like the Orion Program, on issue resolution, joint agreements, data exchanges, hardware integration, and reviews. He also co-leads the Exploration Atmospheres Issue Resolution Team, assessing risks to and impacts on space vehicle atmosphere, spacesuit pressure, and operational timelines for Artemis missions.
Alpert has enjoyed the opportunity to participate in several proposal reviews for Artemis program contracts as well. “NASA’s model of embracing public-private partnerships to achieve its strategic goals and objectives is exciting and will continue to expand opportunities in space,” he said.
He applies lessons learned and skills gained from his previous roles as a spacewalk crew instructor, flight controller, and systems engineer to his current work on HLS. “I hope to pass on to the next generation that skills and lessons you learn as a student or a young employee can and will help you in your future work,” he said.
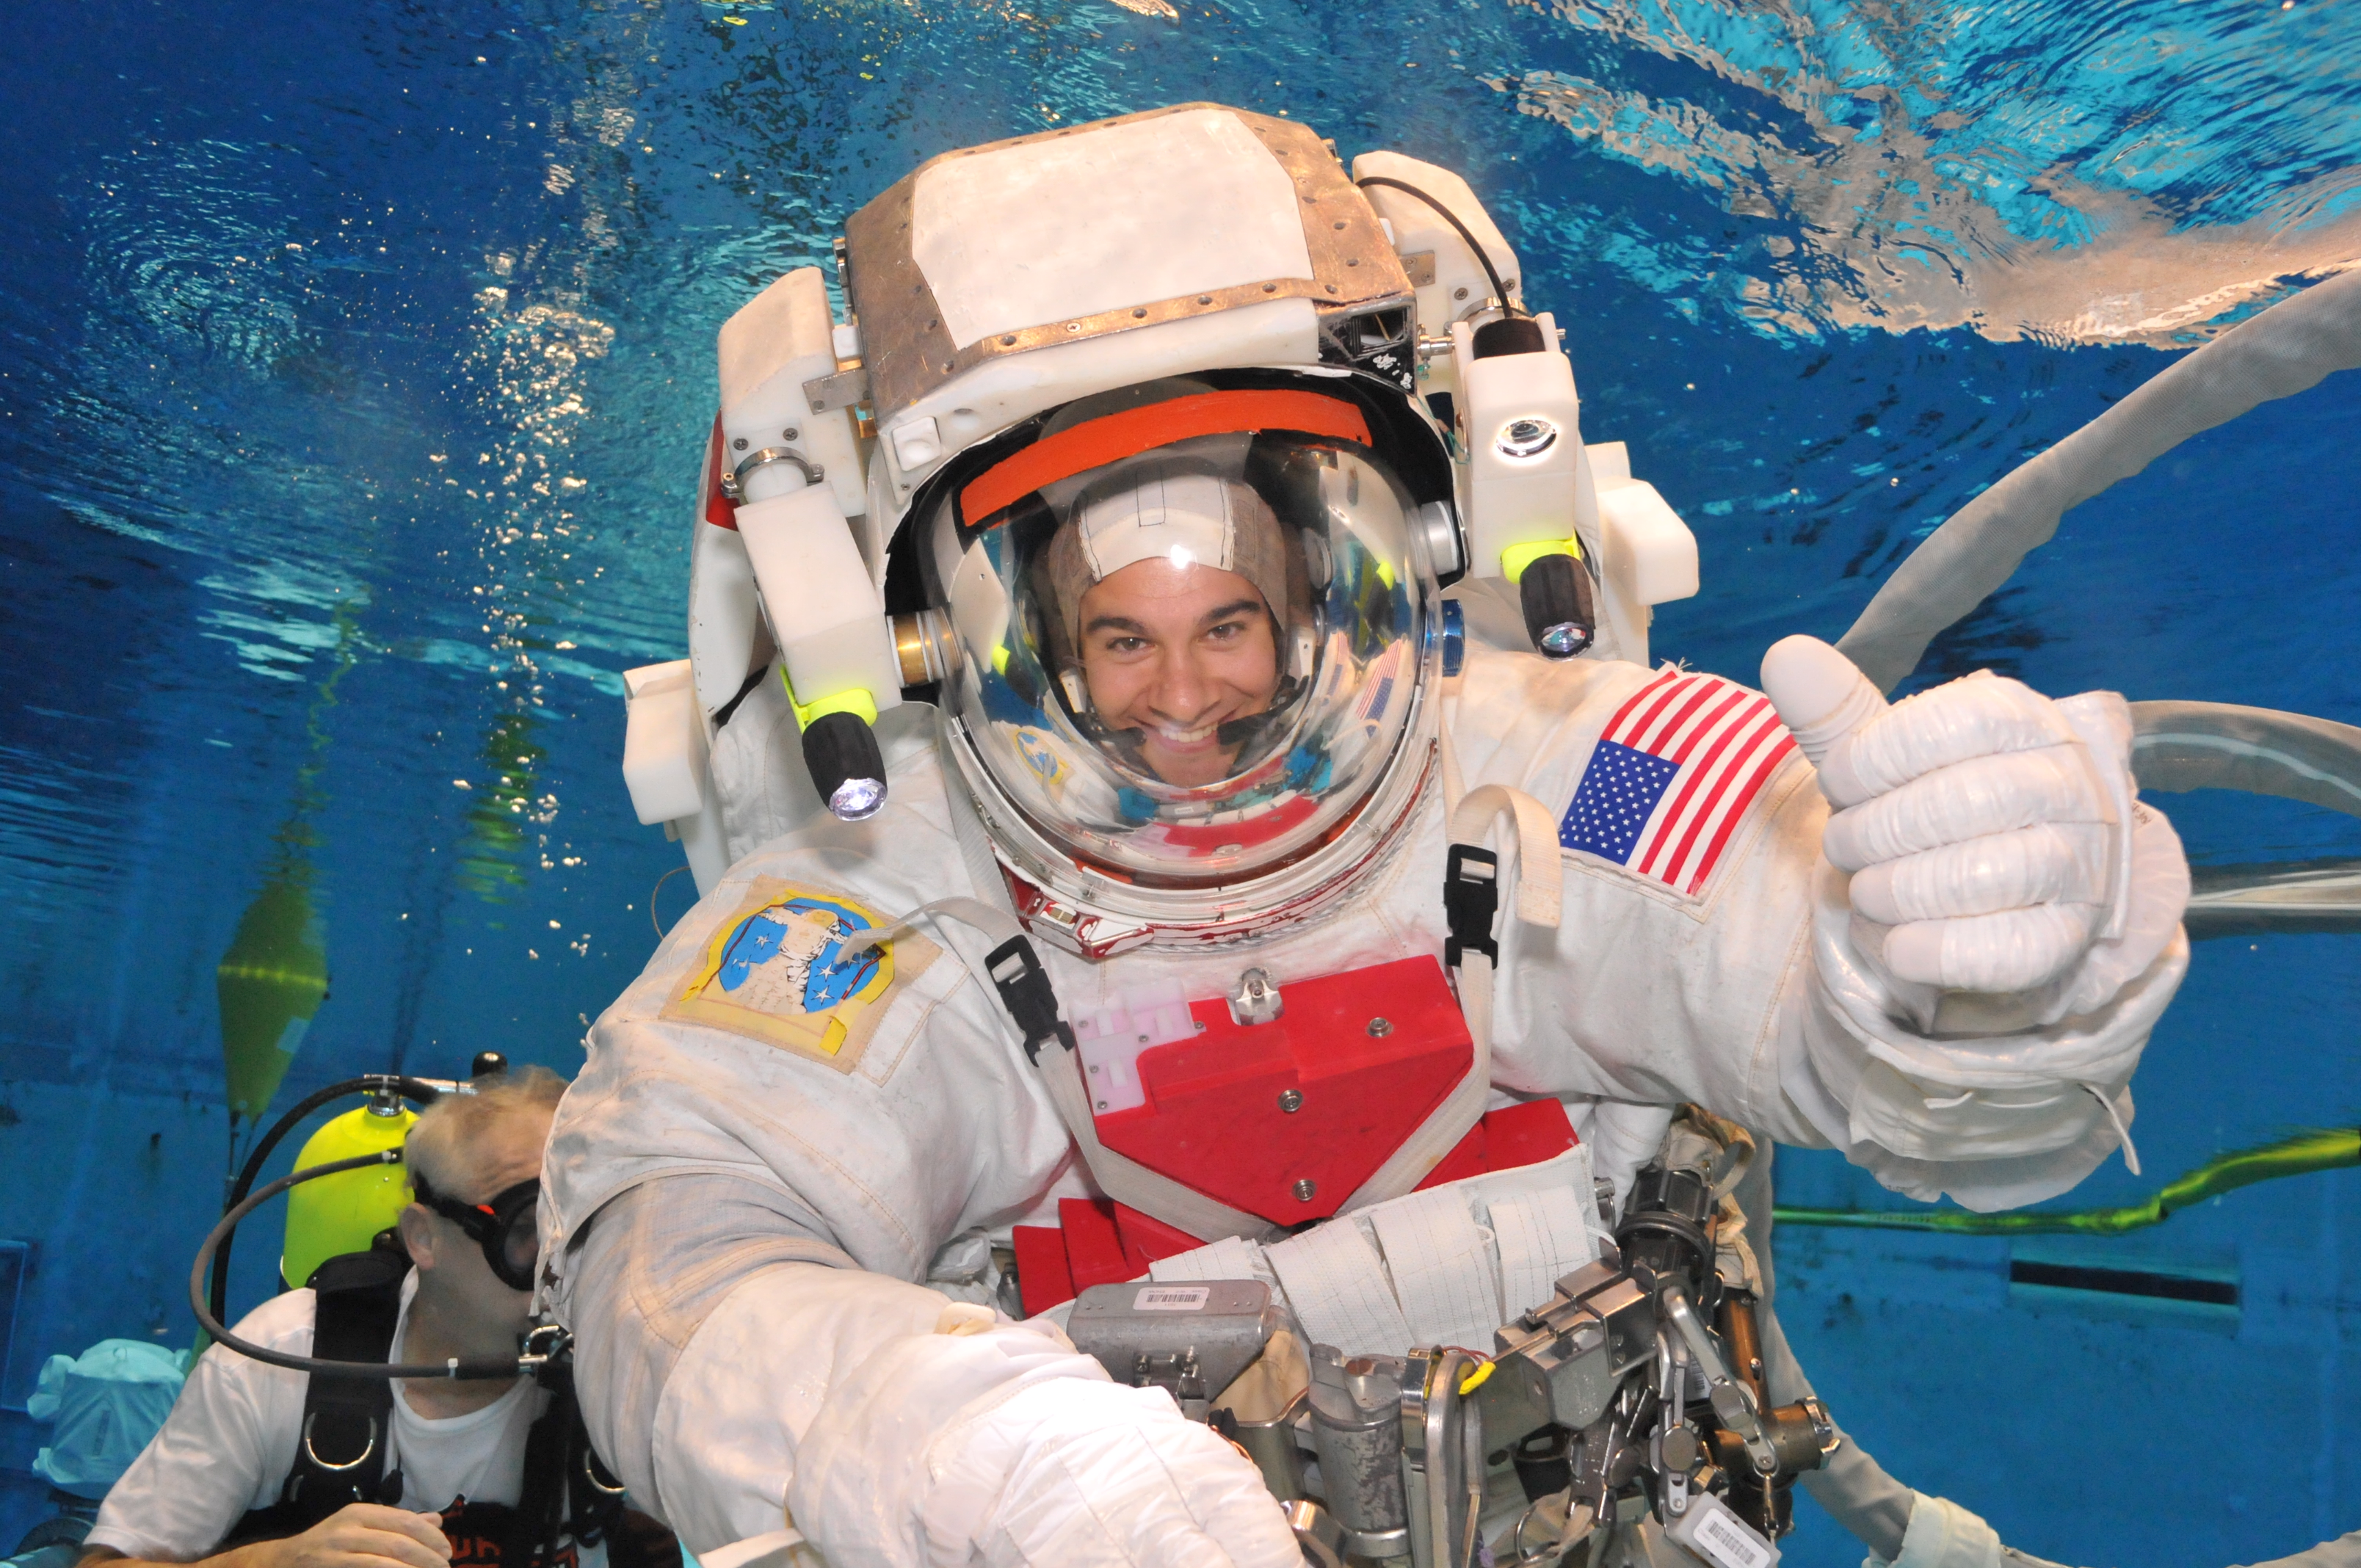
Brian Alpert routes cables in the Johnson Space Center’s Neutral Buoyancy Laboratory in preparation for a crew training run in 2011.
Image courtesy of Brian Alpert
Alpert’s prior NASA roles involved memorable experiences like working to address spacesuit and vehicle failures that occurred during a spacewalk on International Space Station Expedition 32. He was serving as the lead spacewalk systems flight controller in the Mission Control Center at the time and played a key role in getting NASA astronaut Suni Williams and JAXA (Japan Aerospace Exploration Agency) astronaut Aki Hoshide safely back aboard the space station. Since Williams and Hoshide did not complete the spacewalk’s primary objective – replacing a Main Bus Switching Unit – a backup spacewalk was scheduled several days later. Alpert was on console for that spacewalk, too.
“One important lesson that I have learned through my career to date is how exceptionally talented, passionate, and hard-working everyone is here at NASA,” he said. “Whenever work gets stressful or problems get hard, there are teams of people that have your back, are willing to problem-solve with you, and can bring another perspective to finding a solution that you may not have considered.” He added that his colleagues are the best part of his job. “As much as I love what we do at NASA, what really gets me excited to come to work is all the outstanding people I get to work with every day.”
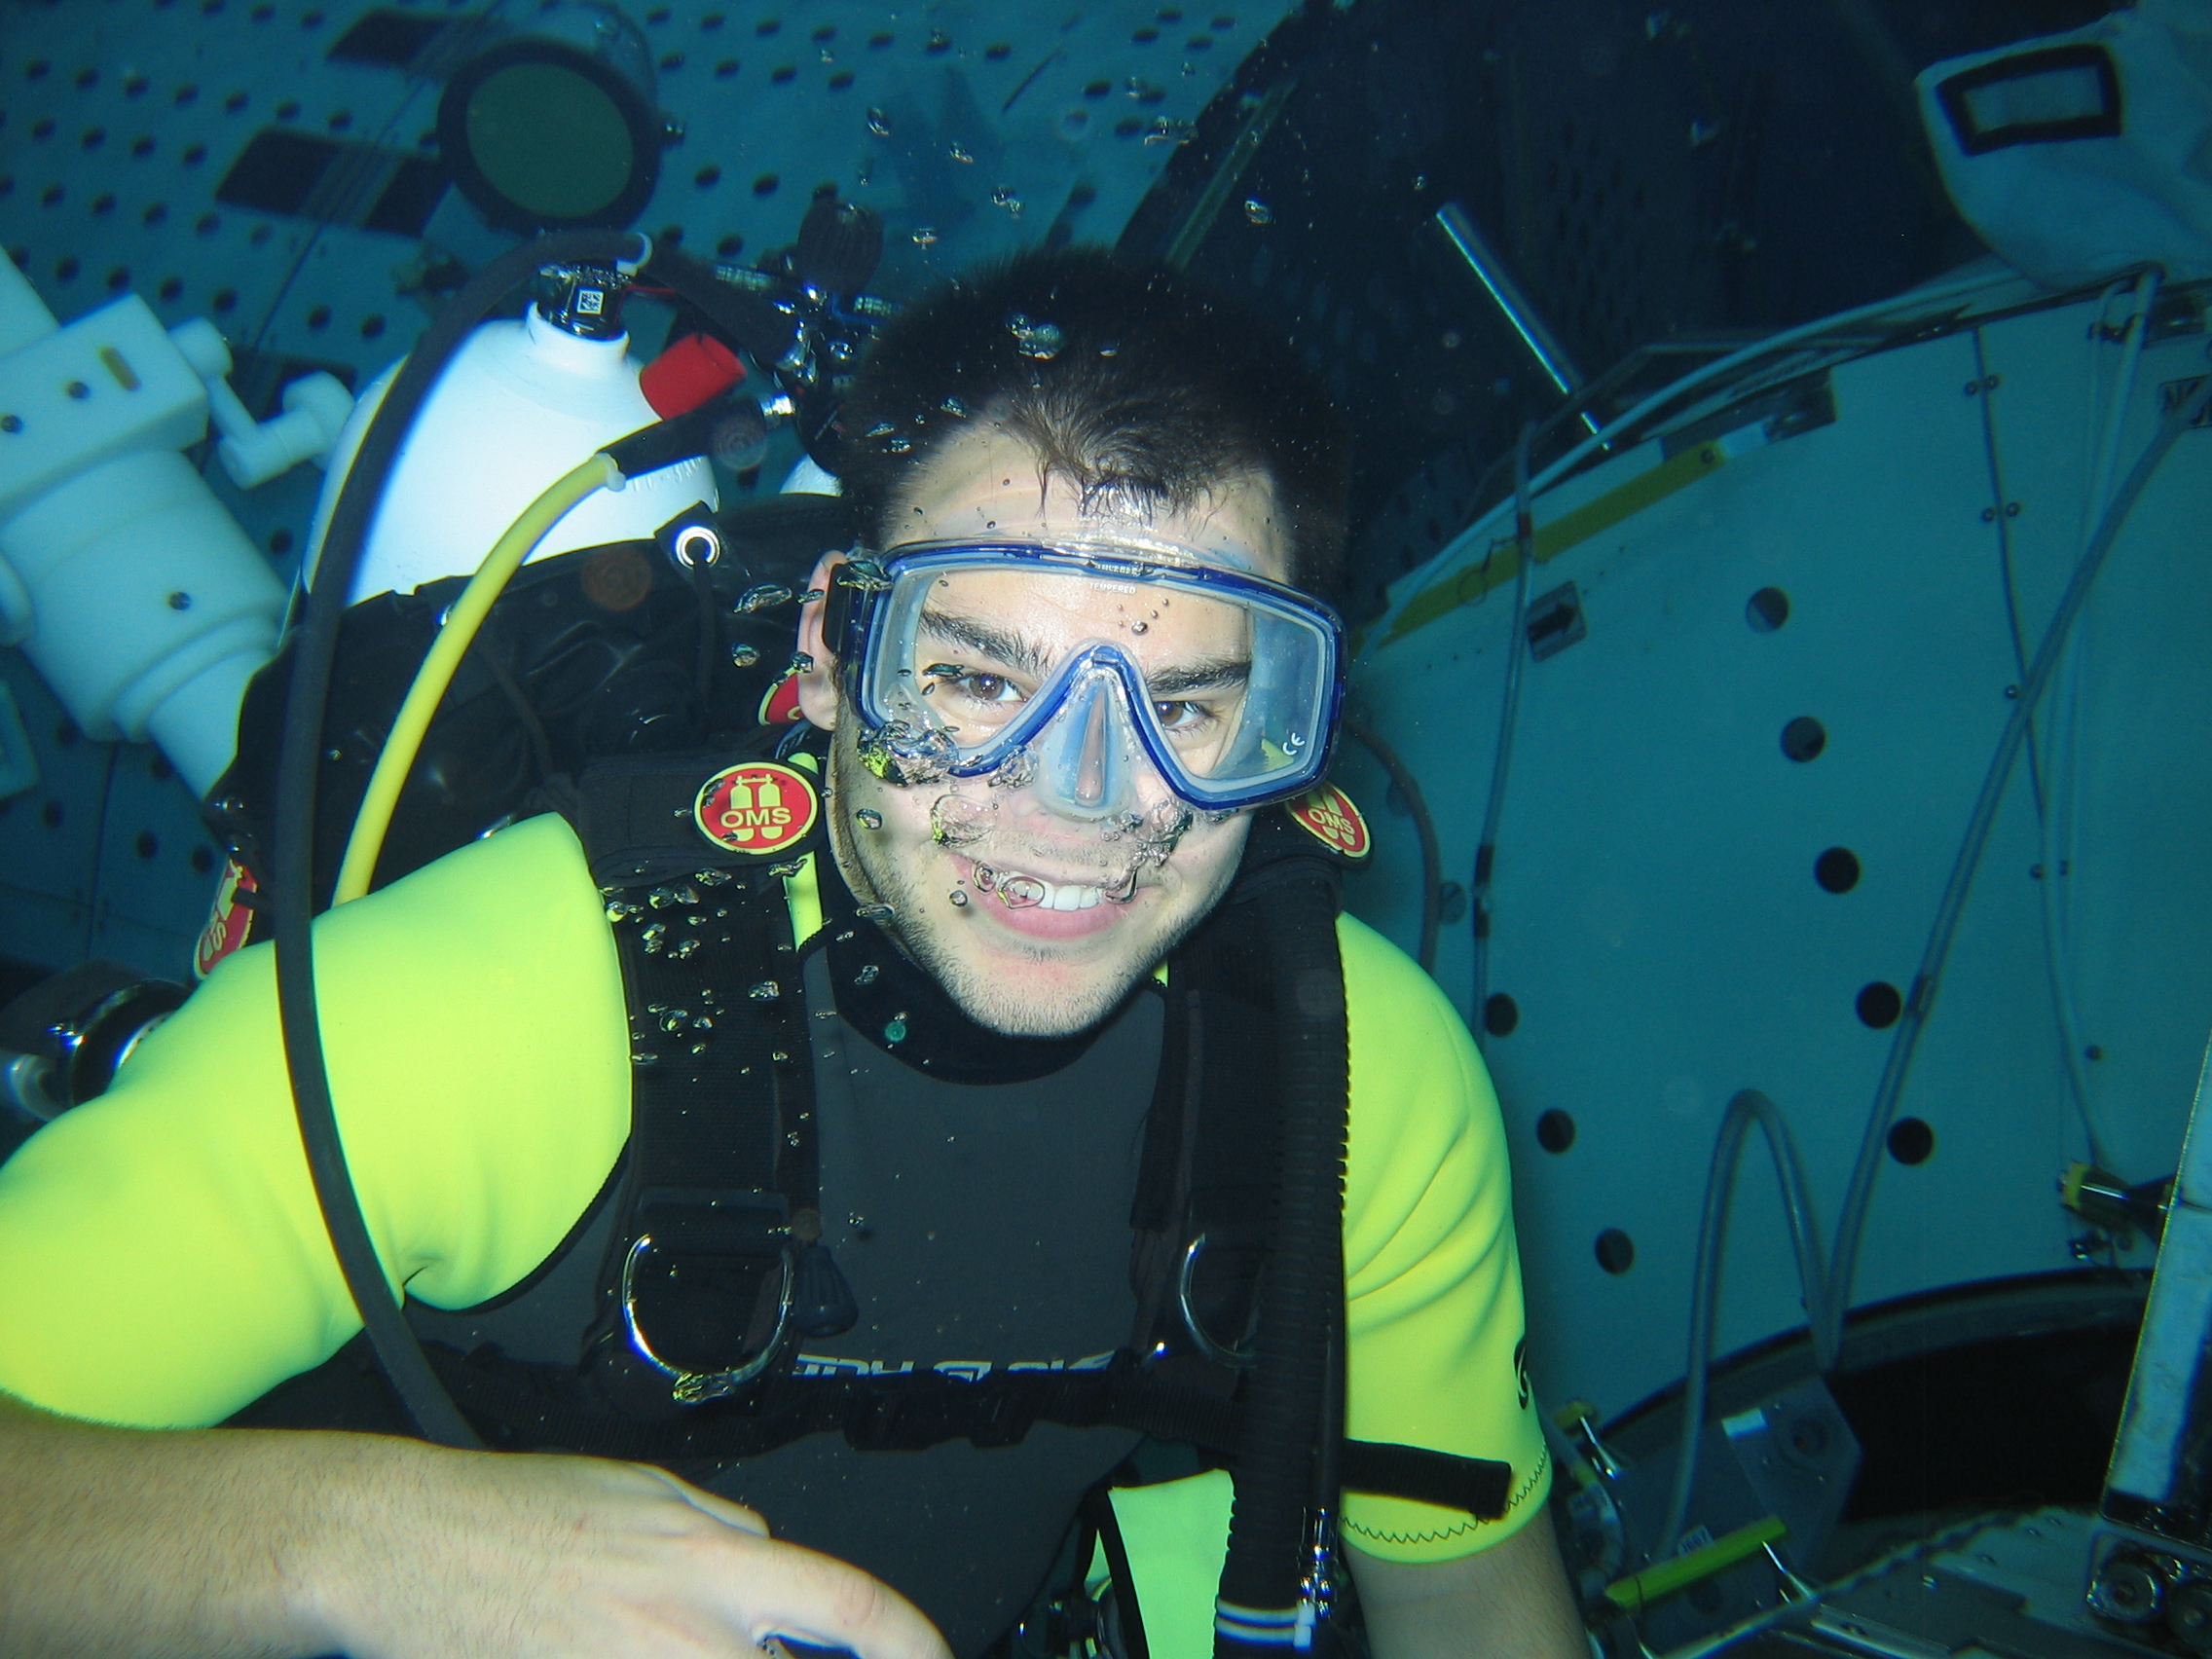
Brian Alpert completes a dive in NASA Johnson Space Center’s Neutral Buoyancy Laboratory for a spacesuit familiarization exercise in 2009.
Image courtesy of Brian Alpert
Learning how to navigate change has been an important lesson for Alpert, as well. “NASA has been through a lot of change since I became a full-time employee in 2009,” he said. “Making sure that I have clear goals for myself, my work, and my team helps us all stay focused on the mission and the work at hand and helps us prioritize projects and tasks as questions or challenges inevitably arise.”
One challenge Alpert especially enjoys? Johnson’s annual Chili Cookoff. He has participated in many cookoffs as part of the Cosmic Chili team, noting that he often dons a Wolverine costume as part of the festive fun. He also welcomes a space trivia challenge – and a chance to add to his collection of trivia trophies.
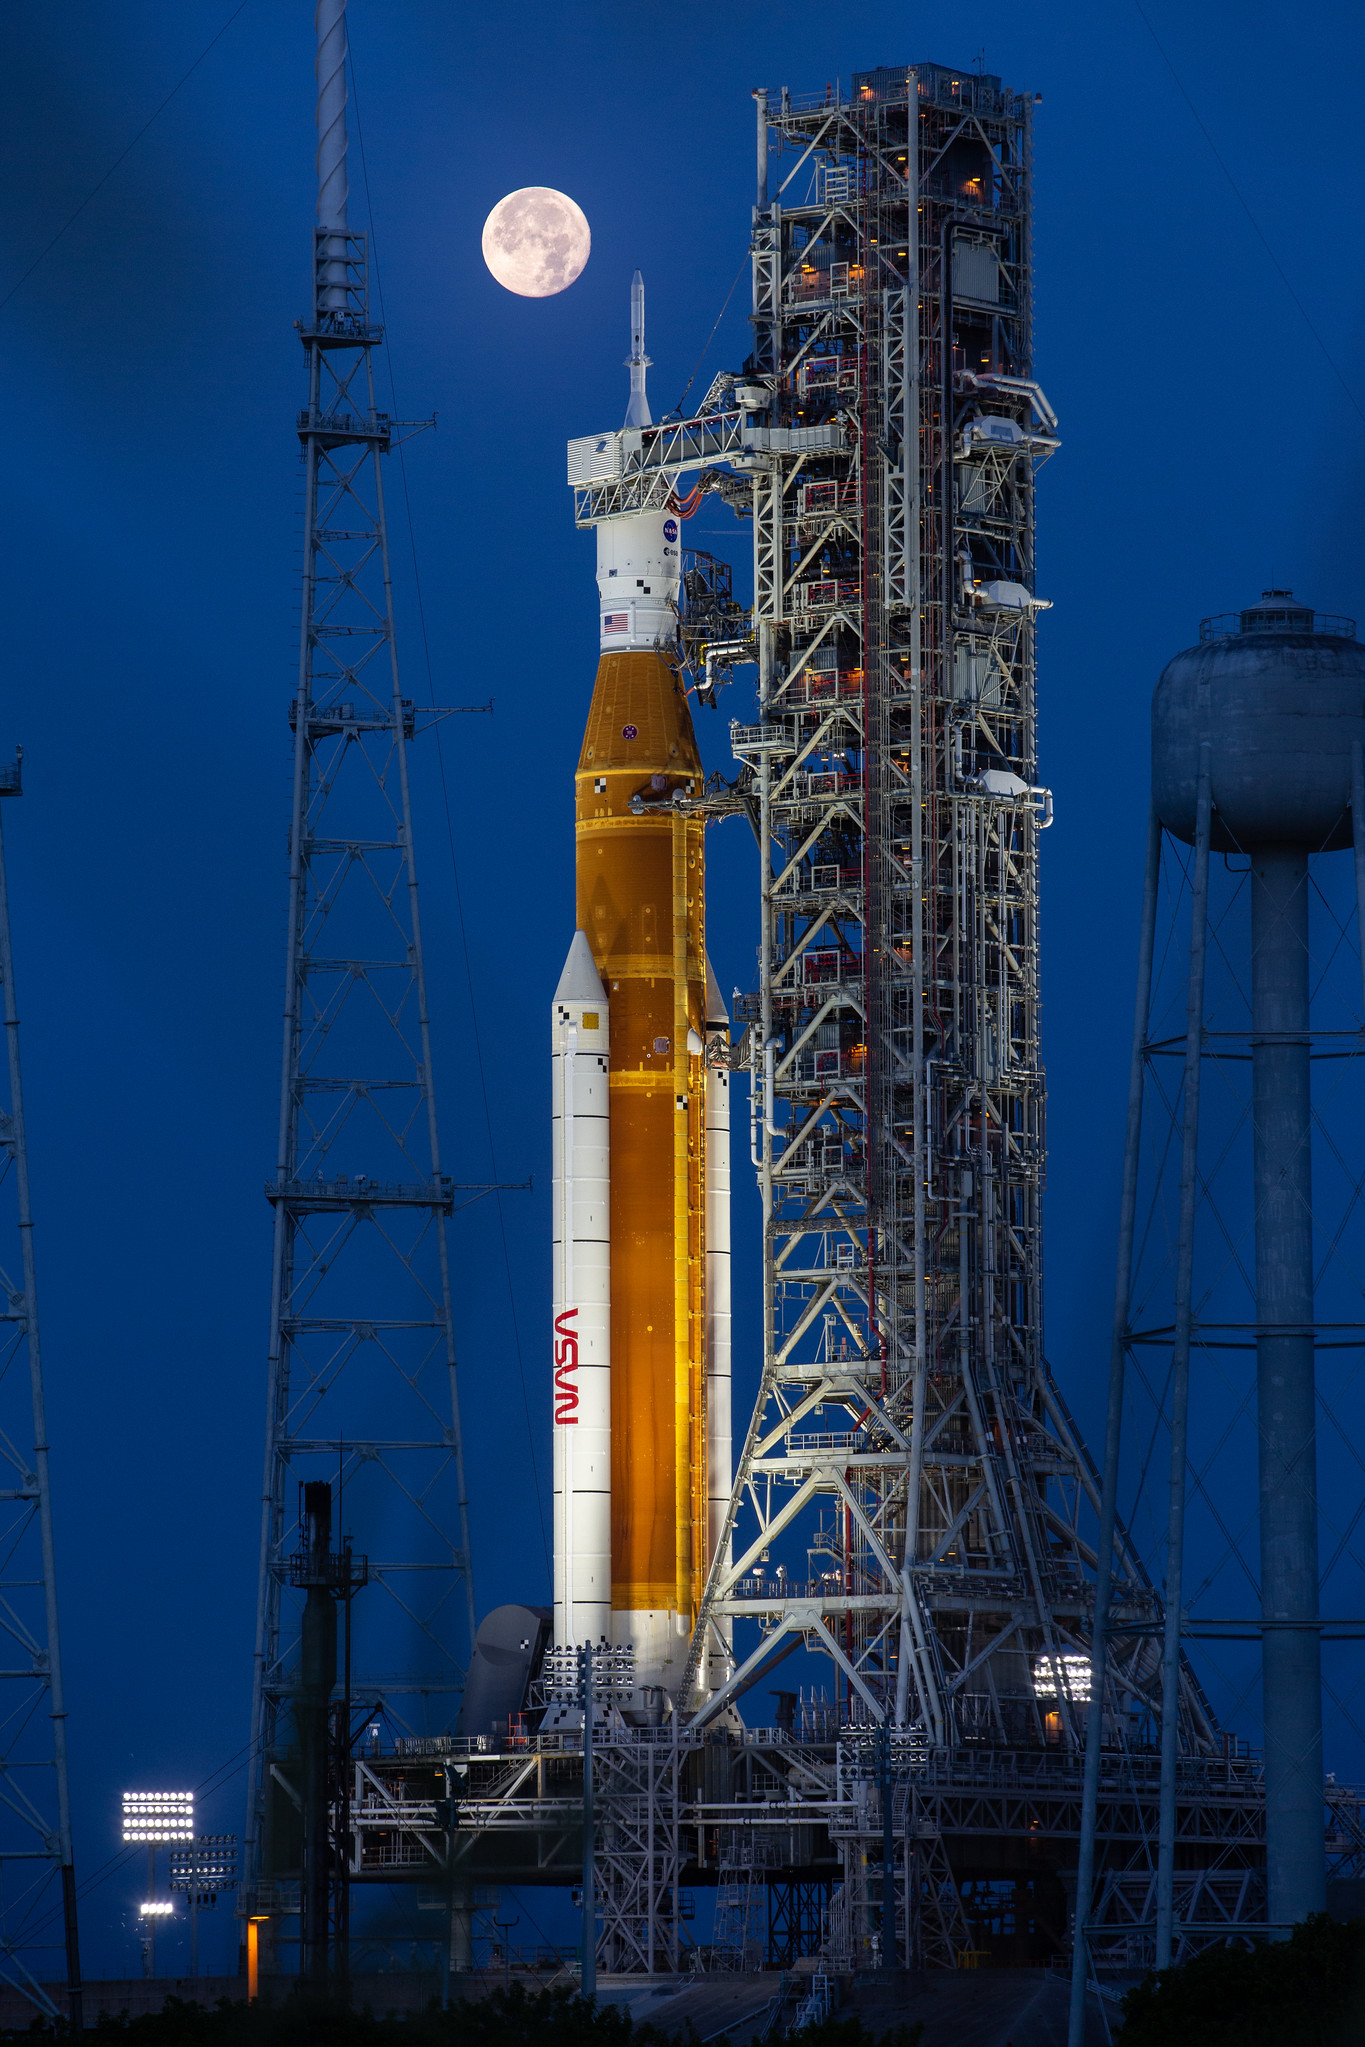
El cohete SLS (Sistema de Lanzamiento Espacial) y la nave espacial Orion de la misión Artemis I, en la plataforma móvil de lanzamiento en el Centro Espacial Kennedy de la NASA en Florida, con la luna llena al fondo. Imagen tomada el 14 de junio de 2022.
Ya está abierto el plazo de acreditación de medios de comunicación para el lanzamiento de la primera misión lunar tripulada de la campaña Artemis de la NASA.
Con un lanzamiento previsto para principios de 2026, el vuelo de prueba Artemis II enviará a los astronautas de la NASA Reid Wiseman, Victor Glover y Christina Koch y al astronauta de la CSA (Agencia Espacial Canadiense) Jeremy Hansen en un viaje de aproximadamente 10 días alrededor de la Luna y de regreso.
La tripulación despegará desde el Centro Espacial Kennedy de la agencia en Florida, a bordo de la nave espacial Orion de la NASA, transportada por el poderoso cohete Sistema de Lanzamiento Espacial (SLS, por sus siglas en inglés) de la agencia, con el fin de ayudar a validar los sistemas y el hardware necesarios para la exploración humana del espacio profundo.
Los miembros de los medios que no dispongan de ciudadanía estadounidense deben solicitar el acceso para ver el lanzamiento antes del domingo 30 de noviembre. Los miembros de medios con ciudadanía estadounidense deben solicitarlo antes del lunes 8 de diciembre. Los periodistas que ya dispongan de acreditaciones anuales para el centro Kennedy de la NASA también deben solicitar acceso para este lanzamiento. Aquellos que estén acreditados para asistir al despegue de Artemis II recibirán también acreditación para asistir a eventos previos al lanzamiento, incluyendo la presentación del cohete y la nave espacial integrados, un evento que se dará varias semanas antes del despegue. Más adelante proporcionaremos detalles adicionales sobre las fechas del lanzamiento.
Los medios de comunicación pueden enviar sus solicitudes de acreditación en línea, en:
Debido al gran interés suscitado, la disponibilidad de plazas para asistir a las actividades del lanzamiento es limitada. Los medios acreditados recibirán un correo electrónico de confirmación tras la aprobación, junto con información adicional sobre las actividades previas al lanzamiento y actividades del lanzamiento. La política de acreditación de medios de la NASA está disponible en línea (en inglés). Si tiene alguna pregunta sobre la acreditación, envíe un correo electrónico en inglés a: ksc-media-accreditat@mail.nasa.gov. Para otras preguntas, póngase en contacto con la sala de prensa del centro Kennedy de la NASA a través del número: +1 321-867-2468.
Como parte de una edad dorada de innovación y exploración, Artemis allanará el camino para nuevas misiones tripuladas estadounidenses en la superficie lunar, en preparación para la primera misión tripulada a Marte.
Para obtener más información (en inglés) sobre la misión Artemis II, visite:
The Artemis I SLS (Space Launch System) rocket and Orion spacecraft atop the mobile launcher at NASA’s Kennedy Space Center in Florida with a full Moon in the background on June 14, 2022.
Media accreditation is open for the launch of the first crewed Moon mission under NASA’s Artemis campaign.
Targeted to launch in early 2026, the Artemis II test flight will send NASA astronauts Reid Wiseman, Victor Glover, Christina Koch, and CSA (Canadian Space Agency) astronaut Jeremy Hansen on an approximately 10-day journey around the Moon and back.
The crew will lift off from the agency’s Kennedy Space Center in Florida inside NASA’s Orion spacecraft on the agency’s powerful (SLS) Space Launch System rocket to help confirm the systems and hardware needed for human deep space exploration.
International media without U.S. citizenship must apply to view the launch by Sunday, Nov. 30. U.S. media must apply by Monday, Dec. 8. Journalists who already have annual badges to NASA Kennedy also must apply. Those who are accredited to attend the Artemis II launch also will be accredited to attend pre-launch events, including rollout of the integrated rocket and spacecraft several weeks before launch. Additional details about launch dates will be provided later.
Media may submit accreditation requests online at:
Due to high interest, space is limited to attend launch activities. Credentialed media will receive a confirmation email upon approval, along with additional information about pre-launch and launch activities. NASA’s media accreditation policy is available online. For questions about accreditation, please email: ksc-media-accreditat@mail.nasa.gov. For other questions, please contact the NASA Kennedy newsroom at: 321-867-2468.
As part of a Golden Age of innovation and exploration, Artemis will pave the way for new U.S.-crewed missions on the lunar surface in preparation toward the first crewed mission to Mars.
To learn more about the Artemis II mission, visit:
NASA ER-2 pilot Kirt Stallings waits inside the transport vehicle moments before boarding the airborne science aircraft at NASA’s Armstrong Flight Research Center in Edwards, California, on Thursday, Aug. 21, 2025. Outside the window, the aircraft is being readied for a high-altitude mission supporting the Geological Earth Mapping Experiment (GEMx), a multi-year NASA–U.S. Geological Survey campaign to map critical mineral resources across the Western United States. The GEMx team believes that undiscovered deposits of at least some of the 50 mineral commodities deemed essential to U.S. national security, to the tech industry, and to clean energy exist domestically, and modern mineral maps will support exploration by the private sector.
In 2025 alone, the ER-2 flew 36 science missions, collecting more than seven billion measurements over 200 flight hours, contributing to the largest airborne surface mineralogy dataset ever gathered in a single NASA campaign. For this mission, pilots flew at approximately 65,000 feet altitude, requiring them to wear specially designed pressure suits to safely operate in the thin atmosphere.
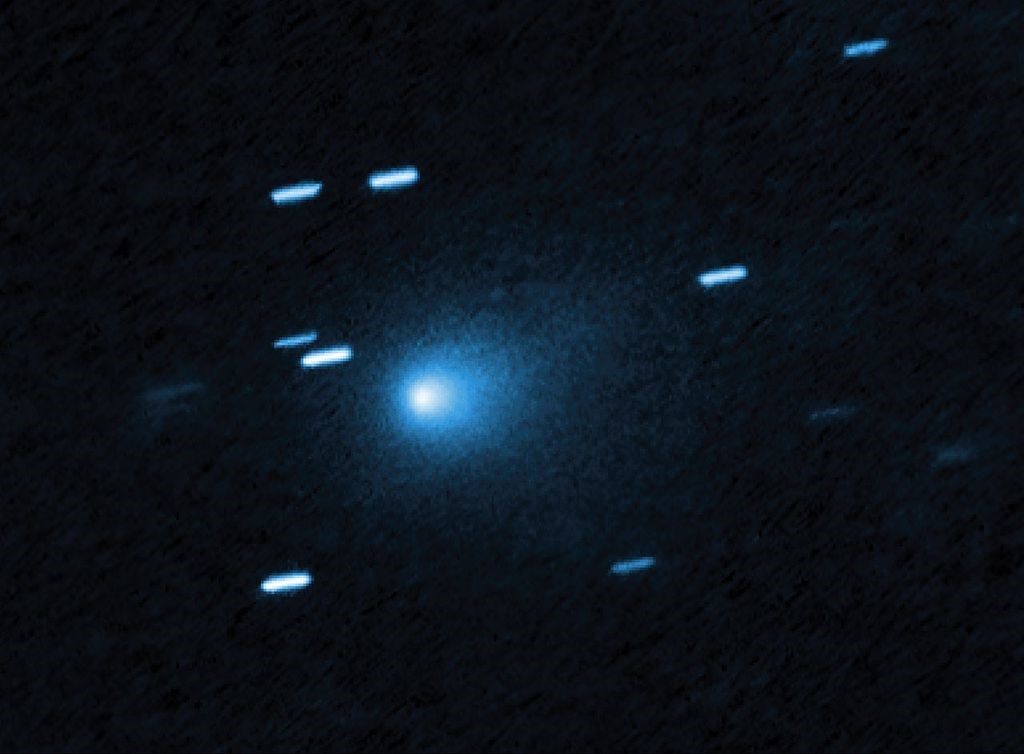
El telescopio espacial Hubble captó esta imagen del cometa interestelar 3I/ATLAS el 21 de julio de 2025, cuando el cometa se encontraba a 445 millones de kilómetros (277 millones de millas) de la Tierra. Hubble muestra que el cometa tiene una envoltura de polvo en forma de lágrima que se desprende de su núcleo sólido y helado.
Crédito: NASA, ESA, David Jewitt (UCLA); Procesamiento de imágenes: Joseph DePasquale (STScI)
La NASA ofrecerá un evento en vivo (en inglés) a las 3 p.m. EST del miércoles 19 de noviembre para compartir imágenes del cometa interestelar 3I/ATLAS captadas por varias misiones de la agencia. El evento tendrá lugar en el Centro de Vuelo Espacial Goddard de la NASA, en Greenbelt, Maryland.
El cometa 3I/ATLAS, descubierto el 1 de julio por el observatorio ATLAS (por las siglas en inglés de Sistema de Última Alerta de Impacto Terrestre de Asteroides), financiado por la NASA. El cometa es el tercer objeto identificado hasta la fecha que ha entrado en nuestro sistema solar procedente de otra parte de la galaxia. Aunque no supone ninguna amenaza para la Tierra y no se acercará a menos de 273 millones de kilómetros (170 millones de millas) de nuestro planeta, el cometa pasó a menos de 30 millones de kilómetros (19 millones de millas) de Marte a principios de octubre.
El evento se retransmitirá en NASA+, la aplicación de la NASA, el sitio web y el canal de YouTube de la agencia, y Amazon Prime.
Entre los participantes en la sesión informativa, que proceden de la sede central de la NASA en Washington, se encuentran:
Amit Kshatriya, administrador asociado de la NASA
Nicky Fox, administradora asociada, Dirección de Misiones Científicas
Shawn Domagal-Goldman, director interino, División de Astrofísica
Tom Statler, científico jefe para cuerpos pequeños del sistema solar.
Para participar virtualmente en el evento NASA Live, los miembros de los medios de comunicación deben enviar su nombre completo, afiliación mediática, dirección de correo electrónico y número de teléfono a más tardar dos horas antes del inicio del evento a Molly Wasser: molly.l.wasser@nasa.gov. Los miembros del público también podrán hacer preguntas utilizando #AskNASA en las redes sociales, y sus preguntas podrían ser respondidas, en inglés y en tiempo real, durante la transmisión. También contamos con un experto en la materia con disponibilidad limitada para entrevistas de seguimiento en español. Para solicitar una entrevista en español, póngase en contacto con María José Viñas: maria-jose.vinasgarcia@nasa.gov
Recursos de misiones científicas de la NASA proporcionan a Estados Unidos la capacidad única de observar a 3I/ATLAS prácticamente durante todo el tiempo que permanecerá en nuestra vecindad celeste y estudiar, con instrumentos científicos complementarios y desde diferentes direcciones, cómo se comporta el cometa. Estos instrumentos incluyen tanto naves espaciales en todo el sistema solar como observatorios terrestres.
Hubble captured this image of the interstellar comet 3I/ATLAS on July 21, 2025, when the comet was 277 million miles from Earth. Hubble shows that the comet has a teardrop-shaped cocoon of dust coming off its solid, icy nucleus.
Credit: NASA, ESA, David Jewitt (UCLA); Image Processing: Joseph DePasquale (STScI)
NASA will host a live event at 3 p.m. EST, Wednesday, Nov. 19, to share imagery of the interstellar comet 3I/ATLAS collected by a number of the agency’s missions. The event will take place at NASA’s Goddard Space Flight Center in Greenbelt, Maryland.
Comet 3I/ATLAS, discovered by the NASA-funded ATLAS (Asteroid Terrestrial-impact Last Alert System) observatory on July 1, is only the third object ever identified as entering our solar system from elsewhere in the galaxy. While it poses no threat to Earth and will get no closer than 170 million miles to Earth, the comet flew within 19 million miles of Mars in early October.
The event will air on NASA+, the NASA app, the agency’s website and YouTube channel, and Amazon Prime.
Tom Statler, lead scientist for solar system small bodies
To participate virtually in the NASA Live event, members of the media must send their full name, media affiliation, email address, and phone number no later than two hours before the start of the event to Molly Wasser at: molly.l.wasser@nasa.gov. Members of the public also may ask questions, which may be answered in real time during the broadcast, by using #AskNASA on social media.
Assets within NASA’s science missions give the United States the unique capability to observe 3I/ATLAS almost the entire time it passes through our celestial neighborhood, and study – with complementary scientific instruments and from different directions – how the comet behaves. These assets include both spacecraft across the solar system, as well as ground-based observatories.
Preparations for Next Moonwalk Simulations Underway (and Underwater)
NASA’s research into the field of Advanced Air Mobility looks to enable autonomous aircraft with complex capabilities such as carrying cargo or providing medical aid, as seen in this artist’s concept. The Data and Reasoning Fabric project out of Ames Research Center tested delivery of programs and information to these kinds of vehicles.
Credit: NASA
One of the biggest goals for companies in the field of artificial intelligence is developing “agentic” or autonomous systems. These metaphorical agents can perform tasks without a guiding human hand. This parallels the goals of the emerging urban air mobility industry, which hopes to bring autonomous flying vehicles to cities around the world. One company got a head start on doing both with some help from NASA.
Autonomy Association International Inc. (AAI) is a public benefit corporation based in Mountain View, California, near NASA’s Ames Research Center in Silicon Valley. In 2022, AAI signed a Space Act Agreement with Ames to support the agency’s Data and Reasoning Fabric project, which aimed to support the transportation of people and cargo to areas previously unserved or underserved by aviation, and to provide reliable, accurate, and current data for aeronautic decision-making.
“Inspiration to lean into data fabric to solve certain complexities came from our NASA partnership,” said AAI cofounder and the project’s industry principal investigator Greg Deeds. “Working on this project was a great experience. Working with NASA engineers and leaders gave us experience that we’ll carry forward in all of our products.”
Greg Deeds looks out the window of a helicopter flying over Arizona during a test of Autonomy Association International’s data fabric technology in collaboration with NASA. Through multiple evaluations above Phoenix, the testing proved the capabilities of the company’s Digital Infrastructure Platform.
Credit: Autonomy Association International Inc.
Similar to how clothing fabric is made of intertwined threads, a data fabric comprises intertwined data sources. While a data fabric built by a tech company may include data from a few different cloud service providers, NASA’s Data and Reasoning Fabric can also use information provided by local governments and other service providers. By viewing airspace as a large data fabric, an autonomous vehicle can take in data and requests from the cities and towns it flies over and prioritize responses between them.
Working with Ken Freeman, principal investigator of the project at Ames, AAI and NASA performed four testing adaptations of the data fabric technology in the air over Arizona. Using hardware and software developed by AAI, the flights tested advanced air mobility passenger flights and the use of a drone for rapid delivery of medical supplies from urban to rural areas and back, while sending new tasks to the aircraft in flight. A helicopter stood in for the drone and air taxi, flying over towns, universities, tribal lands, and the airspace around Phoenix Sky Harbor airport and obtaining data and programs given to it from different places.
“We’re focusing on the digital infrastructure building blocks of smart cities and regions of the future,” said Jennifer Deeds, chief operating officer and cofounder of AAI.
In the years since the original NASA project, the company has cultivated relationships and customers abroad, including companies in agriculture, real estate development, and industrial food production using its system to aggregate and manage data. Released in 2024, the company’s Digital Infrastructure Platform uses the same technology originally designed for the NASA flight test. A new, “agentic” version followed not long after, able to retrieve necessary AI programs with minimal interaction.
As AI unlocks innovation across American industries, NASA is equipping its commercial partners with the keys, using proven technology to generate breakthrough solutions.
Preparations for Next Moonwalk Simulations Underway (and Underwater)
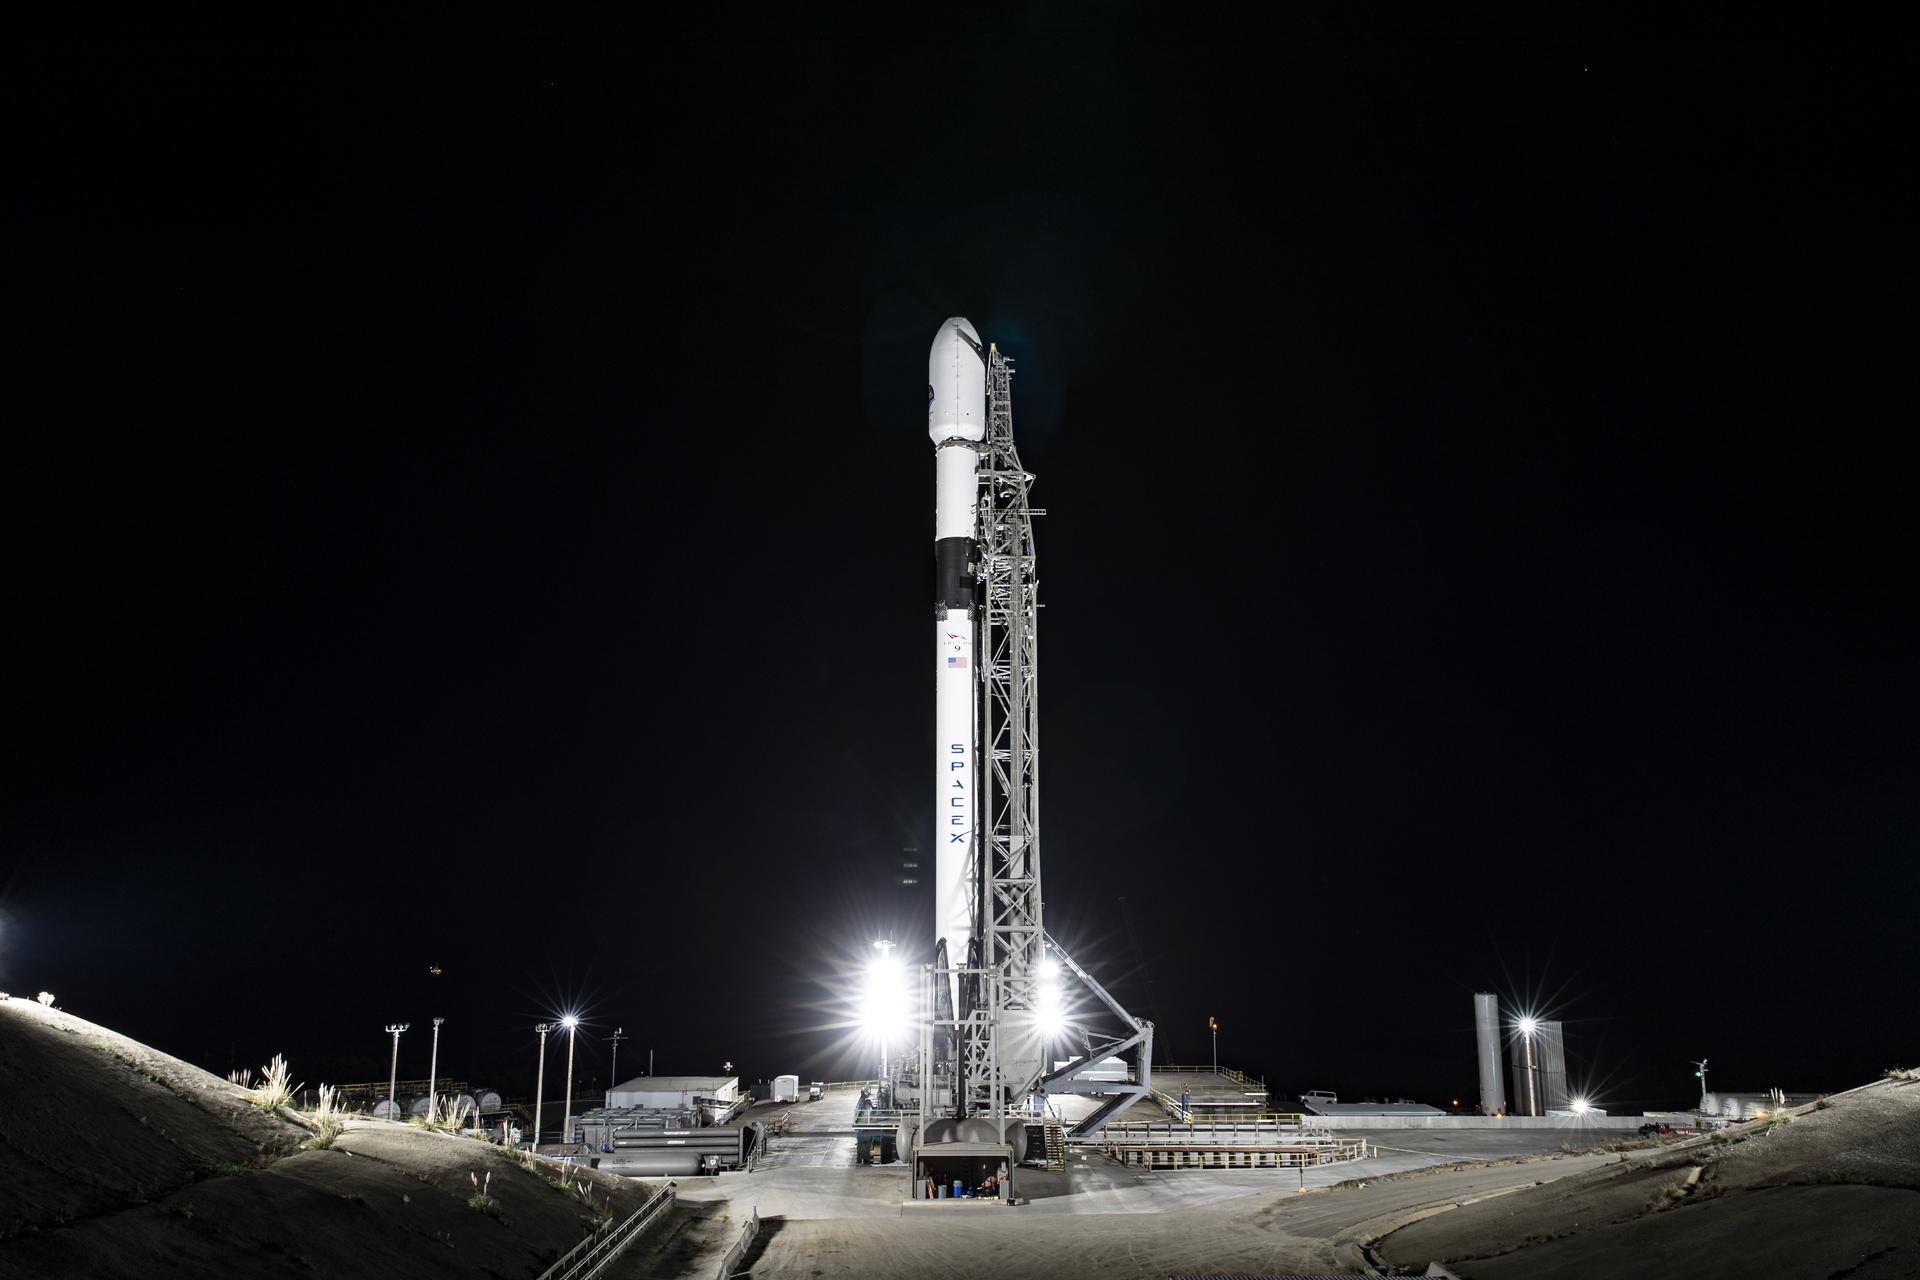
Set to launch no earlier than Nov. 16, Sentinel-6B will continue the data record now being collected by its twin satellite Sentinel-6 Michael Freilich, which lifted off from Vandenberg Space Force Base in November 2020 aboard the SpaceX Falcon 9 rocket shown here.
SpaceX
Set to track sea levels across more than 90% of Earth’s ocean, the mission must first get into orbit. Here’s what to expect.
Sentinel-6B, an ocean-tracking satellite jointly developed by NASA and ESA (European Space Agency), is ready to roll out to the launch pad, packed into the payload fairing of a SpaceX Falcon 9 rocket.
Launch is targeted at 12:21 a.m. EST, Monday, Nov. 17 (9:21 p.m. PST, Sunday, Nov. 16). Once it lifts off from Vandenberg Space Force Base in California, the satellite will ride out a 57-minute sequence of events ending in spacecraft separation, when the satellite detaches from the rocket.
Then Sentinel-6B’s real work begins. Orbiting Earth every 112 minutes at 4.5 miles (7.2 kilometers) per second, the satellite will eventually take over for its twin, Sentinel-6 Michael Freilich, launched five years ago, to continue a multidecade dataset for sea level measurements from space. Those measurements, along with atmospheric data the mission gathers, will help improve public safety and city planning while protecting coastal infrastructure, including power plants and defense interests. NASA will also use the data to refine atmospheric models that support the safe re-entry of Artemis astronauts.
Here’s a closer look at what lies ahead for the satellite in the coming days.
Launch timeline
Measuring 19.1 feet (5.82 meters) long and 7.74 feet (2.36 meters) high (including the communications antennas), the satellite weighs in at around 2,600 pounds (1,200 kilograms) when loaded with propellant at launch.
The satellite will lift off from Space Launch Complex 4 East at Vandenberg. If needed, backup launch opportunities are available on subsequent days, with the 20-second launch window occurring about 12 to 13 minutes earlier each day.
A little more than two minutes after the Falcon 9 rocket lifts off, the main engine cuts off. Shortly after, the rocket’s first and second stages separate, followed by second-stage engine start. The reusable Falcon 9 first stage then begins its automated boost-back burn to the launch site for a powered landing. About three minutes after launch, the two halves of the payload fairing, which protected the satellite as it traveled through the atmosphere, separate and fall safely back to Earth.
The first cutoff of the second stage engine takes place approximately eight minutes after liftoff, at which point the launch vehicle and the spacecraft will be in a temporary “parking” orbit. The second stage engine fires a second time about 44 minutes later, and about 57 minutes after liftoff, the rocket and the spacecraft separate. Roughly seven minutes after that, the satellite’s solar panels deploy. Sentinel-6B is expected to make first contact with ground controllers about 35 minutes after separation (roughly an hour and a half after liftoff) — a major milestone indicating that the spacecraft is healthy.
Science mission
Following launch operations, the team will focus on its next challenge: getting the spacecraft ready for science operations. Once in orbit, Sentinel-6B will fly about 30 seconds behind its twin, the Sentinel-6 Michael Freilich satellite. When scientists and engineers have completed cross-calibrating the data collected by the two spacecraft, Sentinel-6B will take over the role of providing primary sea level measurements while Sentinel-6 Michael Freilich will move into a different orbit. From there, researchers plan to use measurements from Sentinel-6 Michael Freilich for different purposes, including helping to map seafloor features (variations in sea surface height can reveal variations in ocean floor features, such as seamounts).
Sentinel-6B is part of a U.S.-European mission that will continue 30-year-plus record of sea-level measurements. Its observations will help build an accurate picture of local and global sea surface heights to support storm forecasting, secure coastal infrastructure, and help optimize commercial activities, such as shipping. NASA/JPL-Caltech
Where to find launch coverage
Launch day coverage of the mission will be available on the agency’s website, including links to live streaming and blog updates beginning no earlier than 11 p.m. EST, Nov. 16, as the countdown milestones occur. Streaming video and photos of the launch will be accessible on demand shortly after liftoff. Follow countdown coverage on NASA’s Sentinel-6B blog.
The Copernicus Sentinel-6/Jason-CS (Continuity of Service) mission is a collaboration between NASA, ESA, EUMETSAT (European Organisation for the Exploitation of Meteorological Satellites), and the National Oceanic and Atmospheric Administration (NOAA). The European Commission contributed funding support while France’s space agency CNES (Centre National d’Études Spatiales) provided technical expertise. The mission also marks the first international involvement in Copernicus, the European Union’s Earth Observation Programme.
A division of Caltech in Pasadena, JPL built three science instruments for each Sentinel-6 satellite: the Advanced Microwave Radiometer, the Global Navigation Satellite System – Radio Occultation, and the Laser Retroreflector Array. NASA is also contributing launch services, ground systems supporting operation of the NASA science instruments, the science data processors for two of these instruments, and support for the U.S. members of the international Ocean Surface Topography and Sentinel-6 science teams. The launch service is managed by NASA’s Launch Services Program, based at the agency’s Kennedy Space Center in Florida.
This website uses cookies to improve your experience. We'll assume you're ok with this, but you can opt-out if you wish.AcceptRead More
Privacy & Cookies Policy
Privacy Overview
This website uses cookies to improve your experience while you navigate through the website. Out of these, the cookies that are categorized as necessary are stored on your browser as they are essential for the working of basic functionalities of the website. We also use third-party cookies that help us analyze and understand how you use this website. These cookies will be stored in your browser only with your consent. You also have the option to opt-out of these cookies. But opting out of some of these cookies may affect your browsing experience.
Necessary cookies are absolutely essential for the website to function properly. This category only includes cookies that ensures basic functionalities and security features of the website. These cookies do not store any personal information.
Any cookies that may not be particularly necessary for the website to function and is used specifically to collect user personal data via analytics, ads, other embedded contents are termed as non-necessary cookies. It is mandatory to procure user consent prior to running these cookies on your website.