Official portrait of NASA Associate Administrator Jim Free, taken on Nov. 22, 2024, at the agency’s headquarters in Washington.
Credit: NASA/Bill Ingalls
NASA Associate Administrator Jim Free announced Wednesday his retirement, effective Saturday, Feb. 22. As associate administrator, Free has been the senior advisor to NASA Acting Administrator Janet Petro and leads NASA’s 10 center directors, as well as the mission directorate associate administrators at NASA Headquarters in Washington. He is the agency’s chief operating officer for more than 18,000 employees and oversaw an annual budget of more than $25 billion.
During his tenure as associate administrator since January 2024, NASA added nearly two dozen new signatories of the Artemis Accords, enabled the first Moon landing through the agency’s CLPS (Commercial Lunar Payload Services) initiative to deliver NASA science to the lunar surface, launched the Europa Clipper mission to study Jupiter’s icy ocean moon, and found molecules containing the ingredients for life in samples from asteroid Bennu delivered to Earth by NASA’s OSIRIS-REx (Origins, Spectral Interpretation, Resource Identification and Security–Regolith Explorer) spacecraft.
“Throughout his career, Jim has been the ultimate servant leader – always putting the mission and the people of NASA first,” said Petro. “A remarkable engineer and a decisive leader, he combines deep technical expertise with an unwavering commitment to this agency’s mission. Jim’s legacy is one of selfless service, steadfast leadership, and a belief in the power of people.”
Among the notable contributions to the nation during his NASA career, Free also championed a new path forward to return samples from Mars ahead of human missions to the Red Planet, supported the crews living and working aboard the International Space Station as they conduct hundreds of experiments and technology demonstrations, and engaged industry in new ways to secure a public/private partnership for NASA’s VIPER (Volatiles Investigating Polar Exploration Rover) mission on the Moon.
“It has been an honor to serve NASA and walk alongside the workforce that tackles the most difficult engineering challenges, pursues new scientific knowledge in our universe and beyond, develops technologies for future exploration endeavors, all while prioritizing safety every day for people on the ground, in the air, and in space,” Free said. “I am grateful for the opportunity to be part of the NASA family and contribute to the agency’s mission for the benefit of humanity.”
During his more than three decades of service, Free has held several leadership roles at the agency. Before being named NASA associate administrator, Free served as associate administrator of the Exploration Systems Development Mission Directorate, where he oversaw the successful Artemis I mission and the development of NASA’s Moon to Mars architecture, defining and managing the systems development for the agency’s Artemis missions and planning for NASA’s integrated deep space exploration approach.
Free began his NASA career in 1990 as an engineer, working on Tracking and Data Relay Satellites at NASA’s Goddard Space Flight Center in Greenbelt, Maryland. He later transferred to the agency’s Glenn Research Center in Cleveland and served in a variety of roles supporting the International Space Station and the development of the Orion spacecraft before transferring to NASA’s Johnson Space Center in Houston in 2008. Free returned to NASA Glenn in 2009 and was promoted to chief of the Space Flight Systems Directorate, where he oversaw the center’s space work. Free was named deputy center director in November 2010 and then served as center director from January 2013 until March 2016, when he was appointed to the NASA Headquarters position of deputy associate administrator for Technical [sic] in the Human Exploration and Operations Mission Directorate.
A native of Northeast Ohio, Free earned his bachelor’s degree in aeronautics from Miami University in Oxford, Ohio, and his master’s degree in space systems engineering from Delft University of Technology in the Netherlands.
Free is the recipient of the Presidential Rank Award, NASA Distinguished Service Medal, NASA Outstanding Leadership Medal, NASA Exceptional Service Medal, NASA Significant Achievement Medal, and numerous other awards.
NASA Tests Drones to Provide Micrometeorology, Aid in Fire Response
Pilot in command Brayden Chamberlain performs pre-flight checks on the NASA Alta X quadcopter during the FireSense uncrewed aerial system (UAS) technology demonstration in Missoula.
Credits: NASA ARC/Milan Loiacono
In Aug. 2024, a team of NASA researchers and partners gathered in Missoula, to test new drone-based technology for localized forecasting, or micrometeorology. Researchers attached wind sensors to a drone, NASA’s Alta X quadcopter, aiming to provide precise and sustainable meteorological data to help predict fire behavior.
Wildfires are increasing in number and severity around the world, including the United States, and wind is a major factor. It leads to unexpected and unpredictable fire growth, public threats, and fire fatalities, making micrometeorology a very effective tool to combat fire.
This composite image shows the NASA Alta X quadcopter taking off during one of eight flights it performed for the 2024 FireSense UAS technology demonstration in Missoula. Mounted on top of the drone is a unique infrastructure designed at NASA’s Langley Research Center in Hampton,Virginia, to carry sensors that measure wind speed and direction into the sky. On the ground, UAS pilot in command Brayden Chamberlain performs final pre-flight checks.
NASA/Milan Loiacono
The campaign was run by NASA’s FireSense project, focused on addressing challenges in wildland fire management by putting NASA science and technology in the hands of operational agencies.
“Ensuring that the new technology will be easily adoptable by operational agencies such as the U.S. Forest Service and the National Weather Service was another primary goal of the campaign,” said Jacquelyn Shuman, FireSense project scientist at NASA’s Ames Research Center in California’s Silicon Valley.
The FireSense team chose the Alta X drone because the U.S. Forest Service already has a fleet of the quadcopters and trained drone pilots, which could make integrating the needed sensors – and the accompanying infrastructure – much easier and more cost-effective for the agency.
The UAS pilot in command, Brayden Chamberlain, flashes a “good to go” signal to the command tent, indicating that the NASA Alta X quadcopter is prepped for takeoff. Behind Chamberlain, the custom structure attached to the quadcopter holds a radiosonde (small white box) and an anemometer (hidden from view), which will collect data on wind speed and direction, humidity, temperature, and pressure.
NASA/Milan Loiacono
The choice of the two sensors for the drone’s payload was also driven by their adoptability.
The first, called a radiosonde, measures wind direction and speed, humidity, temperature, and pressure, and is used daily by the National Weather Service. The other sensor, an anemometer, measures wind speed and direction, and is used at weather stations and airports around the world.
The two sensors mounted on the NASA Alta X quadcopter are a radiosonde (left) and an anemometer (right), which measure wind speed and direction. The FireSense teams hopes that by giving them wings, researchers can enable micrometeorology to better predict fire and smoke behavior.
NASA/Milan Loiacono
“Anemometers are everywhere, but are usually stationary,” said Robert McSwain, the FireSense uncrewed aerial system (UAS) lead, based at NASA’s Langley Research Center in Hampton, Virginia. “We are taking a sensor type that is already used all over the world, and giving it wings.”
Anemometers are everywhere, but are usually stationary. We are taking a sensor type that is already used all over the world, and giving it wings.
Robert Mcswain
FireSense Uncrewed Aerial System (UAS) Lead
Both sensors create datasets that are already familiar to meteorologists worldwide, which opens up the potential applications of the platform.
Current Forecasting Methods: Weather Balloons
Traditionally, global weather forecasting data is gathered by attaching a radiosonde to a weather balloon and releasing it into the air. This system works well for regional weather forecasts. But the rapidly changing environment of wildland fire requires more recurrent, pinpointed forecasts to accurately predict fire behavior. It’s the perfect niche for a drone.
Left: Steven Stratham (right) attaches a radiosonde to the string of a weather balloon as teammates Travis Christopher (left) and Danny Johnson (center) prepare the balloon for launch. This team of three from Salish Kootenai College is one of many college teams across the nation trained to prepare and launch weather balloons. Right: One of these weather balloons lifts into the sky, with the radiosonde visible at the end of the string.
NASA/Milan Loiacono
“These drones are not meant to replace the weather balloons,” said Jennifer Fowler, FireSense’s project manager at Langley. “The goal is to create a drop-in solution to get more frequent, localized data for wildfires – not to replace all weather forecasting.”
The goal is to create a drop-in solution to get more frequent, localized data for wildfires – not to replace all weather forecasting.
Jennifer Fowler
FireSense Project Manager
Drones Provide Control, Repeat Testing, Sustainability
Drones can be piloted to keep making measurements over a precise location – an on-site forecaster could fly one every couple of hours as conditions change – and gather timely data to help determine how weather will impact the direction and speed of a fire.
Fire crews on the ground may need this information to make quick decisions about where to deploy firefighters and resources, draw fire lines, and protect nearby communities.
A reusable platform, like a drone, also reduces the financial and environmental impact of forecasting flights.
“A weather balloon is going to be a one-off, and the attached sensor won’t be recovered,” Fowler said. “The instrumented drone, on the other hand, can be flown repeatedly.”
The NASA Alta X quadcopter sits in a field in Missoula, outfitted with a special structure to carry a radiosonde (sensor on the left) and an anemometer (sensor on the right) into the air. This structure was engineered at NASA’s Langley Research Center to ensure the sensors are far enough from the rotors to avoid interfering with the data collected, but without compromising the stability of the drone.
NASA/Milan Loiacono
The Missoula Campaign
Before such technology can be sent out to a fire, it needs to be tested. That’s what the FireSense team did this summer.
Smoke from the nearby Miller Peak Fire drifts by the air control tower at Missoula Airport on August 29, 2024. Miller Peak was one of several fires burning in and around Missoula that month, creating a smokey environment which, combined with the mountainous terrain, made the area an ideal location to test FireSense’s new micrometeorology technology.
NASA/Milan Loiacono
McSwain described the conditions in Missoula as an “alignment of stars” for the research: the complex mountain terrain produces erratic, historically unpredictable winds, and the sparsity of monitoring instruments on the ground makes weather forecasting very difficult. During the three-day campaign, several fires burned nearby, which allowed researchers to test how the drones performed in smokey conditions.
A drone team out of NASA Langley conducted eight data-collection flights in Missoula. Before each drone flight, student teams from the University of Idaho in Moscow, Idaho, and Salish Kootenai College in Pablo, Montana, launched a weather balloon carrying the same type of radiometer.
Left: Weather balloon teams from University of Idaho and Salish Kootenai College prepare a weather balloon for launch on the second day of the FireSense campaign in Missoula. Right: NASA Langley drone crew members Todd Ferrante (left) and Brayden Chamberlain (right) calibrate the internal sensors of the NASA Alta X quadcopter before its first test flight on Aug. 27, 2024.
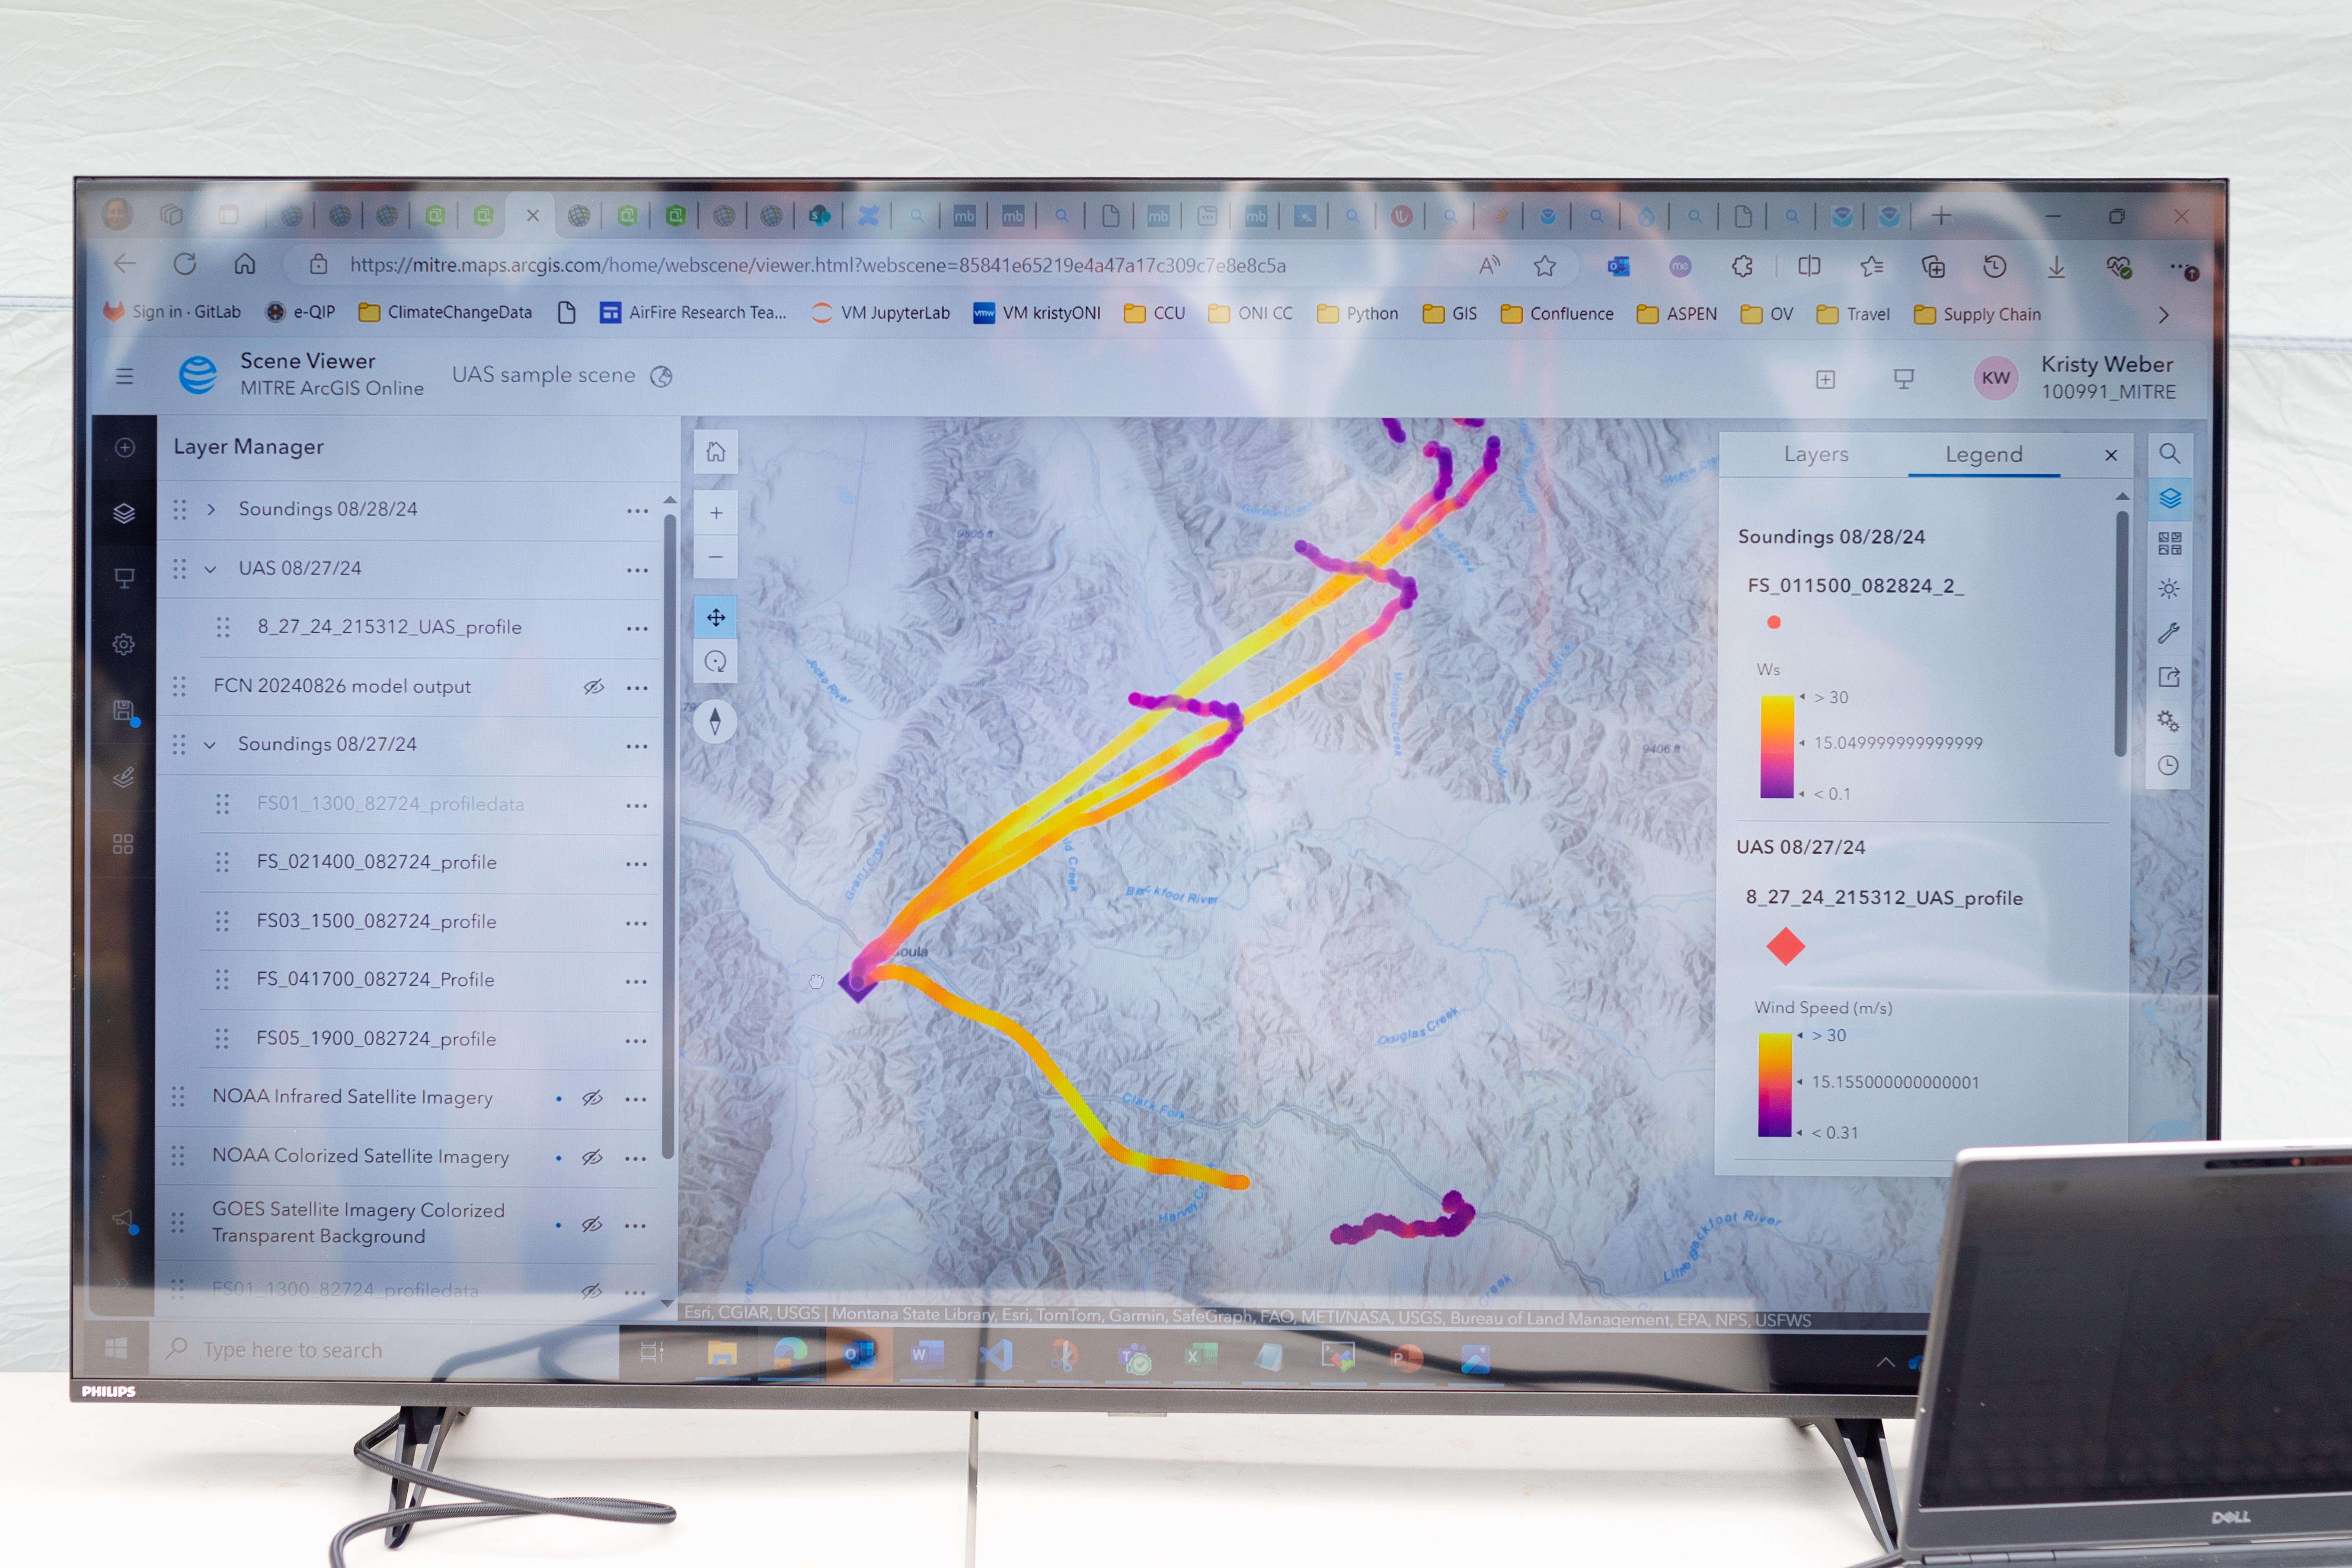
Once those data sets were created, they needed to be transformed into a usable format. Meteorologists are used to the numbers, but incident commanders on an active fire need to see the data in a form that allows them to quickly understand which conditions are changing, and how. That’s where data visualization partners come in. For the Missoula campaign, teams from MITRE, NVIDIA, and Esri joined NASA in the field.
An early data visualization from the Esri team shows the flight paths of weather balloons launched on the first day of the FireSense UAS technology demonstration in Missoula. The paths are color-coded by wind speed, from purple (low wind) to bright yellow (high wind).
NASA/Milan Loiacono
Measurements from both the balloon and the drone platforms were immediately sent to the on-site data teams. The MITRE team, together with NVIDIA, tested high-resolution artificial intelligence meteorological models, while the Esri team created comprehensive visualizations of flight paths, temperatures, and wind speed and direction. These visual representations of the data make conclusions more immediately apparent to non-meteorologists.
What’s Next?
Development of drone capabilities for fire monitoring didn’t begin in Missoula, and it won’t end there.
“This campaign leveraged almost a decade of research, development, engineering, and testing,” said McSwain. “We have built up a UAS flight capability that can now be used across NASA.”
This campaign leveraged almost a decade of research, development, engineering, and testing. We have built up a UAS flight capability that can now be used across NASA.
Robert Mcswain
FireSense Uncrewed Aerial System (UAS) Lead
The NASA Alta X and its sensor payload will head to Alabama and Florida in spring 2025, incorporating improvements identified in Montana. There, the team will perform another technology demonstration with wildland fire managers from a different region.
The FireSense project is led by NASA Headquarters in Washington and sits within the Wildland Fires program, with the project office based at NASA Ames. The goal of FireSense is to transition Earth science and technological capabilities to operational wildland fire management agencies, to address challenges in U.S. wildland fire management before, during, and after a fire.
About the Author
Milan Loiacono
Science Communication Specialist
Milan Loiacono is a science communication specialist for the Earth Science Division at NASA Ames Research Center.
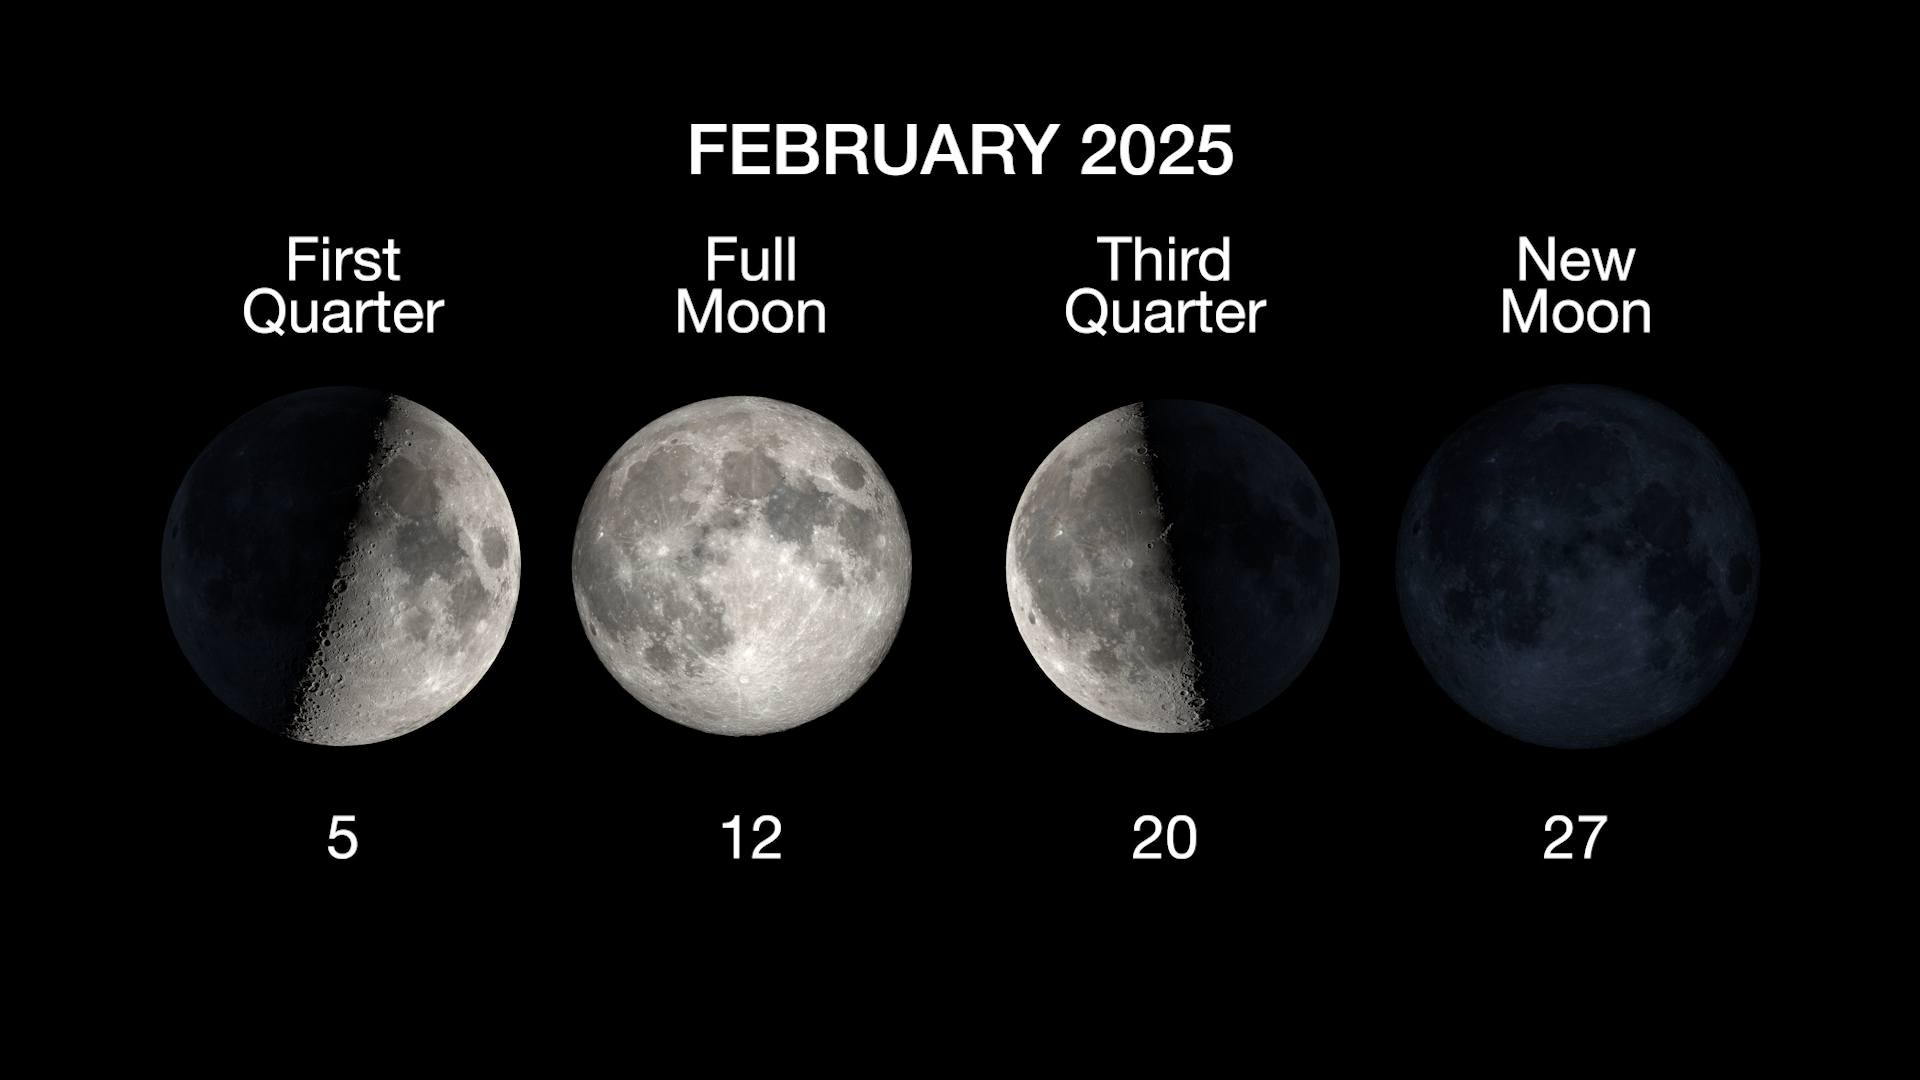
The next full moon will be Wednesday morning, Feb. 12, 2025, appearing opposite the Sun (in Earth longitude) at 8:53 a.m. EST. The Moon will appear full for about three days around this time, from Monday night into early Thursday evening. The bright star Regulus will appear near the full moon.
Sky chart showing Jupiter and Mars high overhead after nightfall in February.
NASA/JPL-Caltech
The Maine Farmers’ Almanac began publishing Native American names for full moons in the 1930s, and these names are now widely known and used. According to this almanac, as the full moon in February, the tribes of the northeastern U.S. called this the Snow Moon or the Storm Moon because of the heavy snows in this season. Bad weather and heavy snowstorms made hunting difficult, so this Moon was also called the Hunger Moon. NOAA monthly averages for the Washington, D.C. area airports from 1991 to 2020 show January and February nearly tied as the snowiest months of the year (with February one tenth of an inch ahead).
Here are the other celestial events between now and the full moon after next with times and angles based on the location of NASA Headquarters in Washington:
As winter continues in the Northern Hemisphere, the daily periods of sunlight continue to lengthen. Wednesday, Feb. 12 (the day of the full moon), morning twilight will begin at 6:04 a.m. EST, sunrise will be at 7:03 a.m., solar noon will be at 12:23 p.m. when the Sun will reach its maximum altitude of 37.7 degrees, sunset will be at 5:43 p.m., and evening twilight will end at 6:41 p.m.
Daylight Saving Time starts on the second Sunday in March for much of the United States. The day before, Saturday, March 8, morning twilight will begin at 5:32 a.m., sunrise will be at 6:30 a.m., solar noon will be at 12:19 p.m. when the Sun will reach its maximum altitude of 46.5 degrees, sunset will be at 6:08 p.m., and evening twilight will end at 7:06 p.m. Early on Sunday morning, March 9, the clock will “spring forward” from 1:59:59 a.m. EST to 3:00:00 a.m. EDT. Sunday, March 9, morning twilight will begin at 6:30 a.m., sunrise will be at 7:28 a.m., solar noon will be at 1:19 p.m. when the Sun will reach its maximum altitude of 46.9 degrees, sunset will be at 7:09 p.m., and evening twilight will end at 8:07 p.m. By Friday, March 14 (the day of the full moon after next), morning twilight will begin at 6:23 a.m., sunrise will be at 7:20 a.m., solar noon will be at 1:17 p.m. when the Sun will reach its maximum altitude of 48.9 degrees, sunset will be at 7:14 p.m., and evening twilight will end at 8:12 p.m.
This should still be a good time for planet watching, especially with a backyard telescope. On the evening of the March 14, the full moon, Venus, Jupiter, Mars, Saturn, and Uranus will all be in the evening sky. The brightest of the planets, Venus, will be 28 degrees above the west-southwestern horizon, appearing as a 29% illuminated crescent through a telescope. Second in brightness will be Jupiter at 71 degrees above the south-southeastern horizon. With a telescope you should be able to see Jupiter’s four bright moons, Ganymede, Callisto, Europa, and Io, noticeably shifting positions in the course of an evening. Jupiter was at its closest and brightest in early December. Third in brightness will be Mars at 48 degrees above the eastern horizon. Mars was at its closest and brightest for the year just a month ago. Fourth in brightness (and appearing below Venus) will be Saturn at 11 degrees above the west-southwestern horizon. With a telescope you may be able to see Saturn’s rings and its bright moon Titan. The rings will appear very thin and will be edge-on to Earth in March 2025. Saturn was at its closest and brightest in early September. The planet Uranus will be too dim to see without a telescope when the Moon is in the sky, but later in the lunar cycle, if you are in a very dark area with clear skies and no interference from moonlight, it will still be brighter than the faintest visible stars. Uranus was at its closest and brightest in mid-November.
During this lunar cycle, these planets, along with the background of stars, will rotate westward by about a degree each night around the pole star Polaris. Venus, named after the Roman goddess of love, will reach its brightest around Feb. 14, making this a special Valentine’s Day. After about Feb. 17, the planet Mercury, shining brighter than Mars, will begin emerging from the glow of dusk about 30 minutes after sunset. Feb. 24 will be the first evening Mercury will be above the western horizon as twilight ends, while Feb. 25 will be the last evening Saturn will be above the western horizon as twilight ends, making these the only two evenings that all of the visible planets will be in the sky after twilight ends. For a few more evenings after this, Saturn should still be visible in the glow of dusk during twilight. Around March 8 or 9, Mercury will have dimmed to the same brightness as Mars, making Mars the third brightest visible planet again. By the evening of March 13 (the evening of the night of the full moon after next), as twilight ends, Venus and Mercury will appear low on the western horizon, making them difficult targets for a backyard telescope, while Jupiter and Mars (and Uranus) will appear high overhead and much easier to view.
Comets and Meteor Showers
No meteor shower peaks are predicted during this lunar cycle. No comets are expected to be visible without a telescope for Northern Hemisphere viewers. Southern Hemisphere viewers may still be able to use a telescope to see comet C/2024 G3 (ATLAS), although it is fading as it moves away from Earth and the Sun, and some recent reports suggest that it might be breaking apart and disappearing from view.
Evening Sky Highlights
On the evening of Wednesday, Feb. 12 (the evening of the full moon), as twilight ends at 6:41 p.m. EST, the rising Moon will be 7 degrees above the east-northeastern horizon with the bright star Regulus 2 degrees to the right. The brightest planet in the sky will be Venus at 28 degrees above the west-southwestern horizon, appearing as a crescent through a telescope. Next in brightness will be Jupiter at 71 degrees above the south-southeastern horizon. Third in brightness will be Mars at 48 degrees above the eastern horizon. The fourth brightest planet will be Saturn at 11 degrees above the west-southwestern horizon. Uranus, on the edge of what is visible under extremely clear, dark skies, will be 68 degrees above the south-southwestern horizon. The bright star closest to overhead will be Capella at 75 degrees above the northeastern horizon. Capella is the 6th brightest star in our night sky and the brightest star in the constellation Auriga (the charioteer). Although we see Capella as a single star, it is actually four stars (two pairs of stars orbiting each other). Capella is about 43 light years from us.
Also high in the sky will be the constellation Orion, easily identifiable because of the three stars that form Orion’s Belt. This time of year, we see many bright stars in the sky at evening twilight, with bright stars scattered from the south-southeast toward the northwest. We see more stars in this direction because we are looking toward the Local Arm of our home galaxy (also called the Orion Arm, Orion-Cygnus Arm, or Orion Bridge). This arm is about 3,500 light years across and 10,000 light years long. Some of the bright stars from this arm that we see are the three stars of Orion’s Belt, and Rigel (860 light years from Earth), Betelgeuse (548 light years), Polaris (about 400 light years), and Deneb (about 2,600 light years).
Facing toward the south from the Northern Hemisphere, to the upper left of Orion’s Belt is the bright star Betelgeuse (be careful not to say this name three times). About the same distance to the lower right is the bright star Rigel. Orion’s belt appears to point down and to the left about seven belt lengths to the bright star Sirius, the brightest star in the night sky. Below Sirius is the bright star Adhara. To the upper right of Orion’s Belt (at about the same distance from Orion as Sirius) is the bright star Aldebaran. Nearly overhead is the bright star Capella. To the left (east) of Betelgeuse is the bright star Procyon. The two stars above Procyon are Castor and Pollux, the twin stars of the constellation Gemini (Pollux is the brighter of the two). The bright star Regulus appears farther to the left (east) of Pollux near the eastern horizon. For now, Mars is near Castor and Pollux, while Jupiter is near Aldebaran, but these are planets (from the Greek word for wanderers) and continue to shift relative to the background of the stars. Very few places on the East Coast are dark enough to see the Milky Way (our home galaxy), but if you could see it, it would appear to stretch overhead from the southeast to the northwest. Since we are seeing our galaxy from the inside, the combined light from its 100 to 400 billion stars make it appear as a band surrounding Earth.
As this lunar cycle progresses, the planets and the background of stars will rotate westward by about a degree each evening around the pole star Polaris. The brightest of the planets, Venus, will reach its brightest around Valentine’s Day, Feb. 14. Bright Mercury will begin emerging from the glow of dusk around Feb. 17 and will be above the horizon as twilight ends beginning Feb. 24, initiating a brief period when all the visible planets will be in the evening sky at the same time that will end after Feb. 25, the last evening Saturn will be above the horizon as twilight ends. Feb. 24 and 25 will also be the two evenings when Mercury and Saturn will appear closest together.
The waxing crescent “Wet” or “Cheshire” Moon will appear near Mercury on Feb. 28 and Venus on March 1, appearing like a bowl or a smile above the horizon. The waxing gibbous Moon will appear near Mars and Pollux on March 8. Mercury will reach its highest above the horizon as twilight ends on March 8 but will be fading, appearing fainter than Mars. The nearly full moon will appear near Regulus on March 11. Venus and Mercury will be closest to each other on March 12.
By the evening of Thursday, March 13 (the evening of the night of the full moon after next), as twilight ends at 8:11 p.m. EDT, the rising Moon will be 14 degrees above the eastern horizon. The brightest planet in the sky will be Venus at 4 degrees above the west-southwestern horizon, appearing as a thin, 4% illuminated crescent through a telescope. Next in brightness will be Jupiter at 62 degrees above the west-southwestern horizon. Third in brightness will be Mars at 72 degrees above the southeastern horizon. Mercury, to the left of Venus, will also be 4 degrees above the western horizon. Uranus, on the edge of what is visible under extremely clear, moonless dark skies, will be 45 degrees above the western horizon. The bright star closest to overhead will still be Capella at 75 degrees above the northwestern horizon.
Morning Sky Highlights
On the morning of Wednesday, Feb. 12, 2025 (the morning of the night of the full moon), as twilight begins at 6:04 a.m. EST, the setting full moon will be 13 degrees above the western horizon. No planets will appear in the sky. The bright star appearing closest to overhead will be Arcturus at 65 degrees above the southeastern horizon. Arcturus is the brightest star in the constellation Boötes (the herdsman or plowman) and the 4th brightest star in our night sky. It is 36.7 light years from us. While it has about the same mass as our Sun, it is about 2.6 billion years older and has used up its core hydrogen, becoming a red giant 25 times the size and 170 times the brightness of our Sun. One way to identify Arcturus in the night sky is to start at the Big Dipper, then follow the arc of the dipper’s handle as it “arcs toward Arcturus.”
As this lunar cycle progresses the background of stars will rotate westward by about a degree each morning around the pole star Polaris. The waning Moon will appear near Regulus on Feb. 13, Spica on Feb. 17, and Antares on Feb. 21. The nearly full moon will appear near Regulus on March 12.
By the morning of Friday, March 14 (the morning of the full moon after next), as twilight begins at 6:23 a.m. EDT, the setting full moon will be 12 degrees above the western horizon. No visible planets will appear in the sky. The bright star closest to overhead will be Vega at 68 degrees above the eastern horizon. Vega is the 5th brightest star in our night sky and the brightest star in the constellation Lyra (the lyre). Vega is one of the three bright stars of the “Summer Triangle” (along with Deneb and Altair). It is about 25 light-years from Earth, has twice the mass of our Sun, and shines 40 times brighter than our Sun.
Detailed Daily Guide
Here is a day-by-day listing of celestial events between now and the full moon on March 14, 2025. The times and angles are based on the location of NASA Headquarters in Washington, and some of these details may differ for where you are (I use parentheses to indicate times specific to the D.C. area). If your latitude is significantly different than 39 degrees north (and especially for my Southern Hemisphere readers), I recommend using an astronomy app that is set up for your location or a star-watching guide from a local observatory, news outlet, or astronomy club.
Sunday morning, Feb. 9 Mars will appear to the upper left of the waxing gibbous Moon. In the early morning at about 2 a.m. EST, Mars will be 8 degrees from the Moon. By the time the Moon sets on the northwestern horizon at 5:58 a.m., Mars will have shifted to 6 degrees from the Moon. For parts of Asia and Northern Europe the Moon will pass in front of Mars. Also, Sunday morning, the planet Mercury will be passing on the far side of the Sun as seen from Earth, called superior conjunction. Because Mercury orbits inside of the orbit of Earth it will be shifting from the morning sky to the evening sky and will begin emerging from the glow of dusk on the west-southwestern horizon after about Feb. 17 (depending upon viewing conditions).
Sunday evening into Monday morning, Feb. 9 – 10 The waxing gibbous Moon will have shifted to the other side of the Mars (having passed in front of Mars in the afternoon when we could not see them). As evening twilight ends (at 6:38 p.m. EST) the Moon will be between Mars and the bright star Pollux, with Mars 3 degrees to the upper right and Pollux 3 degrees to the lower left. By the time the Moon reaches its highest for the night at 10:27 p.m., Mars will be 4.5 degrees to the right of the Moon and Pollux 2.5 degrees to the upper left of the Moon. Mars will set first on the northwestern horizon Monday morning at 5:44 a.m., just 22 minutes before morning twilight begins at 6:06 a.m.
Wednesday morning, Feb. 12 As mentioned above, the full moon will be Wednesday morning, Feb. 12, at 8:53 a.m. EST. This will be on Thursday morning from Australian Central Time eastward to the international date line in the mid-Pacific. The Moon will appear full for about three days around this time, from Monday night into early Thursday evening.
Wednesday evening into Thursday morning, Feb. 12 to 13 The bright star Regulus will appear near the full moon. As evening twilight ends at 6:41 p.m. EST, Regulus will be less than 2 degrees to the right of the Moon, very near its closest. By the time the Moon reaches its highest for the night at 12:55 a.m., Regulus will be 3 degrees to the right. As morning twilight begins at 6:03 a.m., Regulus will be 5 degrees to the lower right of the Moon.
Friday evening, Feb. 14 Venus, the brightest of the planets, will be near its brightest for the year (based on a geometric estimate called greatest brilliancy). As evening twilight ends at 6:43 p.m. EST, Venus will be 28 degrees above the west-southwestern horizon. Venus will set on the western horizon about 2.5 hours later at 9:09 p.m. Having Venus, named after the Roman goddess of love, shining at its brightest on this evening will make for a special Valentine’s Day!
Sunday night into Monday morning Feb. 16 to 17 Bright star Spica will appear near the waning gibbous Moon. As Spica rises on the east-southeastern horizon at 10:19 p.m. EST, it will be 3.5 degrees to the lower left of the Moon. Throughout the night Spica will appear to rotate clockwise around the Moon. As the Moon reaches its highest at 3:37 a.m., Spica will be 2 degrees to the left of the Moon. By the time morning twilight begins at 5:58 a.m., Spica will be a little more than a degree above the Moon.
Monday evening, Feb. 17 This will be the first evening Mercury will be above the west-southwestern horizon 30 minutes after sunset, a rough approximation of when it might start emerging from the glow of dusk before evening twilight ends. Increasing the likelihood it will be visible, Mercury will be brighter than Mars, but not as bright as Jupiter.
Monday evening, Feb. 17 At 8:06 p.m. EST, the Moon will be at apogee, its farthest from Earth for this orbit.
Midday on Thursday, Feb. 20 The waning Moon will appear half full as it reaches its last quarter at 12:32 p.m. EST.
Friday morning, Feb. 21 The bright star Antares will appear quite near the waning crescent Moon. As the Moon rises on the southeastern horizon at 2:05 a.m. EST, Antares will be one degree to the upper left. Antares will appear to rotate clockwise and shift away from the Moon as morning progresses. By the time morning twilight begins at 5:53 a.m., Antares will be 2 degrees to the upper right of the Moon. From the southern part of South America, the Moon will actually block Antares from view.
Monday, Feb. 24 This will be the first evening Mercury will be above the western horizon as evening twilight ends at 6:54 p.m. EST, setting three minutes later at 6:57 p.m. This will be the first of two evenings when all the visible planets will be in the evening sky at the same time after twilight ends.
This also will be the evening when Mercury and Saturn will appear nearest to each other, 1.6 degrees apart. To see them you will need a very clear view toward the western horizon and will likely have to look before evening twilight ends at 6:54 p.m. EST, as Mercury will set three minutes later at 6:57 p.m., and Saturn two minutes after Mercury at 6:59 p.m.
Tuesday, Feb. 25 This will be the last evening Saturn will be above the western horizon as evening twilight ends at 6:55 p.m. EST, setting one minute later at 6:56 p.m. This will be the last of two evenings when all of the visible planets will be in the evening sky at the same time after twilight ends. Mercury and Saturn will appear almost as close together as the night before, with Mercury setting six minutes after Saturn at 7:02 p.m. Saturn, appearing about as bright as the star Pollux, may still be visible in the glow of dusk before evening twilight ends for a few evenings after this.
Thursday evening, Feb. 27 At 7:45 p.m. EST will be the new Moon, when the Moon passes between Earth and the Sun and will not be visible from Earth.
The day of, or the day after, the new Moon marks the start of the new month for most lunisolar calendars. The second month of the Chinese calendar starts on Friday, Feb. 28. Sundown on Feb. 28 also marks the start of Adar in the Hebrew calendar. In the Islamic calendar the months traditionally start with the first sighting of the waxing crescent Moon. Many Muslim communities now follow the Umm al-Qura Calendar of Saudi Arabia, which uses astronomical calculations to start months in a more predictable way (intended for civil and not religious purposes). This calendar predicts the holy month of Ramadan will start with sunset on Feb. 28, but because of Ramadan’s religious significance, it is one of four months in the Islamic year where the start of the month is updated based upon the actual sighting of the crescent Moon. Ramadan is honored as the month in which the Quran was revealed. Observing this annual month of charitable acts, prayer, and fasting from dawn to sunset is one of the Five Pillars of Islam.
Friday evening, Feb. 28 As evening twilight ends at 6:58 p.m. EST, you may be able to see the thin, waxing crescent Moon barely above the western horizon. The Moon will set two minutes later at 7 p.m. Mercury will be 3.5 degrees above the Moon. For this and the next few evenings the waxing crescent Moon will appear most like an upward-facing bowl or a smile in the evening sky (for the Washington, D.C. area and similar latitudes, at least). This is called a “wet” or a “Cheshire” Moon. The term “wet Moon” appears to originate from Hawaiian mythology. It’s when the Moon appears like a bowl that could fill up with water. The time of year when this occurs as viewed from the latitudes of the Hawaiian Islands roughly corresponds with Kaelo the Water Bearer in Hawaiian astrology. As the year passes into summer, the crescent shape tilts, pouring out the water and causing the summer rains. The term “Cheshire Moon” is a reference to the smile of the Cheshire Cat in Lewis Carroll’s book “Alice’s Adventures in Wonderland.”
Saturday afternoon, March 1 At 4:14 p.m. EST, the Moon will be at perigee, its closest to Earth for this orbit.
Saturday evening, as evening twilight ends at 6:59 p.m. EST, the thin, waxing crescent Moon will be 13 degrees above the western horizon, with Venus 7 degrees to the upper right of the Moon. Mercury will appear about 10 degrees below the Moon. The Moon will set 76 minutes later at 8:15 p.m.
Tuesday, March 4 This is Mardi Gras (Fat Tuesday), which marks the end of the Carnival season that began on January 6. Don’t forget to march forth on March Fourth!
Thursday, March 6 The Moon will appear half-full as it reaches its first quarter at 11:32 a.m. EST.
Saturday morning, March 8 Just after midnight, Mercury will reach its greatest angular separation from the Sun as seen from Earth for this apparition (called greatest elongation).
Saturday evening, will be when Mercury will appear at its highest (6 degrees) above the western horizon as evening twilight ends at 7:06 p.m. EST. Mercury will set 34 minutes later at 7:40 p.m. This will also be the evening Mercury will have dimmed to the brightness as Mars, after which Mars will be the third brightest visible planet again.
Also on Saturday evening into Sunday morning, March 8 to 9, Mars will appear near the waxing gibbous Moon with the bright star Pollux (the brighter of the twin stars in the constellation Gemini) nearby. As evening twilight ends at 7:06 p.m. EST, Mars will be 1.5 degrees to the lower right of the Moon and Pollux will be 6 degrees to the lower left. As the Moon reaches its highest for the night 1.25 hours later at 8:22 p.m., Mars will be 1.5 degrees to the lower right of the Moon and Pollux will be 5.5 degrees to the upper left. By the time Mars sets on the northwestern horizon at 4:53 a.m., it will be 4 degrees to the lower left of the Moon and Pollux will be 3 degrees above the Moon.
Sunday morning, March 9 Daylight Saving Time begins. Don’t forget to reset your clocks (if they don’t automatically set themselves) as we “spring forward” to Daylight Saving Time! For much of the U.S., 2 to 3 a.m. on March 9, 2025, might be a good hour for magical or fictional events (as it doesn’t actually exist).
Tuesday evening into Wednesday morning, March 11 to 12 The bright star Regulus will appear close to the nearly full moon. As evening twilight ends at 8:09 p.m. EDT, Regulus will be 4 degrees to the lower right of the Moon. When the Moon reaches its highest for the night at 11:52 p.m., Regulus will be 3 degrees to the lower right. By the time morning twilight begins at 6:26 a.m., Regulus will be about one degree below the Moon.
Wednesday morning, March 12 Saturn will be passing on the far side of the Sun as seen from Earth, called a conjunction. Because Saturn orbits outside of the orbit of Earth it will be shifting from the evening sky to the morning sky. Saturn will begin emerging from the glow of dawn on the eastern horizon in early April (depending upon viewing conditions).
Wednesday evening, March 12 The planets Venus and Mercury will appear closest to each other low on the western horizon, 5.5 degrees apart. They will be about 5 degrees above the horizon as evening twilight ends at 8:10 p.m. EDT, and Mercury will set first 27 minutes later at 8:37 p.m.
Friday morning, March 14: Full Moon After Next The full moon after next will be at 2:55 a.m. EDT. This will be on Thursday evening from Pacific Daylight Time and Mountain Standard Time westward to the international date line in the mid Pacific. The Moon will appear full for about three days around this time, from Wednesday evening into Saturday morning.
Total Lunar Eclipse As the Moon passes opposite the Sun on March 14, it will move through Earth’s shadow, creating a total eclipse of the Moon. The Moon will begin entering the partial shadow Thursday night at 11:57 p.m., but the gradual dimming of the Moon will not be noticeable until it starts to enter the full shadow Friday morning at 1:09 a.m. The round shadow of Earth will gradually shift across the face of the Moon (from lower left to upper right) until the Moon is fully shaded beginning at 2:26 a.m.
The period of full shadow, or total eclipse, will last about 65 minutes, reaching the greatest eclipse at 2:59 a.m. and ending at 3:31 a.m. Even though it will be in full shadow, the Moon will still be visible. The glow of all of the sunrises and sunsets on Earth will give the Moon a reddish-brown hue, sometimes called a “blood” Moon (although this name is also used for one of the full moons near the start of fall). From 3:31 until 4:48 a.m., the Moon will exit the full shadow of Earth, with the round shadow of Earth again shifting across the face of the Moon (from upper left to lower right). The Moon will leave the last of the partial shadow at 6 a.m. ending this eclipse.
On Feb. 11, 2000, space shuttle Endeavour took to the skies on its 14th trip into space on the Shuttle Radar Topography Mission (SRTM). The international STS-99 crew included Commander Kevin Kregel, Pilot Dominic Gorie, and Mission Specialists Gerhard Thiele of Germany representing the European Space Agency, Janet Kavandi, Janice Voss, who served as payload commander on the mission, and Mamoru Mohri of the National Space Development Agency (NASDA) of Japan, now the Japan Aerospace Exploration Agency.
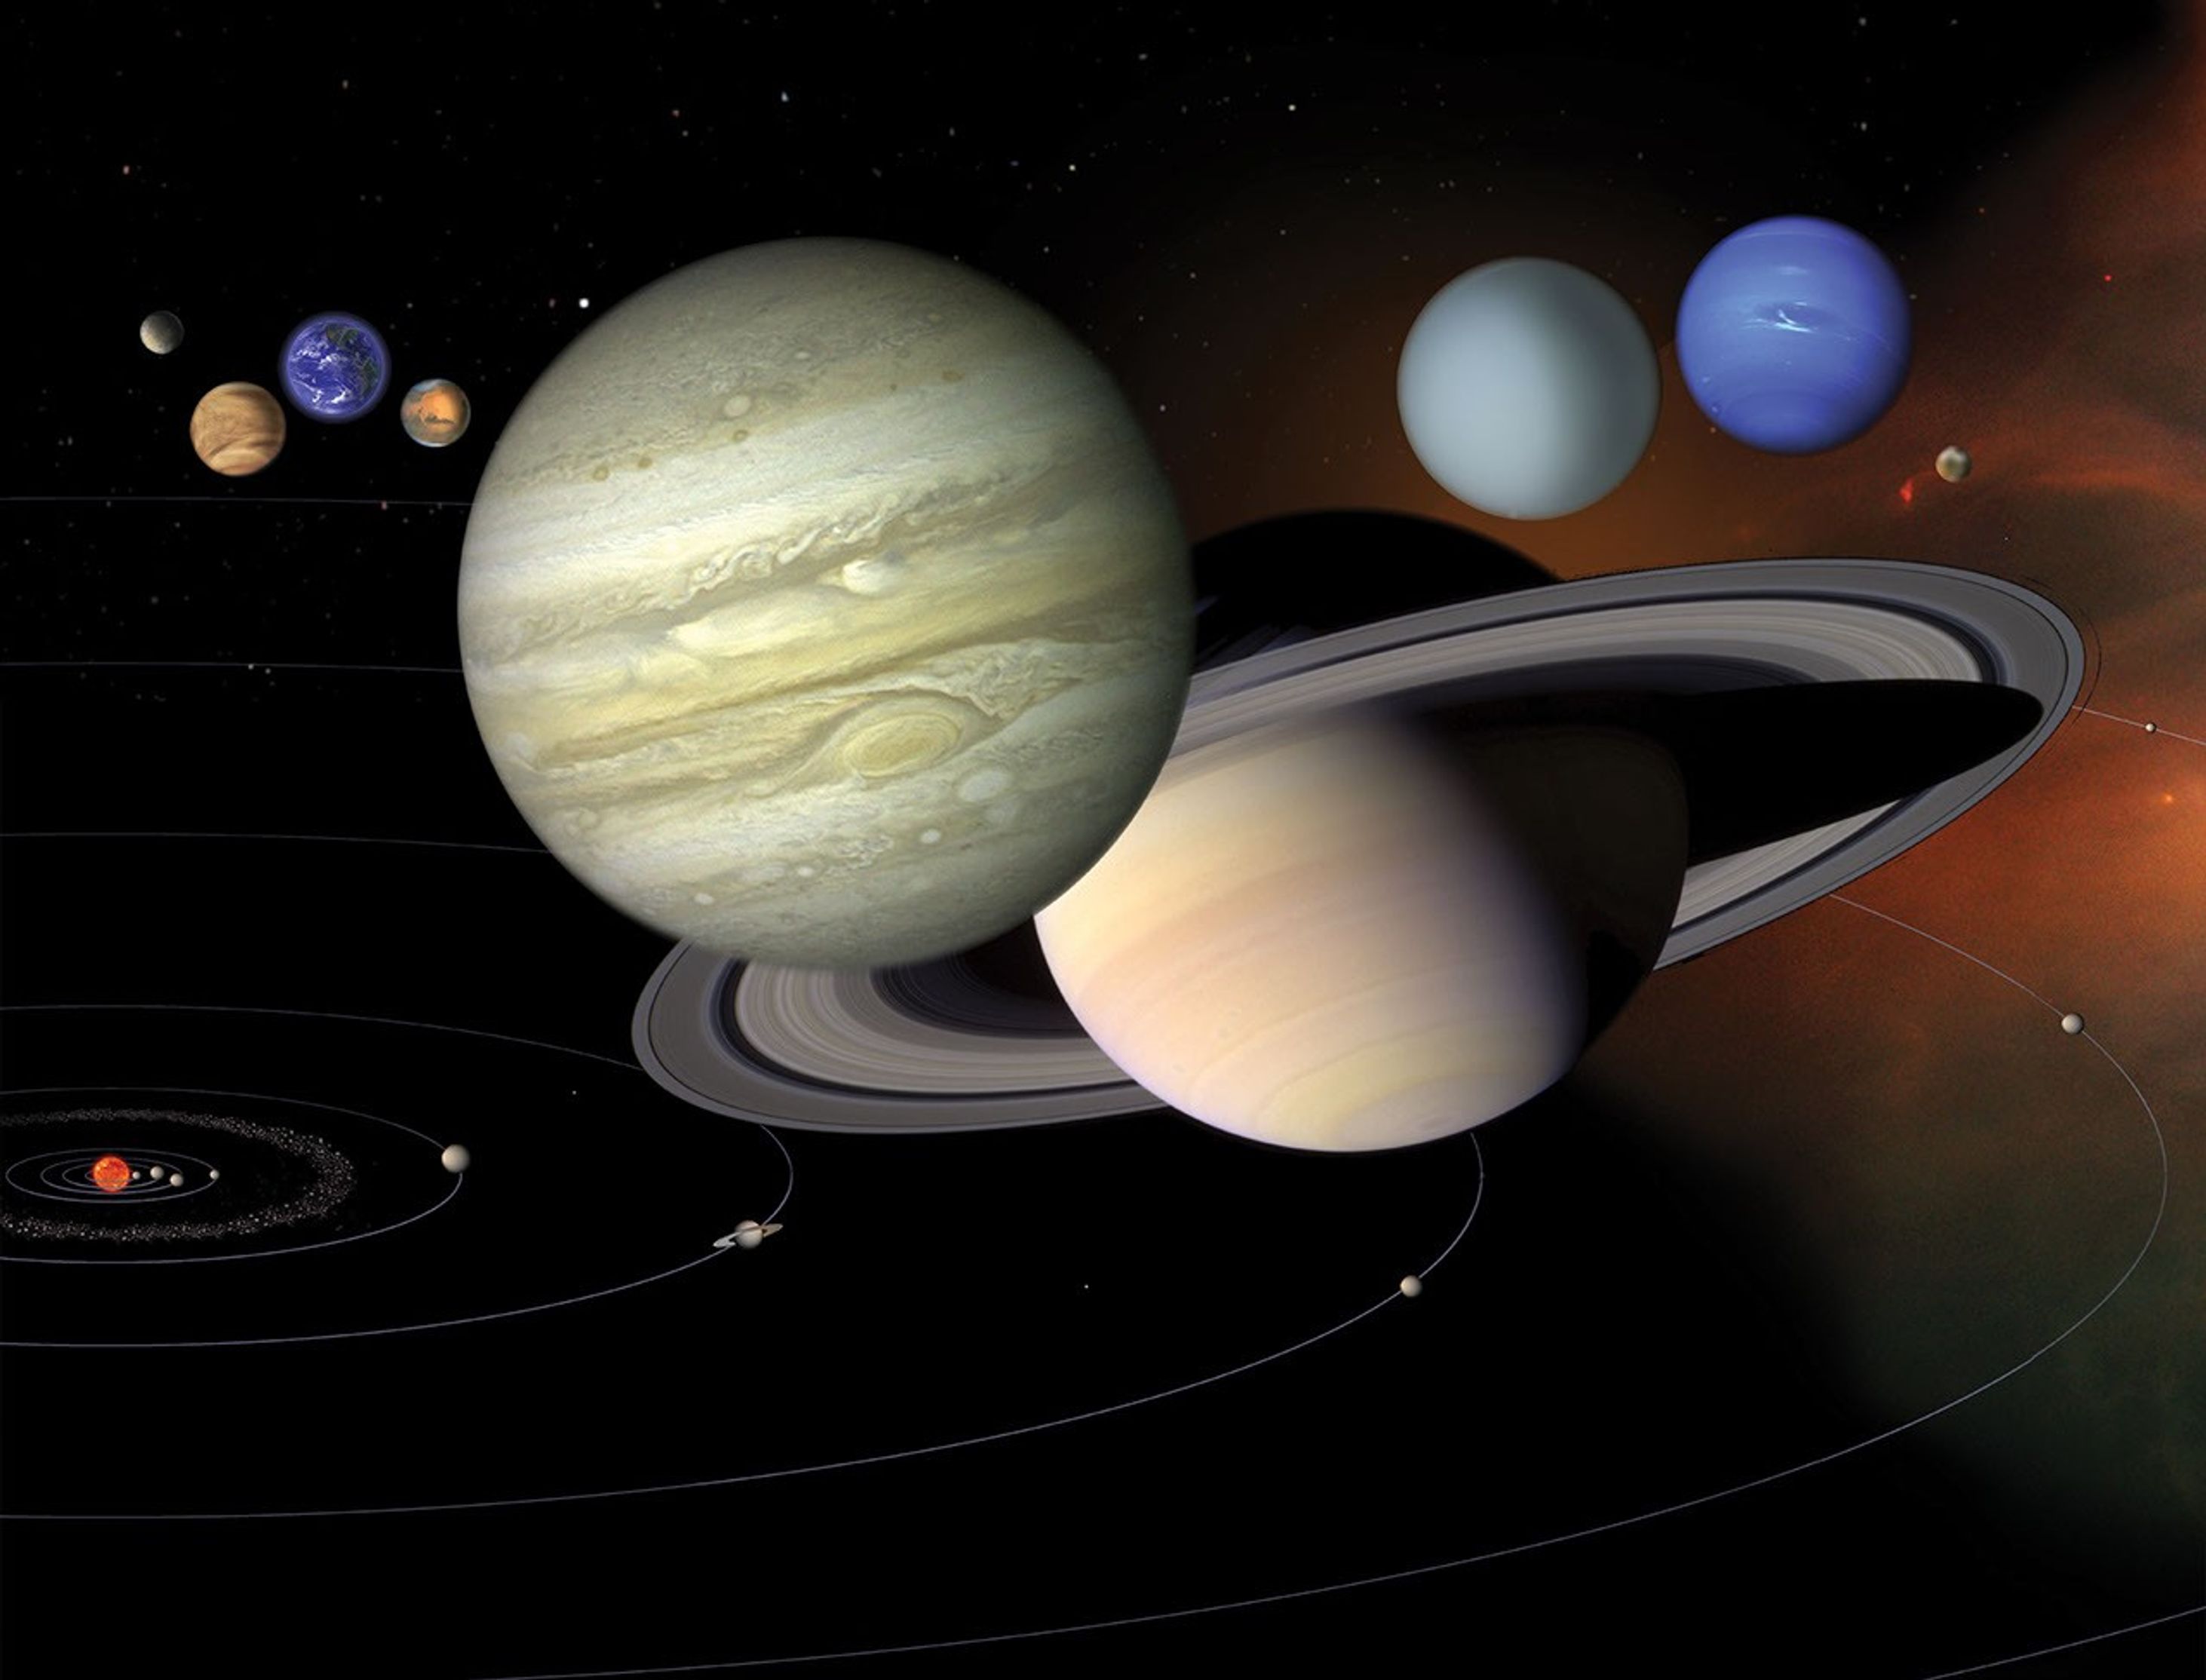
During their 11-day mission, the astronauts used the radar instruments in Endeavour’s payload bay to obtain elevation data on a near global scale. The data produced the most complete, high-resolution digital elevation model of the Earth. The SRTM comprised a cooperative effort among NASA with the Jet Propulsion Laboratory (JPL) in Pasadena, California, managing the project, the Department of Defense’s National Imagery and Mapping Agency, the German space agency, and the Italian space agency. Prior to SRTM, scientists had a more detailed topographic map of Venus than of the Earth, thanks to the Magellan radar mapping mission.
The STS-99 crew patch.
Official photo of the STS-99 crew of Janice Voss, left, Mamoru Mohri of the National Space Development Agency of Japan, now the Japan Aerospace Exploration Agency, Kevin Kregel, Dominic Gorie, Gerhard Thiele of Germany representing the European Space Agency, and Janet Kavandi.
The Shuttle Radar Topography Mission patch.
Schematic of the Space Radar Topography Mission payloads including the deployed mast.
The mast antenna during preflight processing.
NASA assigned the STS-99 crew in October 1998. For Kregel, selected by NASA as an astronaut in 1992, STS-99 marked his fourth trip to space, having served as pilot on STS-70 and STS-78 and commanded STS-87. Gorie and Kavandi, both selected in 1994, previously flew together as pilot and mission specialist, respectively, on STS-91, the final Shuttle Mir docking mission. Voss, selected in 1990, served as a mission specialist on STS-57 and STS-63, and as payload commander on STS-83 and STS-94. NASDA selected Mohri as an astronaut in 1985 and he previously flew as a payload specialist on STS-47, the Spacelab-J mission. Selected as an astronaut by the German space agency in 1987, Thiele joined the European Astronaut Corps in 1998, completing his first spaceflight on STS-99.
The SRTM used an innovative technique called radar interferometry to image the Earth’s landmasses at resolutions up to 30 times greater than previously achieved. Two of the synthetic aperture radar instruments comprising the SRTM payload had flown previously, on the STS-59 Shuttle Radar Laboratory-1 (SRL-1) and the STS-68 SRL-2 missions in April and October 1994, respectively. A second receiver antenna, placed at the end of a 200-foot deployable mast, enabled the interferometry during SRTM.
The SRTM payload in Endeavour’s cargo bay in the orbiter processing facility.
Endeavour rolls out to Launch Pad 39A.
The STS-99 crew walks out of crew quarters for the van ride to the launch pad.
Workers rolled Endeavour to the Vehicle Assembly Building on Dec. 2 for mating with its external tank and solid rocket boosters, and then out to Launch Pad 39A on Dec. 13. The astronauts traveled to Kennedy to participate in the Terminal Countdown Demonstration Test Jan. 11-14, returning afterwards to Houston for final training. They traveled back to Kennedy on Jan. 27 for the first launch attempt four days later. After two launch attempts, the STS-99 mission prepared to liftoff on Feb. 11, 2000.
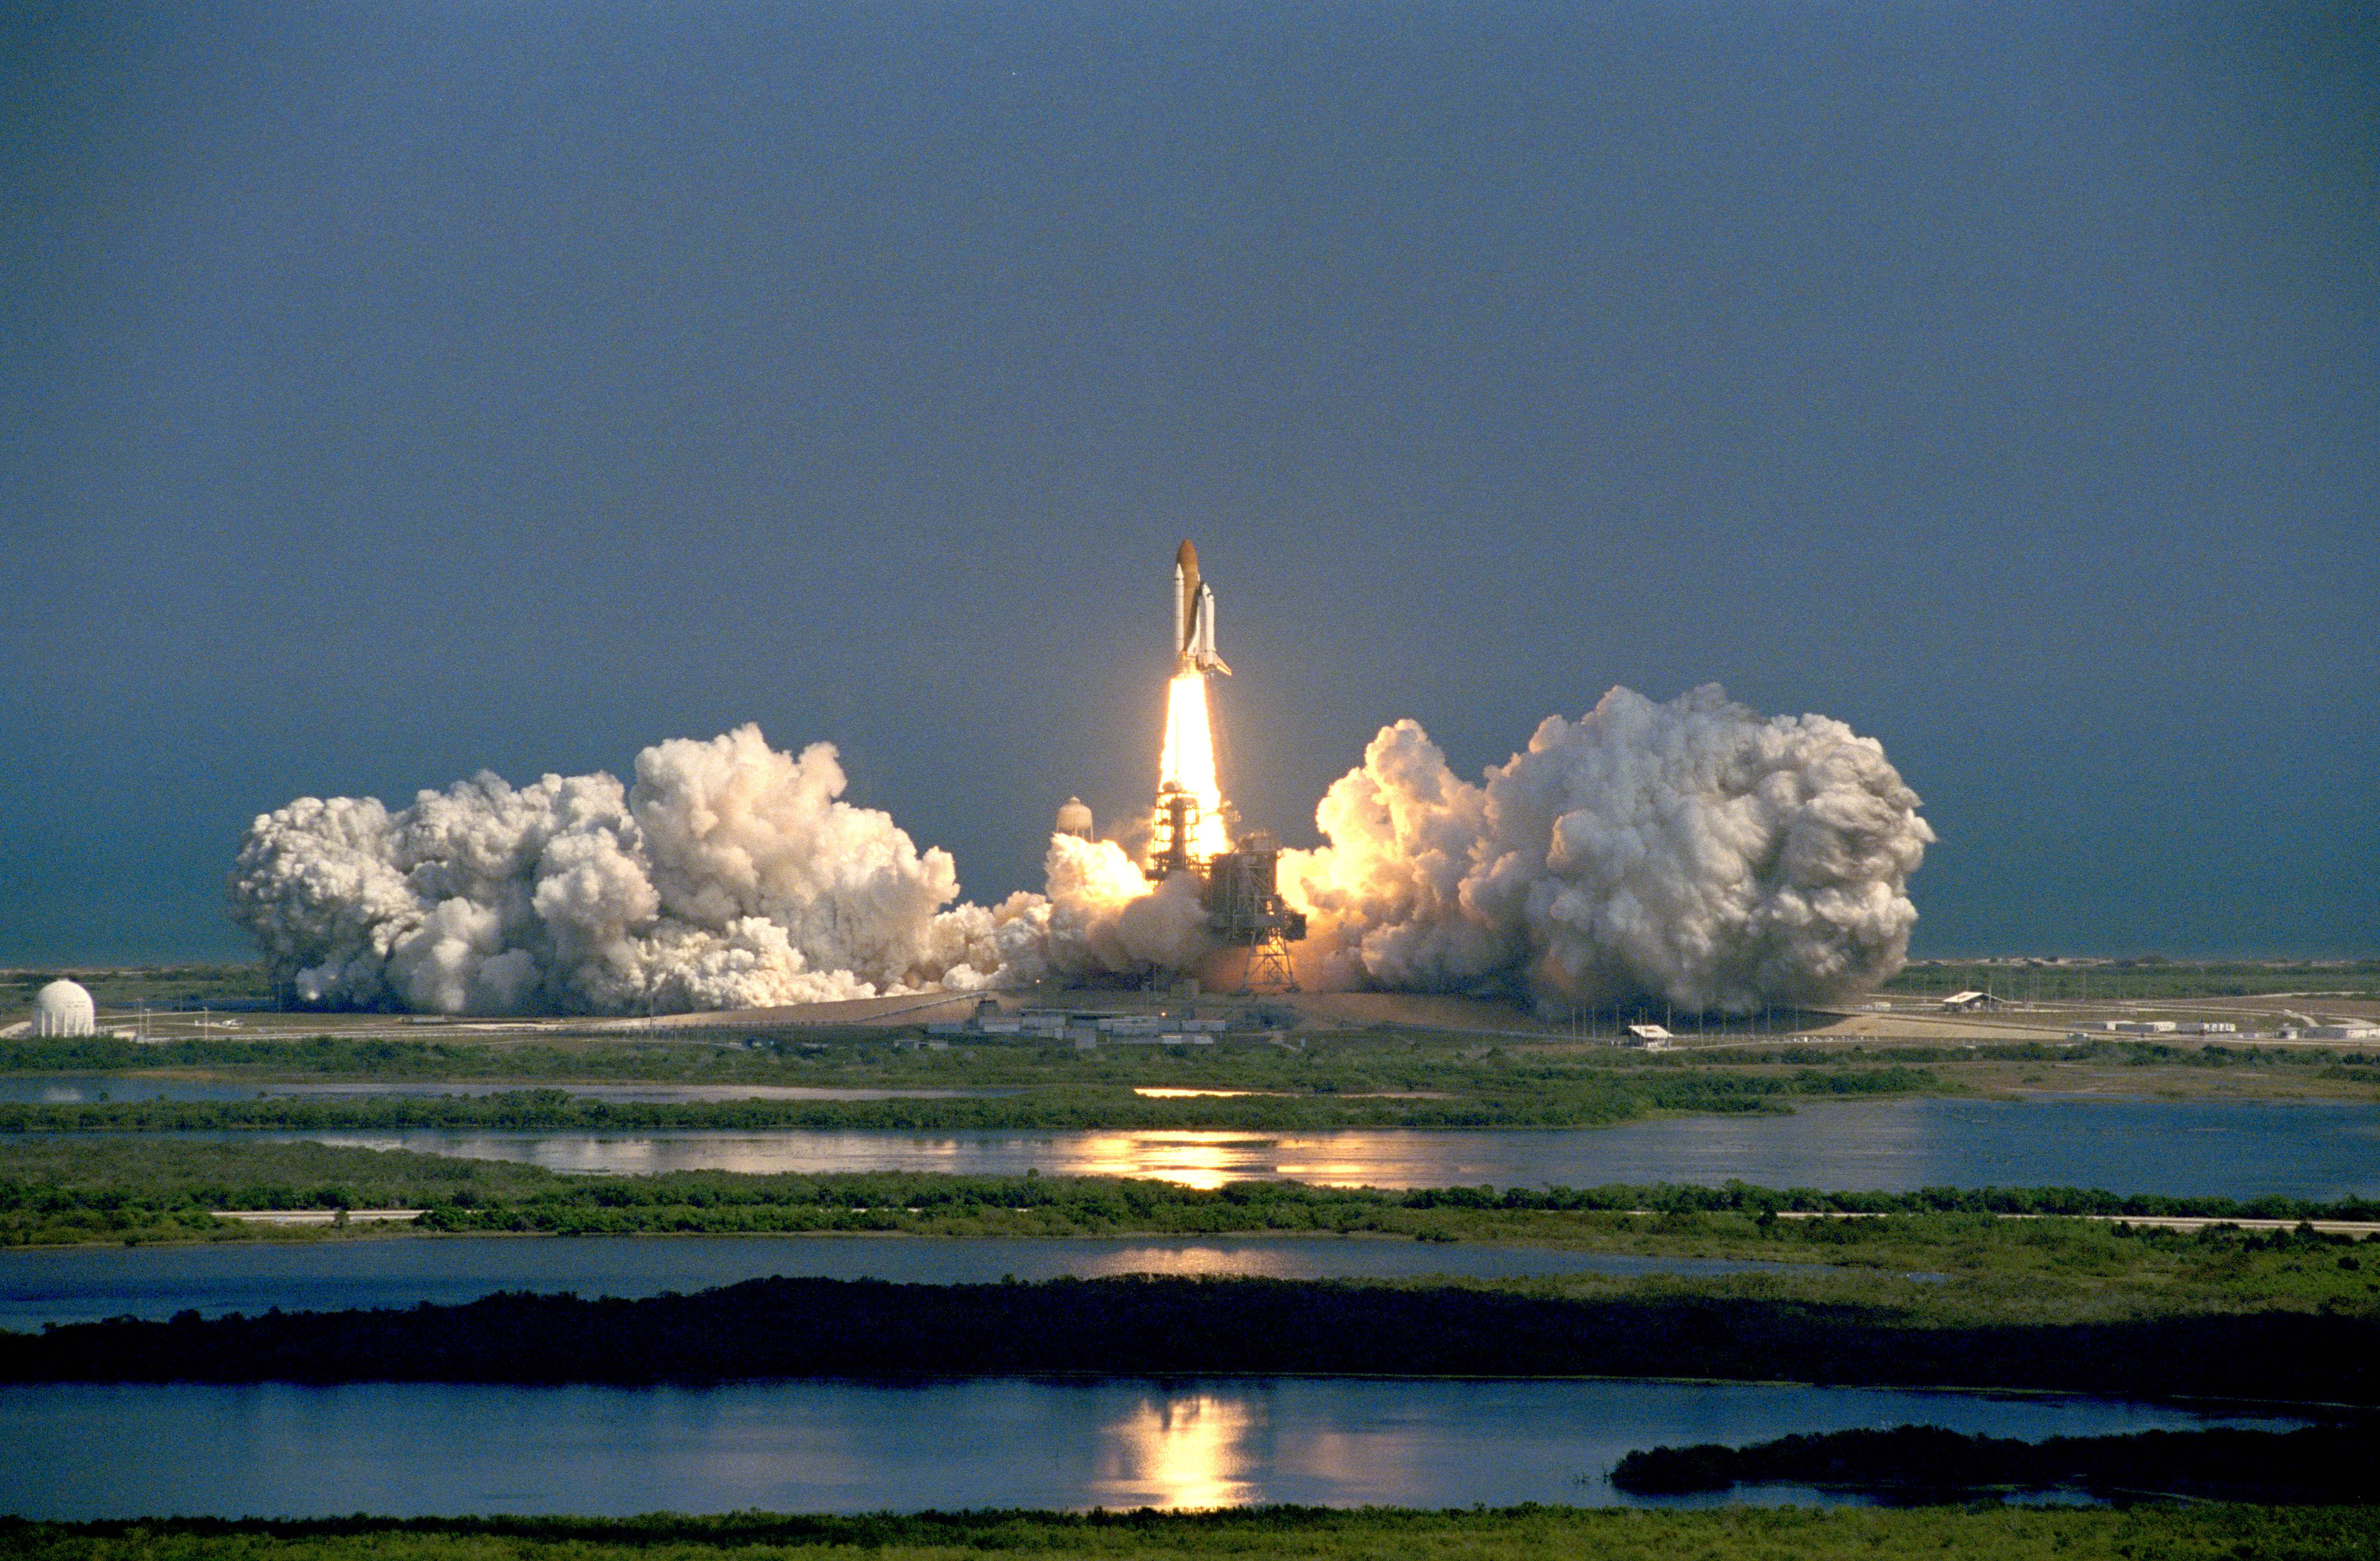
Liftoff! Space shuttle Endeavour takes to the skies to begin the STS-99 mission.
At 12:43 p.m. EST, Endeavour thundered into the sky from Kennedy’s Launch Pad 39A to begin the STS-99 mission. Thirty-seven minutes later, a brief firing of the orbiter’s two engines placed Endeavour in the proper 145-mile orbit for the radar scanning.
The SRTM instruments in Endeavour’s payload bay with the mast holding the second antenna receiver deployed at right.
The antenna at the end of the deployed mast.
STS-99 astronauts Janet Kavandi, left, Dominic Gorie, and Mamoru Mohri in Endeavour’s middeck.
Astronaut Janice Voss in the commander’s seat on Endeavour’s flight deck.
Astronauts Kevin Kregel, left, and Gerhard Thiele on Endeavour’s flight deck.
Shortly after reaching orbit, the crew opened the payload bay doors and deployed the shuttle’s radiators. Kavandi and Thiele turned on the instruments, deployed the 200-foot mast, and conducted initial checkouts of the radars. The crew split into two shifts to enable data collection around the clock during the mission. After overseeing the initial activation of the radars, the red shift of Kregel, Kavandi, and Thiele began their first sleep period as the blue shift of Gorie, Voss, and Mohri picked up with activation and began the first data takes.
The major crew activity for SRTM involved changing tapes every 30 minutes. The SRTM generated 332 high density tapes during more than 222 hours of data collection and these recordings covered 99.96 percent of the planned observations. Data collection finished on the mission’s 10th flight day, after which the astronauts reeled the mast back into its container in the payload bay.
EarthKAM image of the greater Boston area.
The EarthKAM camera mounted in a space shuttle window.
STS-99 crew Earth observation photograph of El Paso, Texas, and Ciudad Juarez, Mexico.
STS-99 crew Earth observation photograph of the Galapagos Islands.
STS-99 crew Earth observation photograph of the greater New York area.
STS-99 crew Earth observation photograph of Erg Chech, or sand sea, in the Algerian Sahara.
NASA’s EarthKAM program enabled middle school students to remotely take photographs of the Earth using an electronic still camera mounted in one of the shuttle’s windows. The University of California at San Diego houses the control center for EarthKAM, linked with middle schools via the Internet. Students choose Earth targets of interest, and the camera takes photos of that region as the shuttle passes overhead. A then-record 75 schools from around the world participated in the EarthKAM project on STS-99, the camera returning 2,715 images of the Earth.
The STS-99 astronauts also spent time taking photographs of the Earth using handheld cameras and the high inclination orbit enabled views of some parts of the Earth rarely seen by shuttle astronauts.
The six-person STS-99 crew pose for their inflight photo.
Kevin Kregel guides Endeavour to a smooth touchdown on the Shuttle Landing Facility at NASA’s Kennedy Space Center in Florida.
The STS-99 crew poses with NASA Administrator Daniel Goldin under Endeavour at the Shuttle Landing Facility at NASA’s Kennedy Space Center in Florida.
Kevin Kregel addresses the crowd at Houston’s Ellington Field during the welcome home ceremony for the STS-99 crew.
On Feb. 22, the crew closed Endeavour’s payload bay doors, donned their launch and entry suits, and strapped themselves into their seats for entry and landing. Kregel piloted Endeavour to a smooth landing on Kennedy’s Shuttle Landing Facility. The crew had flown 181 orbits around the Earth in 11 days, 5 hours, and 39 minutes. Enjoy the crew narrate a video about the STS-99 mission.
Postscript
Final coverage map for the SIR-C radar, indicating 99.96 percent coverage of planned land mass targets, with many areas imaged more than once.
False-color image generated from SRTM data of the island of Oahu.
False-color image generated from SRTM data of Mt. Cotopaxi in Ecuador, the tallest active volcano in the world.
During the 11-day mission, SRTM collected more than one trillion data points, generating 12.3 terabytes of 3-D data of the Earth. Earnest Paylor, SRTM program scientist at NASA Headquarters in Washington, D.C., called the mission “a magnificent accomplishment.” He cited that SRTM imaged by radar equatorial regions of the Earth previously unmapped due to constant cloud cover.
A massive crane lifts NASA’s Orion spacecraft out of the Final Assembly and System Testing cell and moves it to the altitude chamber to complete further testing on Thursday, Nov. 7, 2024, inside the Neil A. Armstrong Operations and Checkout building at NASA’s Kennedy Space Center in Florida. The altitude chamber simulates deep space vacuum conditions, and the testing will provide additional data to augment data gained during testing earlier this summer.
Credit: NASA/Kim Shiflett
Media are invited to visit NASA’s Kennedy Space Center in Florida, to capture imagery of the agency’s Artemis II Orion spacecraft and twin SLS (Space Launch System) solid rocket boosters for the first crewed Artemis mission around the Moon. The event is targeted for Friday, March 7.
Subject matter experts from NASA and industry partners will be available for interviews.
Space is limited for this event. The deadline for foreign national media to apply is 11:59 p.m. EST, Thursday, Feb. 13. The deadline for U.S. citizens is 11:59 p.m. EST, Thursday, Feb. 20.
All accreditation requests must be submitted online at:
Credentialed media will receive a confirmation email upon approval. NASA’s media accreditation policy is available online. For questions about accreditation, or to request logistical support, email: ksc-media-accreditat@mail.nasa.gov. For other questions, please contact NASA’s Kennedy Space Center newsroom at: 321-867-2468.
Para obtener información sobre cobertura en español en el Centro Espacial Kennedy o si desea solicitor entrevistas en español, comuníquese con Antonia Jaramillo o Messod Bendayan a: antonia.jaramillobotero@nasa.gov o messod.c.bendayan@nasa.gov.
Through Artemis, NASA will send astronauts to explore the Moon for scientific discovery, economic benefits, and build the foundation for the first crewed missions to Mars.
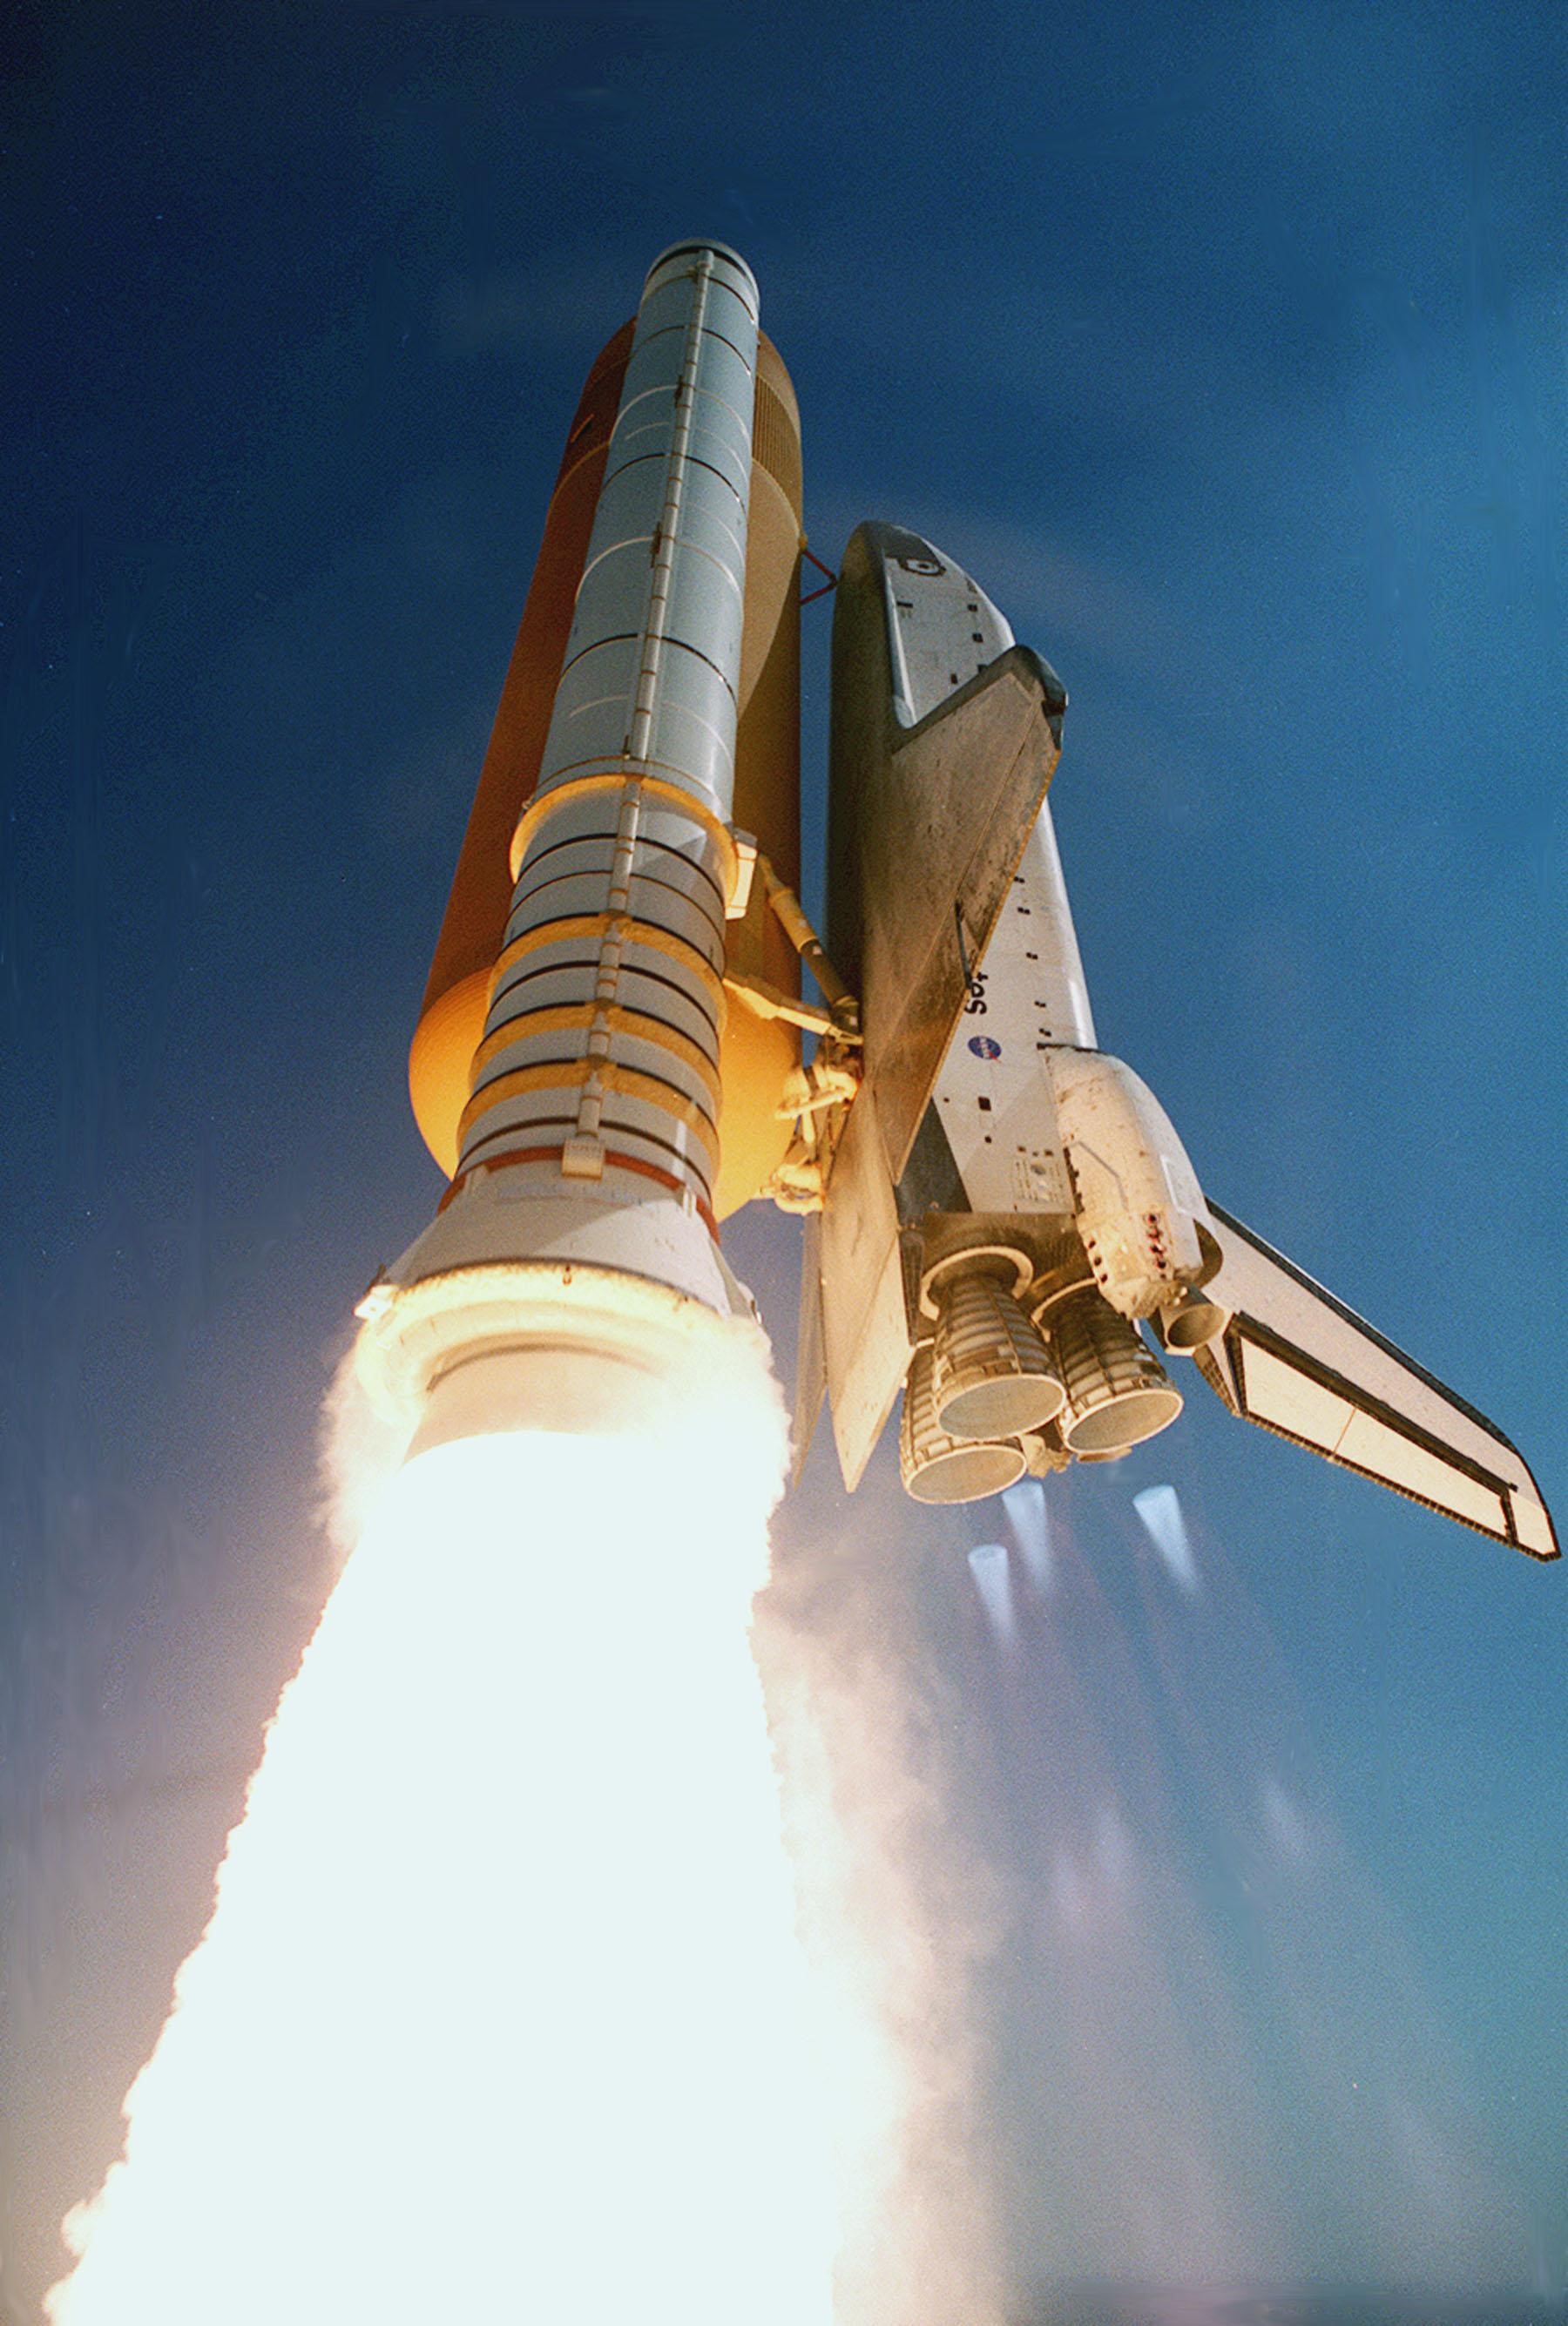
Blue mach diamonds from the main engine nozzles and bright exhaust from the solid rocket boosters mark the successful launch of space shuttle Endeavour 25 years ago on Feb. 11, 2000. The STS-99 mission crew – including astronauts from NASA, the National Space Development Agency of Japan (NASDA), and the European Space Agency (ESA) – were aboard the shuttle.
This mission saw the deployment of the Shuttle Radar Topography Mission mast and the antenna turned to its operation position. After a successful checkout of the radar systems, mapping began less than 12 hours after launch. Crewmembers split into two shifts so they could work around the clock.
Also aboard Endeavour was a student experiment called EarthKAM, which took 2,715 digital photos during the mission through an overhead flight-deck window. The NASA-sponsored program lets middle school students select photo targets and receive the images via the Internet.
NASA’s SpaceX Crew-10 members (from left to right) Roscosmos cosmonaut Kirill Peskov, NASA astronauts Nichole Ayers and Anne McClain, and JAXA (Japan Aerospace Exploration Agency) astronaut Takuya Onishi pictured training at SpaceX in Hawthorne, California.
Credit: SpaceX
Media accreditation is open for the launch of NASA’s 10th rotational mission of a SpaceX Falcon 9 rocket and Dragon spacecraft, carrying astronauts to the International Space Station for a science expedition. The agency’s SpaceX Crew-10 mission is targeting launch on Wednesday, March 12, from Launch Complex 39A at NASA’s Kennedy Space Center in Florida.
The launch will carry NASA astronauts Anne McClain as commander and Nichole Ayers as pilot, along with JAXA (Japan Aerospace Exploration Agency) astronaut Takuya Onishi and Roscosmos cosmonaut Kirill Peskov as mission specialists. This is the first spaceflight for Ayers and Peskov, and the second mission to the orbiting laboratory for McClain and Onishi.
Media accreditation deadlines for the Crew-10 launch as part of NASA’s Commercial Crew Program are as follows:
International media without U.S. citizenship must apply by 11:59 p.m. on Thursday, Feb. 13.
U.S. media and U.S. citizens representing international media organizations must apply by 11:59 p.m. EST on Sunday, Feb. 23.
All accreditation requests must be submitted online at:
NASA’s media accreditation policy is online. For questions about accreditation or special logistical requests, email: ksc-media-accreditat@mail.nasa.gov. Requests for space for satellite trucks, tents, or electrical connections are due by Friday, Feb. 21.
For other questions, please contact NASA Kennedy’s newsroom at: 321-867-2468.
Para obtener información sobre cobertura en español en el Centro Espacial Kennedy o si desea solicitar entrevistas en español, comuníquese con Antonia Jaramillo: 321-501-8425, o Messod Bendayan: 256-930-1371.
For launch coverage and more information about the mission, visit:
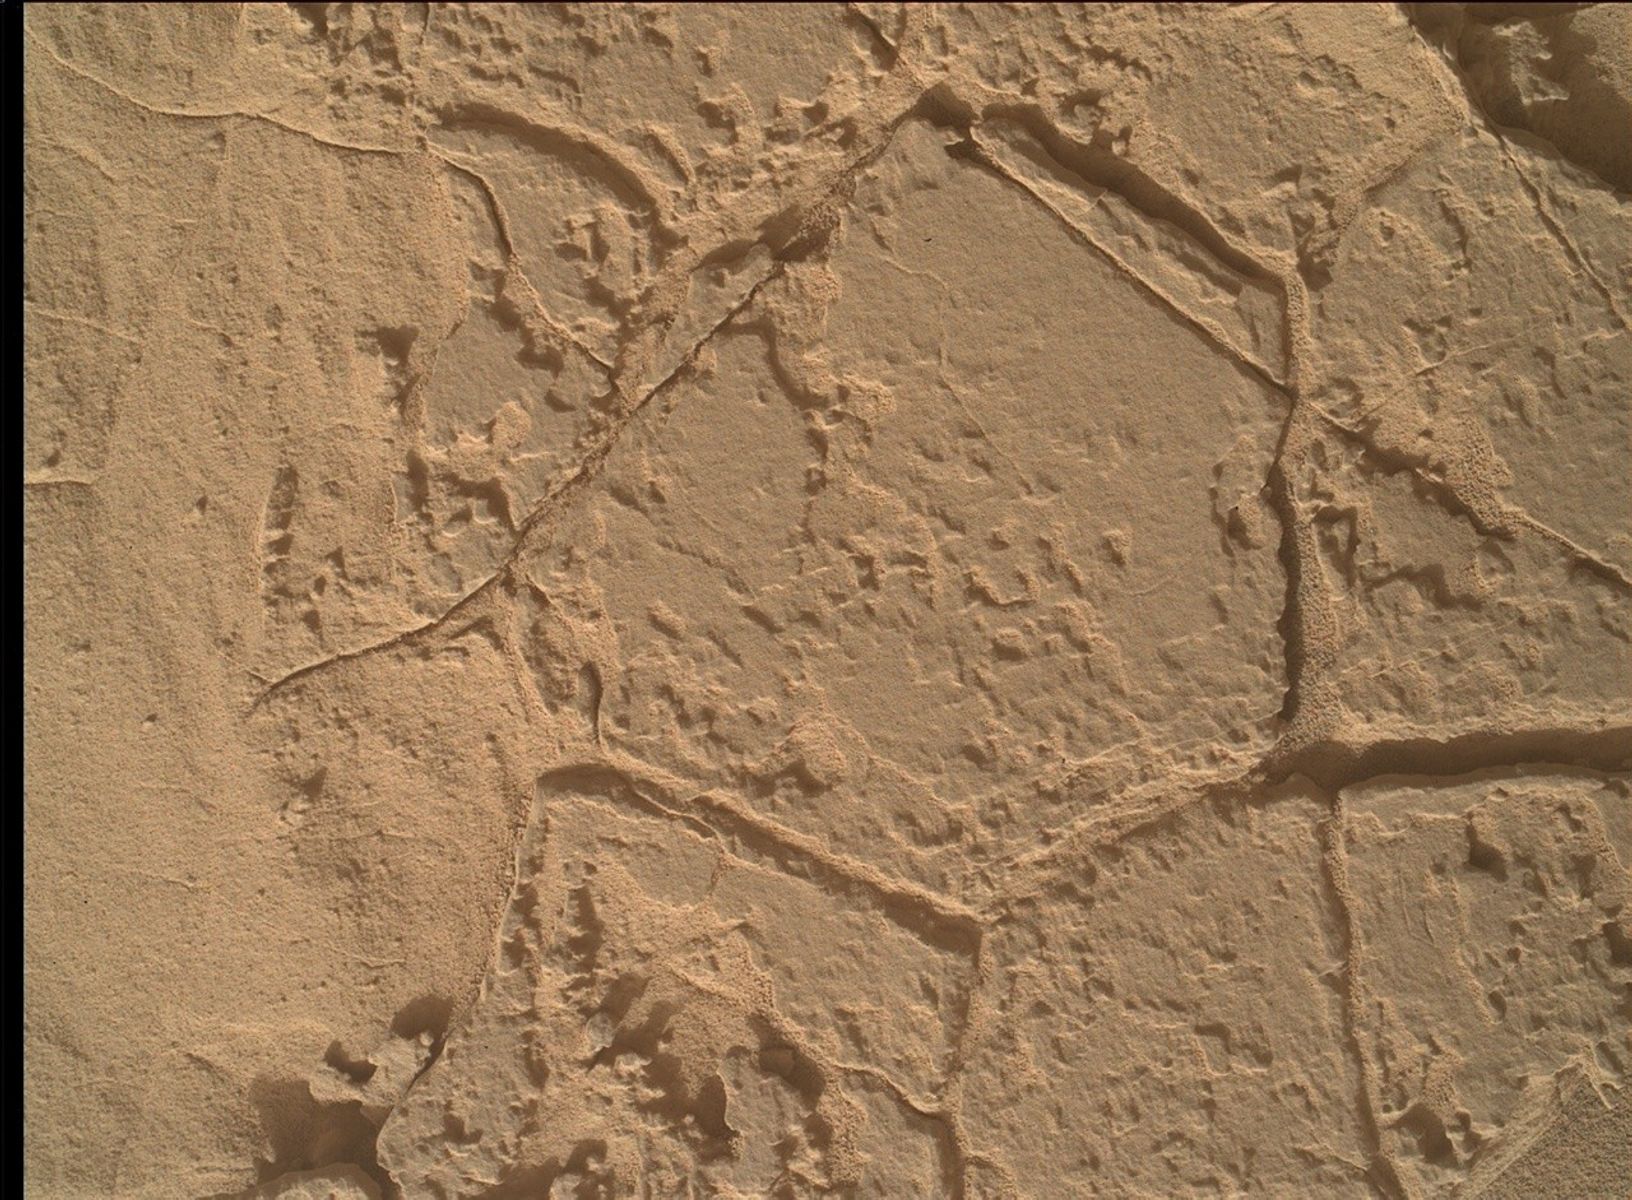
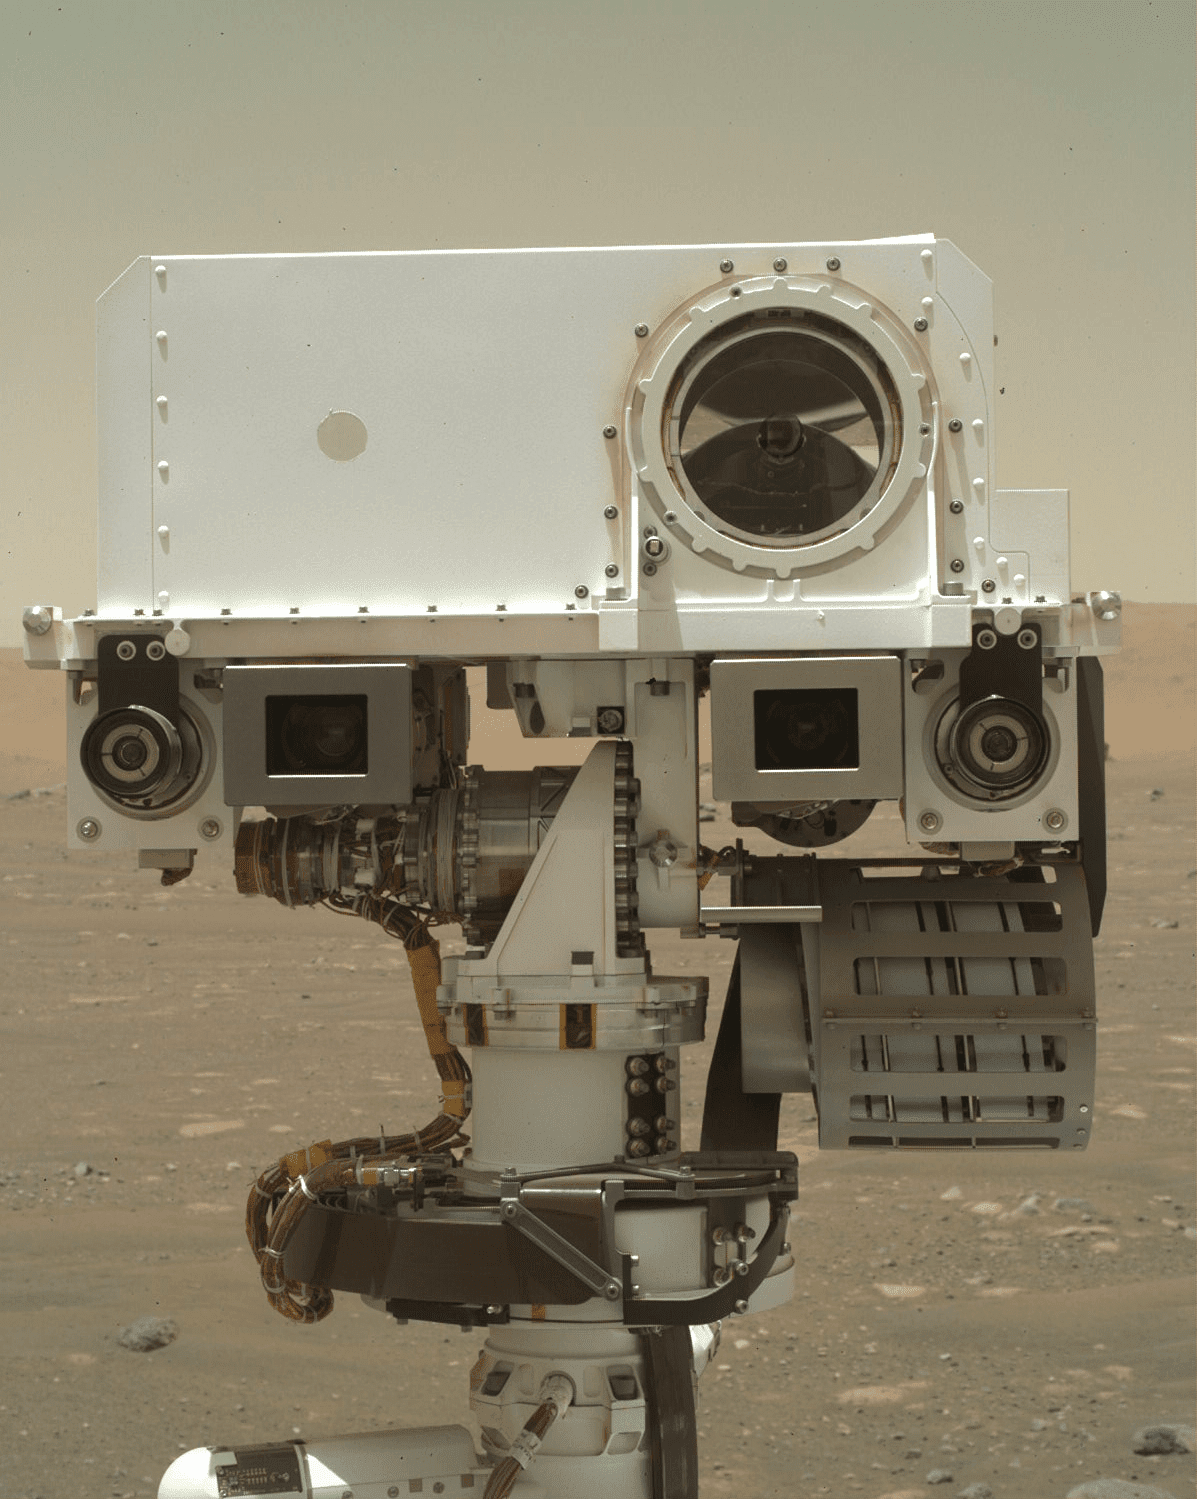
Sols 4447–4449: Looking Back at the Marker Band Valley
NASA’s Mars rover Curiosity captured this image of its workspace using the rover’s Rear Hazard Avoidance Camera (Rear Hazcam) on sol 4447 — or Martian day 4,447 of the Mars Science Laboratory mission — on Feb. 8, 2025, at 13:54:13 UTC.
NASA/JPL-Caltech
Earth planning date: Friday, Feb. 7, 2025
We are continuing our merry way alongside “Texoli” butte, heading toward the boxworks feature in the distance, our next major waypoint. This is a series of large-scale ridges, which appear from orbital data to be a complex fracture network.
Of course, we don’t actually expect to get there until late fall 2025, at the earliest. Our drives are long right now (the weekend plan has a 50-meter drive, or about 164 feet) but we are still taking the time to document all of the wonderful geology as we go, and not just speeding past all of the cool things!
As Conor mentioned in Wednesday’s blog, power is becoming a challenge right now. Those of us in the northern hemisphere might be thinking (eagerly anticipating!) about the return of Spring but Mars is heading into colder weather, meaning we need to use more power for warming up the rover. However, we are also in a very interesting cloud season (as Conor mentioned), so the environmental theme group (ENV) are keen to do lots of imaging right now. This means very careful planning and negotiating between ENV and the geology theme group (GEO) to make the most of the power we do have. Luckily, this plan has something for everyone.
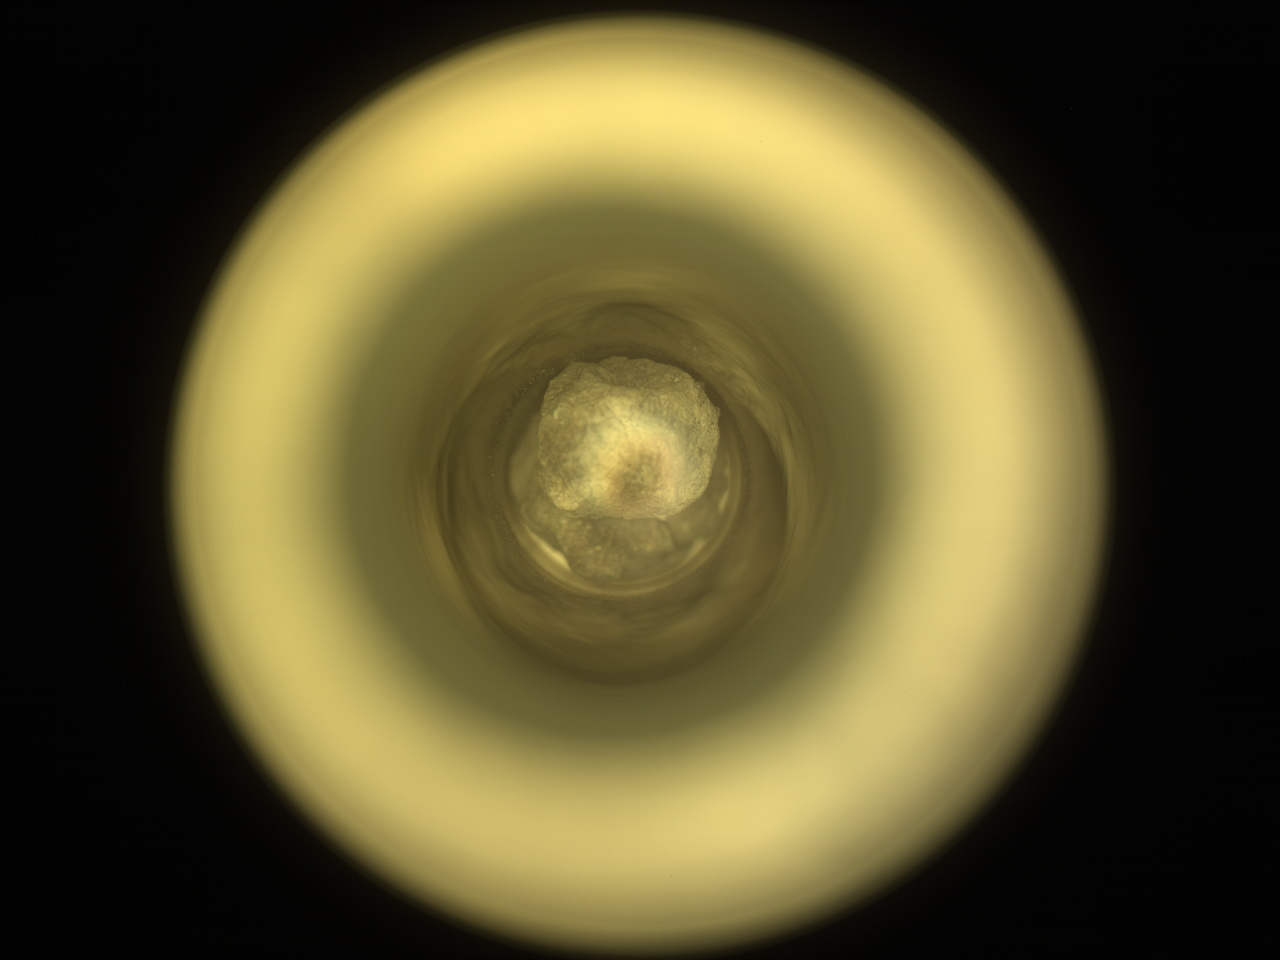
The GEO group was handed a weekend workspace containing a jumble of rocks — some layered, some not. None of the rocks were very large but we were able to plan APXS and MAHLI on a brushed rock surface at “Aliso Canyon” and on a small, flat unbrushed target, “Bridge to Nowhere,” close to the rover. ChemCam will use the LIBS laser to shoot three bedrock targets, sampling regular bedrock at “Newcomb,” some cracked bedrock at “Devore” and some of the more layered material at “Rubio Canyon.” Mastcam will document the ChemCam LIBS targets. In addition to the cloud imaging, we have lots of other imaging in this plan. We are in position right now to look back down at the “Marker Band Valley,” which we first entered almost a thousand sols ago! Before we go too much further along the side of Texoli butte and lose sight of the Marker Band Valley for some time, both ChemCam and Mastcam will take advantage of this to image the Marker Band Valley and the “Marker Band.” Other images include ChemCam remote images of cap rocks in the distance and two Mastcams of near-field (i.e., close to the rover) troughs.
Written by Catherine O’Connell-Cooper, Planetary Geologist at University of New Brunswick
This view from space shuttle Columbia shows Mount Everest, which reaches 29,028 feet in elevation (8,848 meters), along with many glaciers. Mount Everest is to the left of the V-shaped valley.
NASA
Crew aboard space shuttle Columbia captured this image of Mount Everest on Nov. 30, 1996, during the STS-80 mission. STS-80, the final shuttle flight of 1996, was highlighted by the successful deployment, operation, and retrieval of two free-flying research spacecraft.
NASA has selected SpaceX of Starbase, Texas, to provide the launch service for the agency’s Pandora mission, which will study at least 20 known exoplanets and their host stars to find out how changes in stars affect our observations of exoplanet atmospheres.
The selection is part of NASA’s Venture-Class Acquisition of Dedicated and Rideshare (VADR) launch services contract. This contract allows the agency to make fixed-price indefinite-delivery/indefinite-quantity awards during VADR’s five-year ordering period, with a maximum total value of $300 million across all contracts.
During its one-year primary mission, Pandora will observe each exoplanet 10 times, observing for 24 hours each visit. It will capture critical data about the planet and its host star during transits, an event where a planet crosses in front of the star it orbits.
The satellite will use an innovative 17-inch (45-centimeter)-wide all-aluminum telescope to simultaneously measure the visible and near-infrared brightness of the host star and obtain near-infrared spectra of the transiting planet. This will allow scientists to cleanly separate star and planetary signals, knowledge that will enhance observations from NASA’s James Webb Space Telescope and future missions searching for habitable worlds, like the agency’s Habitable Worlds Observatory.
Pandora is a joint effort between NASA’s Goddard Space Flight Center in Greenbelt, Maryland, and Lawrence Livermore National Laboratory in California. The Astrophysics Pioneers program, from the Astrophysics Division at NASA Headquarters in Washington, funds Pandora and other astrophysics science missions using smaller, lower cost hardware and payloads. NASA’s Launch Services Program, based at the agency’s Kennedy Space Center in Florida, manages the VADR contract.
To learn more about NASA’s Pandora mission, visit:
This study showed that the International Space Station’s ECOSTRESS instrument estimates of evapotranspiration (transfer of water to the atmosphere from Earth’s surface and plants) are comparable to ground-based reference values. This finding suggests space measurements could provide guidance for improved water management on large scales.
Worsening droughts due to climate change require better water management. Evapotranspiration is a critical part of the hydrologic cycle, but data are lacking on local water conditions and demands. California’s Eastern Municipal Water District uses the ground-based California Irrigation Management Information System to track evapotranspiration, but it has limited spatial coverage and consistency. Space-based estimates could be better and more consistent.
The ECOSTRESS instrument, the white box in the center, is visible on the outside of the station.
NASA
Four-legged robotic retrievers
Space station crew members successfully located and retrieved an object in a simulated Mars environment using a remotely controlled four-legged robot, Bert. Legged robots could provide the ability to explore and survey different extraterrestrial surfaces on future missions.
On uneven lunar and planetary surfaces, robots with legs could explore areas inaccessible to wheeled rovers. Surface Avatar, an investigation from ESA (European Space Agency), evaluated remote control of multiple robots in space, providing information on how human operators respond to physical feedback (such as feeling a bump when a robot arm makes contact) and identifying challenges for orbit-to-ground remote operation of robots. The German Aerospace Center is developing Bert.
ESA astronaut Samantha Cristoforetti practices maneuvers for the Surface Avatar investigation.
NASA
Technology supports atmospheric studies
Researchers found that the Compact Thermal Imager (CTI) on the space station produced scientifically useful imagery of atmospheric phenomena, including gravity waves, clouds, and volcanic plumes. This technology could change current practices and instrument design for remote sensing of Earth from space.
The CTI is mounted on hardware for Robotic Refueling Mission 3, which tested technology for the robotic transfer and storage of cryogenic fluids in microgravity. The station’s orbit provides near-global coverage and CTI has reduced size, energy use, and cost. Its images can measure fires, ice sheets, glaciers, and snow surface temperatures on the ground and the transfer of water from soil and plants into the atmosphere.
NASA astronaut Anne McClain and CSA astronaut David Saint-Jacques installing the RRM3 hardware.
Preparations for Next Moonwalk Simulations Underway (and Underwater)
Cliffs slope into the ocean in San Simeon, California. All along the state’s dynamic coastline, land is inching down and up due to natural and human-caused factors. A better understanding of this motion can help communities prepare for rising seas.
NASA/JPL-Caltech
The elevation changes may seem small — amounting to fractions of inches per year — but they can increase or decrease local flood risk, wave exposure, and saltwater intrusion.
Tracking and predicting sea level rise involves more than measuring the height of our oceans: Land along coastlines also inches up and down in elevation. Using California as a case study, a NASA-led team has shown how seemingly modest vertical land motion could significantly impact local sea levels in coming decades.
By 2050, sea levels in California are expected to increase between 6 and 14.5 inches (15 and 37 centimeters) higher than year 2000 levels. Melting glaciers and ice sheets, as well as warming ocean water, are primarily driving the rise. As coastal communities develop adaptation strategies, they can also benefit from a better understanding of the land’s role, the team said. The findings are being used in updated guidance for the state.
“In many parts of the world, like the reclaimed ground beneath San Francisco, the land is moving down faster than the sea itself is going up,” said lead author Marin Govorcin, a remote sensing scientist at NASA’s Jet Propulsion Laboratory in Southern California.
The new study illustrates how vertical land motion can be unpredictable in scale and speed; it results from both human-caused factors such as groundwater pumping and wastewater injection, as well as from natural ones like tectonic activity. The researchers showed how direct satellite observations can improve estimates of vertical land motion and relative sea level rise. Current models, which are based on tide gauge measurements, cannot cover every location and all the dynamic land motion at work within a given region.
Local Changes
Researchers from JPL and the National Oceanic and Atmospheric Administration (NOAA) used satellite radar to track more than a thousand miles of California coast rising and sinking in new detail. They pinpointed hot spots — including cities, beaches, and aquifers — at greater exposure to rising seas now and in coming decades.
To capture localized motion inch by inch from space, the team analyzed radar measurements made by ESA’s (the European Space Agency’s) Sentinel-1 satellites, as well as motion velocity data from ground-based receiving stations in the Global Navigation Satellite System. Researchers compared multiple observations of the same locations made between 2015 to 2023 using a processing technique called interferometric synthetic aperture radar (InSAR).
Scientists mapped land sinking (indicated in blue) in coastal California cities and in parts of the Central Valley due to factors like soil compaction, erosion, and groundwater withdrawal. They also tracked uplift hot spots (shown in red), including in Long Beach, a site of oil and gas production.
NASA Earth Observatory
Homing in on the San Francisco Bay Area — specifically, San Rafael, Corte Madera, Foster City, and Bay Farm Island — the team found the land subsiding at a steady rate of more than 0.4 inches (10 millimeters) per year due largely to sediment compaction. Accounting for this subsidence in the lowest-lying parts of these areas, local sea levels could rise more than 17 inches (45 centimeters) by 2050. That’s more than double the regional estimate of 7.4 inches (19 centimeters) based solely on tide gauge projections.
Not all coastal locations in California are sinking. The researchers mapped uplift hot spots of several millimeters per year in the Santa Barbara groundwater basin, which has been steadily replenishing since 2018. They also observed uplift in Long Beach, where fluid extraction and injection occur with oil and gas production.
The scientists further calculated how human-induced drivers of local land motion increase uncertainties in the sea level projections by up to 15 inches (40 centimeters) in parts of Los Angeles and San Diego counties. Reliable projections in these areas are challenging because the unpredictable nature of human activities, such as hydrocarbon production and groundwater extraction, necessitating ongoing monitoring of land motion.
Fluctuating Aquifers, Slow-Moving Landslides
In the middle of California, in the fast-sinking parts of the Central Valley (subsiding as much as 8 inches, or 20 centimeters, per year), land motion is influenced by groundwater withdrawal. Periods of drought and precipitation can alternately draw down or inflate underground aquifers. Such fluctuations were also observed over aquifers in Santa Clara in the San Francisco Bay Area, Santa Ana in Orange County, and Chula Vista in San Diego County.
Along rugged coastal terrain like the Big Sur mountains below San Francisco and Palos Verdes Peninsula in Los Angeles, the team pinpointed local zones of downward motion associated with slow-moving landslides. In Northern California they also found sinking trends at marshlands and lagoons around San Francisco and Monterey bays, and in Sonoma County’s Russian River estuary. Erosion in these areas likely played a key factor.
Scientists, decision-makers, and the public can monitor these and other changes occurring via the JPL-led OPERA (Observational Products for End-Users from Remote Sensing Analysis) project. The OPERA project details land surface elevational changes across North America, shedding light on dynamic processes including subsidence, tectonics, and landslides.
The OPERA project will leverage additional state-of-the-art InSAR data from the upcoming NISAR (NASA-Indian Space Research Organization Synthetic Aperture Radar) mission, expected to launch within the coming months.
This artist’s concept visualizes a super-Neptune world orbiting a low-mass star near the center of our Milky Way galaxy. Scientists recently discovered such a system that may break the current record for fastest exoplanet system, traveling at least 1.2 million miles per hour, or 540 kilometers per second.
NASA/JPL-Caltech/R. Hurt (Caltech-IPAC)
Astronomers may have discovered a scrawny star bolting through the middle of our galaxy with a planet in tow. If confirmed, the pair sets a new record for the fastest-moving exoplanet system, nearly double our solar system’s speed through the Milky Way.
The planetary system is thought to move at least 1.2 million miles per hour, or 540 kilometers per second.
“We think this is a so-called super-Neptune world orbiting a low-mass star at a distance that would lie between the orbits of Venus and Earth if it were in our solar system,” said Sean Terry, a postdoctoral researcher at the University of Maryland, College Park and NASA’s Goddard Space Flight Center in Greenbelt, Maryland. Since the star is so feeble, that’s well outside its habitable zone. “If so, it will be the first planet ever found orbiting a hypervelocity star.”
The pair of objects was first spotted indirectly in 2011 thanks to a chance alignment. A team of scientists combed through archived data from MOA (Microlensing Observations in Astrophysics) – a collaborative project focused on a microlensing survey conducted using the University of Canterbury Mount John Observatory in New Zealand — in search of light signals that betray the presence of exoplanets, or planets outside our solar system.
Microlensing occurs because the presence of mass warps the fabric of space-time. Any time an intervening object appears to drift near a background star, light from the star curves as it travels through the warped space-time around the nearer object. If the alignment is especially close, the warping around the object can act like a natural lens, amplifying the background star’s light.
This artist’s concept visualizes stars near the center of our Milky Way galaxy. Each has a colorful trail indicating its speed –– the longer and redder the trail, the faster the star is moving. NASA scientists recently discovered a candidate for a particularly speedy star, visualized near the center of this image, with an orbiting planet. If confirmed, the pair sets a record for fastest known exoplanet system.
NASA/JPL-Caltech/R. Hurt (Caltech-IPAC)
In this case, microlensing signals revealed a pair of celestial bodies. Scientists determined their relative masses (one is about 2,300 times heavier than the other), but their exact masses depend on how far away they are from Earth. It’s sort of like how the magnification changes if you hold a magnifying glass over a page and move it up and down.
“Determining the mass ratio is easy,” said David Bennett, a senior research scientist at the University of Maryland, College Park and NASA Goddard, who co-authored the new paper and led the original study in 2011. “It’s much more difficult to calculate their actual masses.”
The 2011 discovery team suspected the microlensed objects were either a star about 20 percent as massive as our Sun and a planet roughly 29 times heavier than Earth, or a nearer “rogue” planet about four times Jupiter’s mass with a moon smaller than Earth.
To figure out which explanation is more likely, astronomers searched through data from the Keck Observatory in Hawaii and ESA’s (European Space Agency’s) Gaia satellite. If the pair were a rogue planet and moon, they’d be effectively invisible – dark objects lost in the inky void of space. But scientists might be able to identify the star if the alternative explanation were correct (though the orbiting planet would be much too faint to see).
They found a strong suspect located about 24,000 light-years away, putting it within the Milky Way’s galactic bulge — the central hub where stars are more densely packed. By comparing the star’s location in 2011 and 2021, the team calculated its high speed.
This Hubble Space Telescope image shows a bow shock around a very young star called LL Ori. Named for the crescent-shaped wave made by a ship as it moves through water, a bow shock can be created in space when two streams of gas collide. Scientists think a similar feature may be present around a newfound star that could be traveling at least 1.2 million miles per hour, or 540 kilometers per second. Traveling at such a high velocity in the galactic bulge (the central part of the galaxy) where gas is denser could generate a bow shock.
NASA and The Hubble Heritage Team (STScI/AURA); Acknowledgment: C. R. O’Dell (Vanderbilt University)
But that’s just its 2D motion; if it’s also moving toward or away from us, it must be moving even faster. Its true speed may even be high enough to exceed the galaxy’s escape velocity of just over 1.3 million miles per hour, or about 600 kilometers per second. If so, the planetary system is destined to traverse intergalactic space many millions of years in the future.
“To be certain the newly identified star is part of the system that caused the 2011 signal, we’d like to look again in another year and see if it moves the right amount and in the right direction to confirm it came from the point where we detected the signal,” Bennett said.
“If high-resolution observations show that the star just stays in the same position, then we can tell for sure that it is not part of the system that caused the signal,” said Aparna Bhattacharya, a research scientist at the University of Maryland, College Park and NASA Goddard who co-authored the new paper. “That would mean the rogue planet and exomoon model is favored.”
NASA’s upcoming Nancy Grace Roman Space Telescope will help us find out how common planets are around such speedy stars, and may offer clues to how these systems are accelerated. The mission will conduct a survey of the galactic bulge, pairing a large view of space with crisp resolution.
“In this case we used MOA for its broad field of view and then followed up with Keck and Gaia for their sharper resolution, but thanks to Roman’s powerful view and planned survey strategy, we won’t need to rely on additional telescopes,” Terry said. “Roman will do it all.”
This website uses cookies to improve your experience. We'll assume you're ok with this, but you can opt-out if you wish.AcceptRead More
Privacy & Cookies Policy
Privacy Overview
This website uses cookies to improve your experience while you navigate through the website. Out of these, the cookies that are categorized as necessary are stored on your browser as they are essential for the working of basic functionalities of the website. We also use third-party cookies that help us analyze and understand how you use this website. These cookies will be stored in your browser only with your consent. You also have the option to opt-out of these cookies. But opting out of some of these cookies may affect your browsing experience.
Necessary cookies are absolutely essential for the website to function properly. This category only includes cookies that ensures basic functionalities and security features of the website. These cookies do not store any personal information.
Any cookies that may not be particularly necessary for the website to function and is used specifically to collect user personal data via analytics, ads, other embedded contents are termed as non-necessary cookies. It is mandatory to procure user consent prior to running these cookies on your website.