Tag: planethunt

  • NASA’s X-59 Nears First Flight

    2 min read

    Preparations for Next Moonwalk Simulations Underway (and Underwater)

    NASA’s X-59 quiet supersonic research aircraft is seen on the ramp at sunrise with its canopy open. Orange and gold light filters through the clouds behind the aircraft, highlighting the aircraft’s shape. Several ground crew members are visible around the aircraft, along with support carts. A vertical light pole with a coiled cable can be seen in the foreground.
    NASA’s X-59 quiet supersonic research aircraft sits on the ramp at sunrise before ground tests at Lockheed Martin’s Skunk Works facility in Palmdale, California, on July 18, 2025. The X-59 is the centerpiece of NASA’s Quesst mission to demonstrate quiet supersonic flight and the aircraft is scheduled to make its first flight later this year.
    Credit: Lockheed Martin Corporation

    As we honor the legacy of aviation pioneers this National Aviation Day, NASA’s X-59 is preparing to push the boundaries of what’s possible in air travel. The quiet supersonic aircraft’s historic first flight is on the horizon, with final ground tests about to begin.

    Following completion of low-speed taxi tests in July 2025 in Palmdale, California, medium- and high-speed taxi tests mark the final steps before the aircraft takes to the skies for the first time. The taxi tests will focus on how the aircraft handles at higher ground speeds, including braking, steering, stability, and sensor performance. The X-59 team will also assess how well the visibility systems work since the cockpit has no forward-facing window.

    The X-59’s initial flight will kick off a first phase of flight testing focused on verifying the aircraft’s airworthiness and safety. The X-59 will reach speeds of approximately 240 mph at an altitude of about 12,000 feet. The roughly one-hour flight will depart from Palmdale and land at NASA’s Armstrong Flight Research Center in Edwards, California.

    During the flight, the X-59 team will evaluate several critical systems, including engine performance, stabilization, instrumentation, autopilot, control systems, and air data performance. These checks will ensure the aircraft is ready for future flight tests, where it will fly faster and higher to evaluate performance and safety, ultimately leading to future phases of the mission.

    The X-59 is the centerpiece of NASA’s Quesst mission, which aims to demonstrate quiet supersonic flight by reducing the loud sonic boom to a quieter “thump.” Proving the X-plane’s airworthiness is the first step on the path to gathering data in support of the mission. The flight data will help inform U.S. and international regulators as they consider new noise standards for supersonic commercial flight over land. 

    NASA’s X-59 lead test pilot Nils Larson sits in the cockpit of the X-59 wearing a helmet and tan flight suit under a green G-suit. The X-59’s canopy is partially raised, and Larson can be seen reaching up with his left hand to close it.  The Quesst mission logo is visible on the aircraft’s fuselage and the background sky has a soft purple and pink color from the early light.
    NASA test pilot Nils Larson lowers the canopy of the X-59 quiet supersonic research aircraft during ground tests at Lockheed Martin’s Skunk Works facility in Palmdale, California, on July 18, 2025. The X-59 is the centerpiece of NASA’s Quesst mission to demonstrate quiet supersonic flight and the aircraft is scheduled to make its first flight later this year.
    Credit: Lockheed Martin Corporation
  • What is BioNutrients?

    A series of biology experiments, called BioNutrients, is testing ways to use microorganisms to produce nutrients – off Earth and on demand – that will be critical for human health in space.

    Close up of purple-gloved hands holding a BioNutrients production pack.
    For the BioNutrients-1 experiment, the specially engineered yeast and its powdered food source are held in the container at the left. Its lid holds a membrane that allows carbon dioxide from the yeast to escape. The clear tube at right protects another filter system leading into the compartment with the microorganisms. To activate the yeast and begin the experiment, astronauts on board the space station will inject water through the filter, making it sterile. The water will dissolve the nutrient powder and the yeast will grow and multiply in this liquid environment, producing an important nutrient for human health.
    NASA/Dominic Hart

    Editor’s note: This article was updated on Aug. 19, 2025, to clarify which BioNutrients experiments in the series are completed and adds new information about the upcoming experiment, BioNutrients-3.

    In the future, NASA’s long-duration human exploration missions to the Moon and Mars will require minimizing the amounts of supplies launched, increasing reuse and recycling, and using local resources to make crucial products for crew during spaceflight. Certain supplies, such as vitamins, have a limited shelf life and are most effective freshly made. To meet these needs, NASA is developing technologies to biomanufacture valuable products on-demand.

    Sailors might have avoided scurvy if NASA had been around in the age of exploration on the high seas. The condition is caused by a vitamin C deficiency, and many people died from spending months at sea without fresh fruits and vegetables. In the age of exploration into deep space, astronauts, too, will need a way to get the right nutrition. Planning new ways to supply food for a multi-year mission on the Moon or Mars may require making food and nutrients in space. NASA scientists are testing an early version of a potential solution: get microorganisms to produce vital nutrients so that, whenever they’re needed, astronauts can drink them down. The same kind of system designed for space also could help provide nutrition for people in remote areas of our planet.

    Microbial Nutrient Factories

    With an experiment called BioNutrients-1 – the first of a series of studies, that was launched to the International Space Station in April 2019 – astronauts aboard the orbiting lab helped test a new system over the course of nearly six years. BioNutrients-1 was developed by scientists at NASA’s Ames Research Center in California’s Silicon Valley using this strategy: take a safe organism already present in our food (in this case, baker’s yeast), modify it so that it produces an essential nutrient, and build the right hardware to let astronauts grow the yeast in space. Like tiny living factories, the microorganisms will go about making the desired product. The nutrients that the yeast will produce in this experiment are called beta carotene and zeaxanthin. These are antioxidants usually found in vegetables, and they’re critical for keeping our eyes healthy.

    Although astronauts on the space station did not consume anything for the BioNutrients-1 experiment, they conducted multiple rounds of tests on the system. For each test, they added sterile water to a mixture of dehydrated yeast and its powdered food source, mixed well and kept the packets warm for 48 hours. Then, they froze the samples to be analyzed later, back on Earth. NASA scientists checked how the system performed, including how much yeast grew in the packets and how much nutrient the experiment produced.

    Purple-gloved hands seen pouring white powder from a small glass jar into a round plastic container.
    The microorganisms at the heart of the BioNutrients-1 experiment and their powdered food source (shown here) are loaded into the hardware for spaceflight using sterile techniques. Astronauts on the International Space Station will help test the BioNutrients system’s ability to use yeast cells as tiny factories to produce essential nutrients for human health.
    NASA/Dominic Hart

    Essential (Nutrients) for Exploration

    An on-demand nutrient production system like this will be vital for human exploration, because it may not be possible to provide complete nutrition from stored foods during a multi-year mission. What’s more, even with a supply of nutritional supplements, many nutrients have a limited shelf life. Some things, like vitamins, also work better in their fresh form than in a processed tablet.

    Space station crew members performed tests on different yeast types, periodically, over the course of the BioNutrients-1 experiment. This allowed scientists to check how long their specially engineered yeast stays good on the shelf and able to churn out fresh nutrients that humans will need to stay healthy in space.

    Two men hold experiment hardware, squinting as they precisely apply tiny labels.
    NASA researchers John Hogan (left) and Kevin Sims (right) at NASA’s Ames Research Center in California’s Silicon Valley apply labels and inspect assembled nutrient production packs prior to the launch of BioNutrients-1 to the International Space Station. The tiny labels require precise alignment: the markings on them will help the crew know if they need to tighten the lid before rehydrating the microorganisms inside, ensuring they grow in sterile conditions.
    NASA/Dominic Hart

    The BioNutrients-1 system tested two types of yeast with different “lifestyles” in the nutrient-production packets. One makes spores as part of its lifecycle. Spores are a dormant form of microorganisms that are highly stable and radiation tolerant. The microorganisms must maintain viability when stored for long durations – potentially in the high-radiation deep space environment – so spores are likely the optimal form for storage. Yeast in this form should stay stable for at least five years, thereby providing a reasonable “shelf life” for use during long-term human exploration missions on the Moon or to the surface of Mars.

    The other yeast species does not form spores; they flew as vegetative – or metabolically active – cells, which are expected to have a shorter shelf life than spores. However, scientists are interested in this type for other reasons. People are widely consuming this same yeast in the form of commercially available probiotic supplements. More yeast species, of this same “active” type, are available to scientists for potential use in future nutrient production systems, so understanding how they work could be important for the research.

    As an additional part of the BioNutrients-1 investigation, the researchers studied the shelf life of other types of microorganisms – different from the two types of yeast tested in the production packs – to track how well the various organisms function during the planned five-year span in space, and what genetic features allow them to survive for the long haul. Samples of these specially prepared biomanufacturing and probiotic microorganisms were stored on the station and periodically returned to Earth for analysis. As of May 2025, some of the returned samples still show viability beyond five years.

    Two women in safety glasses and lab coats. One is wearing purple gloves and working with hardware inside a sterile cabinet.
    Researchers Natalie Ball (left) and Hiromi Kagawa (right) at NASA’s Ames Research Center in California’s Silicon Valley assemble the BioNutrients-1 hardware in preparation for an experiment aboard the International Space Station. Kagawa is attaching a one-way valve that will be connected to a filter. When astronaut crew members inject water into the hardware through this filter, it will be sterilized before rehydrating the experiment’s microorganisms and allowing them to grow.
    NASA/Dominic Hart

    BioNutrients-2

    The BioNutrients-2 investigation launched to the space station in November 2022. This phase of the study built on early results from BioNutrients-1 and incorporated several new features. The overall goal was to test an on-demand system to produce specific amounts of key nutrients using minimal equipment.

    BioNutrients-2 broadened the types of microorganism being tested. It used the same two yeast strains used in BioNutrients-1 and added four new types. This includes two microorganisms that produce yogurt, one that produces a fermented milk product known as kefir, and another type of yeast specially prepared to produce follistatin, a protein linked to maintaining muscle mass.

    The entire range of microorganism types were tested in BioNutrients-2’s new hardware. The system uses lightweight, flexible bags – a form factor comparable to existing crew food products – rather than the rigid containers being tested for BioNutrients-1. This change reduced the mass and the volume of the system, offering advantages for long duration spaceflight when volume and mass are limited.

    Two experiment runs were performed for each sample type: the first in January 2023, approximately 45-60 days after launch, and the second in May 2023, approximately six months after launch. During each run a crew member aboard the space station retrieved four bags of a given sample type, added water, agitated the bags to mix the contents, and placed the bags in an incubator to promote growth. At the end of the run, the crew removed the bags from the incubator and froze them. The bags were later returned to Earth, still frozen, for analysis.

    Two square, clear plastic bags are taped to a rectangular tray covered with alternating purple and pink stripes. The bag on the left contains a purple liquid and the bag on the right a pink liquid.
    View of the BioNutrients-3 packs containing growth media, engineered yeast, and water. These include a color-changing indicator that naturally occurs in red cabbage and allows a way to visually track fermentation progress. As the yogurt and kefir cultures ferment, the level of acid rises and the color seen in the mix changes from purple to pink. Here, a bag containing a purple-colored mix (left) is seen before growth, Another bag shows the pink colored mix after growth (right.) The board behind the bags provides a reference for the starting and ending colors.
    NASA/ Brandon Torres

    BioNutrients-3

    The BioNutrients-3 investigation is planned to launch to the space station in August 2025 aboard NASA’s SpaceX CRS-33 mission. This experiment builds on results from the BioNutrients-1 and BioNutrients-2 investigations and incorporates new food safety features.

    This project aims to develop a platform biomanufacturing technology that demonstrates microbial production of targeted nutrients for long-duration space missions. The concept is similar to making familiar fermented foods, such as how milk – transformed by bacteria – becomes yogurt. But in this case, there is a focus on the production of very specific quantities and qualities of nutritious products using substantially less time and infrastructure than traditional crop-based production methods.

    BioNutrients-3 uses production bags similar to BioNutrients-2, but larger in size to accommodate an increased sample volume needed for food safety testing. This study includes the same commercial yogurt and kefir starters used in BioNutrients-2 and adds yeast strains that have been bioengineered to produce multiple nutrients in a single bag.

    Additionally, for BioNutrients-3, the growth substrate – the ingredients needed to sustain the microorganisms as they grow, including a color-changing indicator of the level of acidity in yogurt and kefir samples – is fully edible. Although crew will not be consuming BioNutrients-3 samples, eventually such products may be consumed by crew in future investigations.

    This color-changing indicator of acidity naturally occurs in red cabbage. The indicator allows a way to visually track fermentation progress. As the yogurt and kefir cultures ferment, the level of acid rises, and the color seen in the mix changes from purple to pink.

    As in previous BioNutrients experiments, station crew will add water to each production bag and agitate the bags to mix the contents. Crew will visually compare yogurt and kefir samples to a color reference scale before placing the bags into an incubator. Depending on the sample type, the incubation duration ranges from six to 48 hours with intermediate visual inspections and/or agitation time points.

    After crew remove the bags from the incubator, they will perform additional steps on some of the samples including pasteurization to kill microorganisms in the sample using the space station galley’s food warmer and a demonstration of the feasibility of using a NASA sensor called “electronic nose” – E-Nose, for short. The sensor simulates an ultra-sensitive nose and can be used to detect pathogens. Additionally, crew will test a technique for culturing yogurt by using a bit of yogurt from a finished bag to seed a new batch, much like maintaining a sourdough bread starter.

    After conclusion of operations, all samples will be frozen and returned to Earth for analysis.

    Making Molecules and Medicines in Remote Places

    This technology NASA is developing for future astronauts could also be used by people living in remote areas on Earth today. Results from the study will tell NASA scientists a lot about how to produce other molecules that will be critical for human health in space, including medicines for treating various ailments. Promising research is under way now to use microbes in a range of space applications. By developing microorganisms that can withstand long periods of inactivity and be revived successfully, BioNutrients is taking steps toward making that future a reality.

    Milestones:​

    BioNutrients-1​

    • April 2019 – The BioNutrients-1 experiment launched to the space station aboard NASA’s Northrop Grumman 11th commercial resupply services (CRS-11) mission 
    • June 2019 – BioNutrients-1 samples returned to Earth aboard NASA’s SpaceX CRS-17 mission.  
    • June 2019 – The first experiment run of BioNutrients-1 packs in space was completed by Canadian Space Agency astronaut David Saint-Jacques. 
    • August 2019 – BioNutrients-1 samples returned to Earth aboard NASA’s SpaceX CRS-18 mission. 
    • January 2020 – BioNutrients-1 samples returned to Earth aboard NASA’s SpaceX CRS-19 mission. 
    • January 2020 – The second experiment run of BioNutrients-1 packs in space was completed by NASA astronaut Andrew Morgan. 
    • April 2020 – BioNutrients-1 samples returned to Earth aboard NASA’s SpaceX CRS-20 mission. 
    • January 2021 – BioNutrients-1 samples returned to Earth aboard NASA’s SpaceX CRS-21 mission. 
    • January 2021 – The third experiment run of BioNutrients-1 packs in space was completed by NASA astronaut Shannon Walker. 
    • July 2021 – BioNutrients-1 samples returned to Earth aboard NASA’s SpaceX CRS-22 mission. 
    • January 2022 – BioNutrients-1 samples returned to Earth aboard NASA’s SpaceX CRS-24 mission. 
    • February 2022 – The fourth experiment run of BioNutrients-1 packs in space was completed by NASA astronaut Thomas Marshburn. 
    • August 2022 – BioNutrients-1 samples returned to Earth aboard NASA’s SpaceX CRS-25 mission. 
    • January 2023 – The fifth experiment run of BioNutrients-1 packs in space was completed by JAXA astronaut Koichi Wakata. 
    • January 2023 – BioNutrients-1 samples returned to Earth aboard NASA’s SpaceX CRS-26 mission. 
    • March 2023 – BioNutrients-1 samples returned to Earth aboard NASA’s SpaceX Crew-5 mission. 
    • June 2023 – BioNutrients-1 samples returned to Earth aboard NASA’s SpaceX CRS-28 mission. 
    • December 2023 – BioNutrients-1 samples returned to Earth aboard NASA’s SpaceX CRS-29 mission.
    • January 2024 – The sixth experiment run of BioNutrients-1 packs in space was completed by JAXA astronaut Satoshi Furukawa.
    • February 2025 – The seventh experiment run of BioNutrients-1 packs in space was completed by NASA astronaut Suni Williams.

    BioNutrients-2

    • November 2022 – The BioNutrients-2 experiment launched to the station aboard NASA’s SpaceX CRS-26 mission. 
    • January 2023 – The first experiment run of BioNutrients-2 was completed by NASA astronauts Nicole Mann, Josh Cassada, and Frank Rubio.
    • January 2023 – BioNutrients-2 samples returned to Earth aboard NASA’s SpaceX CRS-26 mission. 
    • April 2023 – BioNutrients-2 samples returned to Earth aboard NASA’s SpaceX CRS-27 mission. 
    • May 2023 – The second experiment run of BioNutrients-2 was completed by NASA astronaut Warren Hoburg and UAE astronaut Sultan Alneyadi.
    • June 2023 – BioNutrients-2 samples returned to Earth aboard NASA’s SpaceX CRS-28 mission. 

    Partners:

    BioNutrients was developed by NASA Ames. The Game Changing Development program within NASA’s Space Technology Mission Directorate manages the project, which is part of a larger synthetic biology portfolio. Additional support is provided by Exploration Systems Development Mission Directorate as part of Exploration Capabilities. The project was previously funded by NASA’s Advanced Exploration Systems program within the Human Exploration Operations Mission Directorate.

    Learn more:

    For researchers:

    For news media: 

    Members of the news media interested in covering this topic should reach out to the NASA Ames newsroom.

  • NASA’s Psyche Captures Images of Earth, Moon

    4 min read

    Preparations for Next Moonwalk Simulations Underway (and Underwater)

    Psyche captured images of Earth and our Moon
    NASA’s Psyche captured images of Earth and our Moon from about 180 million miles (290 kilometers) away in July 2025, as it calibrated its imager instrument. When choosing targets for the imager testing, scientists look for bodies that shine with reflected sunlight, just as the asteroid Psyche does.
    NASA/JPL-Caltech/ASU

    Headed for a metal-rich asteroid of the same name, the Psyche spacecraft successfully calibrated its cameras by looking homeward.

    On schedule for its 2029 arrival at the asteroid Psyche, NASA’s Psyche spacecraft recently looked back toward home and captured images of Earth and our Moon from about 180 million miles (290 million kilometers) away. The images were obtained during one of the mission team’s periodic checkouts of the spacecraft’s science instruments.

    On July 20 and July 23, the spacecraft’s twin cameras captured multiple long-exposure (up to 10-second) pictures of the two bodies, which appear as dots sparkling with reflected sunlight amid a starfield in the constellation Aries.

    Learn more about the multispectral imager aboard Psyche that will use a pair of identical cameras with filters and telescopic lenses to photograph the surface of the asteroid in different wavelengths of light. NASA/JPL-Caltech/ASU

    The Psyche multispectral imager instrument comprises a pair of identical cameras equipped with filters and telescopic lenses to photograph the asteroid Psyche’s surface in different wavelengths of light. The color and shape of a planetary body’s spectrum can reveal details about what it’s made of. The Moon and the giant asteroid Vesta, for example, have similar kinds of “bumps and wiggles” in their spectra that scientists could potentially also detect at Psyche. Members of the mission’s science team are interested in Psyche because it will help them better understand the formation of rocky planets with metallic cores, including Earth.

    When choosing targets for the imager testing and calibration, scientists look for bodies that shine with reflected sunlight, just as the asteroid Psyche does. They also look at objects that have a spectrum they’re familiar with, so they can compare previous telescopic or spacecraft data from those objects with what Psyche’s instruments observe. Earlier this year, Psyche turned its lenses toward Jupiter and Mars for calibration — each has a spectrum more reddish than the bluer tones of Earth. That checkout also proved a success.

    Diagram showing the Psyche spacecraft is taking a spiral path around the solar system
    The Psyche spacecraft is taking a spiral path around the solar system in order to get a boost from a Mars gravity assist in 2026. It will arrive at the asteroid Psyche in 2029.
    NASA/JPL-Caltech

    To determine whether the imager’s performance is changing, scientists also compare data from the different tests. That way, when the spacecraft slips into orbit around Psyche, scientists can be sure that the instrument behaves as expected.

    “After this, we may look at Saturn or Vesta to help us continue to test the imagers,” said Jim Bell, the Psyche imager instrument lead at Arizona State University in Tempe. “We’re sort of collecting solar system ‘trading cards’ from these different bodies and running them through our calibration pipeline to make sure we’re getting the right answers.”

    Strong and Sturdy

    The imager wasn’t the only instrument that got a successful checkout in late July: The mission team also put the spacecraft’s magnetometer and the gamma-ray and neutron spectrometer through a gamut of tests — something they do every six months.

    “We are up and running, and everything is working well,” said Bob Mase, the mission’s project manager at NASA’s Jet Propulsion Laboratory in Southern California. “We’re on target to fly by Mars in May 2026, and we are accomplishing all of our planned activities for cruise.”

    That flyby is the spacecraft’s next big milestone, when it will use the Red Planet’s gravity as a slingshot to help the spacecraft get to the asteroid Psyche. That will mark Psyche’s first of two planned loops around the solar system and 1 billion miles (1.6 billion kilometers) since launching from NASA’s Kennedy Space Center in October 2023.

    More About Psyche

    The Psyche mission is led by ASU. Lindy Elkins-Tanton of the University of California, Berkeley is the principal investigator.A division of Caltech in Pasadena, JPL is responsible for the mission’s overall management, system engineering, integration and test, and mission operations. Maxar Technologies in Palo Alto, California, provided the high-power solar electric propulsion spacecraft chassis. ASU leads the operations of the imager instrument, working in collaboration with Malin Space Science Systems in San Diego on the design, fabrication, and testing of the cameras.

    Psyche is the 14th mission selected as part of NASA’s Discovery Program, managed by the agency’s Marshall Space Flight Center in Huntsville, Alabama. NASA’s Launch Services Program, based at Kennedy, managed the launch service.

    For more information about NASA’s Psyche mission go to:

    https://science.nasa.gov/mission/psyche/

    News Media Contacts

    Gretchen McCartney
    Jet Propulsion Laboratory, Pasadena, Calif.
    818-287-4115
    gretchen.p.mccartney@jpl.nasa.gov 

    Karen Fox / Molly Wasser
    NASA Headquarters, Washington
    202-358-1600
    karen.c.fox@nasa.gov / molly.l.wasser@nasa.gov

    2025-106

    Details

    Last Updated

    Aug 19, 2025

  • Summary of the 2025 GEDI Science Team Meeting

    31 min read

    Summary of the 2025 GEDI Science Team Meeting

    Introduction

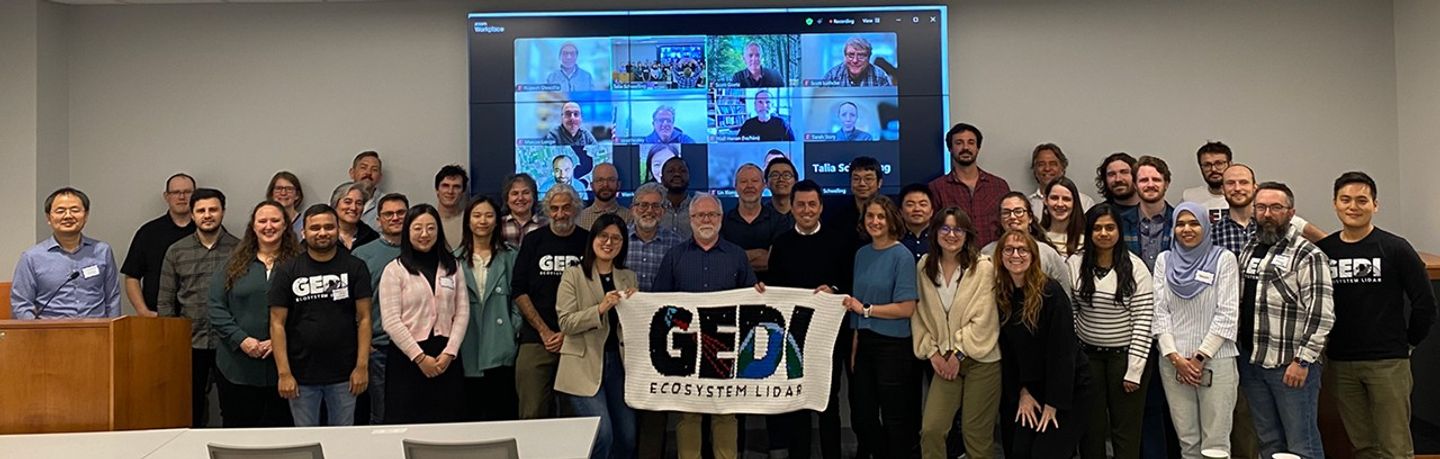
    The 2025 Global Ecosystem Dynamics Investigation (GEDI) Science Team Meeting (STM) took place April 1–3, 2025 at the University of Maryland, College Park (UMD). Upwards of 60 participants attended in-person, while several others joined virtually by Zoom. The GEDI Mission and Competed Science Team members were in attendance along with the GEDI NASA program manager and various postdoctoral associates, graduate students, collaborators, and data users – see Photo. Participants shared updates on the GEDI instrument and data products post-hibernation with the GEDI community. They also shared progress reports on the second Competed Science Team cohort’s projects as well as applications of GEDI data.

    This article provides a mission status update and summaries of the presentations given at the STM. Readers who would like to learn more about certain topics can submit specific questions through the GEDI website’s contact form.

    GEDI photo
    Photo. Attendees, both in person and virtual, at the 2025 GEDI Science Team meeting.
    Photo credit: Talia Schwelling

    Mission Status Update: GEDI Up and Running After its Time in Hibernation

    When the 2023 GEDI STM summary was published in June 2024 – see archived article, “Summary of the 2023 GEDI Science Team Meeting” [The Earth Observer, June 18, 2024] – GEDI had been placed in a temporary state of hibernation and moved from the International Space Station’s (ISS) Japanese Experiment Module–Exposed Facility (JEM–EF) Exposed Facility Unit (EFU)-6 to EFU-7 (storage).    

    Two years later, as the 2025 GEDI STM took place, the GEDI instrument was back in its original location on EFU-6 collecting high-resolution observations of Earth’s three-dimensional (3D) structure from space.

    DAY ONE

    GEDI Mission and Data Product Status I

    Ralph Dubayah [UMD—GEDI Principal Investigator (PI)] opened the STM with updates on mission status (see previous section) and the development of current and pending GEDI data products.

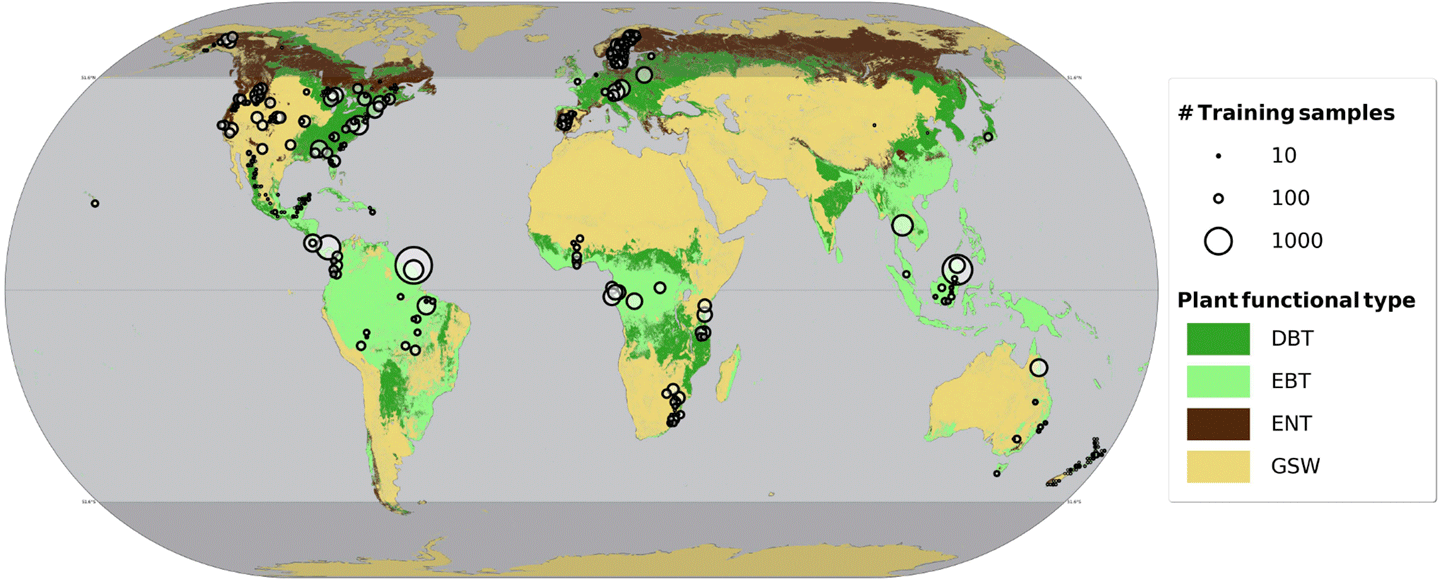
    Following its hibernation on the ISS from March 2023–April 2024, the GEDI mission entered its second extension period. Since re-installation, the instrument’s lasers have been operating nominally, steadily collecting data, increasing coverage, and filling gaps. As of November 27, 2024, GEDI had collected 33 billion Level-2A (L2A) land surface returns, with approximately 12.1 billion passing quality filters. Since the last STM, an additional 1422 new simulated GEDI footprints have been added to GEDI’s forest structure and biomass database (FSBD), which is a database of forest inventory and airborne laser scanning data (ALS) from around the globe that is used for cal/val of GEDI data. The FSBD now has 27,876 simulated footprints in total – see Figure 1. This data will support improved L4A biomass algorithm calibration.

    GEDI figure 1
    Figure 1. Training samples, or simulated footprints, are derived from coincident forest inventory and ALS data. DBT = deciduous broadleaf, EBT = evergreen broadleaf, ENT = evergreen needleleaf, GSW = grass, shrub, woodland.
    Figure credit: David Minor

    Version 2.1 (V2.1) of GEDI L1B, L2A, L2B, and L4A data products are the latest product releases available for download. This version incorporates post-storage data through November 2024. In January 2025, the team also released the new L4C footprint-level Waveform Structural Complexity Index (WSCI) product using pre-storage data. The upcoming V3.0 release will incorporate pre- and post-storage data that will improve quality filtering, geolocation accuracy, and algorithm performance.

    Although GEDI met its L1 mission science requirements before entering hibernation, orbital resonance on the ISS impacted GEDI’s coverage in the tropics. To help address these gaps, the team is exploring data fusion opportunities with other missions – e.g., NASA-Indian Space Research Organisation Synthetic Aperture Radar (NISAR), the Deutsches Zentrum für Luft- und Raumfahrt’s (DLR – German Aerospace Center) Terra Synthetic Aperture Radar–X (TerraSAR-X) and TerraSAR add-on for Digital Elevation Measurement (TanDEM-X) missions, and the European Space Agency’s upcoming forest mission – Biomass. [UPDATE: Biomass launched successfully on April 29, 2025 from Europe’s Spaceport in Korou, French Guiana, and NISAR launched July 30, 2025 from the Satish Dhawan Space Centre located on Sriharikota Island in India.]  Additional ongoing mission team efforts include advancing waveform processing, developing gridded products tailored to end-user needs, understanding error and bias, and continuing expansion of the FSBD.

    Dubayah concluded by highlighting the steady rise in GEDI-related publications and datasets appearing in high-impact journals, including PNAS, Nature, and Science families. Visit the GEDI website to gain access to a comprehensive list of GEDI-related publications.

    After hearing general updates from the mission PI, attendees heard more in-depth reports on science data planning, mission operations, and instrument status.

    Scott Luthcke [NASA’s Goddard Space Flight Center (GSFC)—GEDI Co-Investigator (Co-I)] reported on Science Operations Center activities, including geolocation performance and improvements. He shared that the Science Planning System, which is used to plan GEDI data acquisition locations, has been upgraded to improve targeting capabilities using high-resolution Reference Ground Tracks. The Science Data Processing System also underwent a technical refresh that increased computational and storage capability and has completed processing and delivery of all V2.1 data products, including post-storage data (April–November 2024), to the Land Processes and Oak Ridge National Laboratory (ORNL) Distributed Active Archive Centers (DAACs).

    Luthcke explained that V2.1 improves on precision orbit determination, precision attitude determination, tracking point modeling, time tags, and oscillator calibration. Looking ahead, V3.0 will enhance range bias calibration, improved pointing bias calibration, and modifications to L1A, L1B, L2A, and L2B products. Luthcke also discussed updates to the L3 data product, which include corrected timing and range bias, improved positioning and elevation, and a wall-to-wall 1-km (0.62-mi) elevation map to be released alongside V3.0.

    Tony Scaffardi [GSFC—GEDI Mission Director] provided an update on the Science and Mission Operations Center since its post-hibernation return to science operations on June 3, 2024. He addressed various on-orbit events that may have briefly disrupted data collection and reviewed upcoming ISS altitude plans. As of March 2025, each of the instrument’s three lasers logged over 22,000 hours in firing mode, collecting more than 20 billion shots each, with 72% of that time directly over land surfaces. As of April 2025, 95,346 hours of science data have been downlinked, averaging 51.21 GB of data per day.

    Bryan Blair [GSFC—Deputy PI and Instrument Scientist] concluded this section of the meeting with a discussion of GEDI instrument status, reporting that all three lasers are operating nominally and that both the detectors and digitizers continue to perform well. He noted that the laser pulse shapes have remained stable since the mission began, indicating consistent system performance over time. Blair also addressed the inherent challenges of operating in space, such as radiation exposure, and emphasized the importance of designing systems for graceful degradation. A recent firmware update was successfully applied to all three digitizers, and no life-limiting concerns have been identified to date.

    Competed Science Team Presentations – Session I

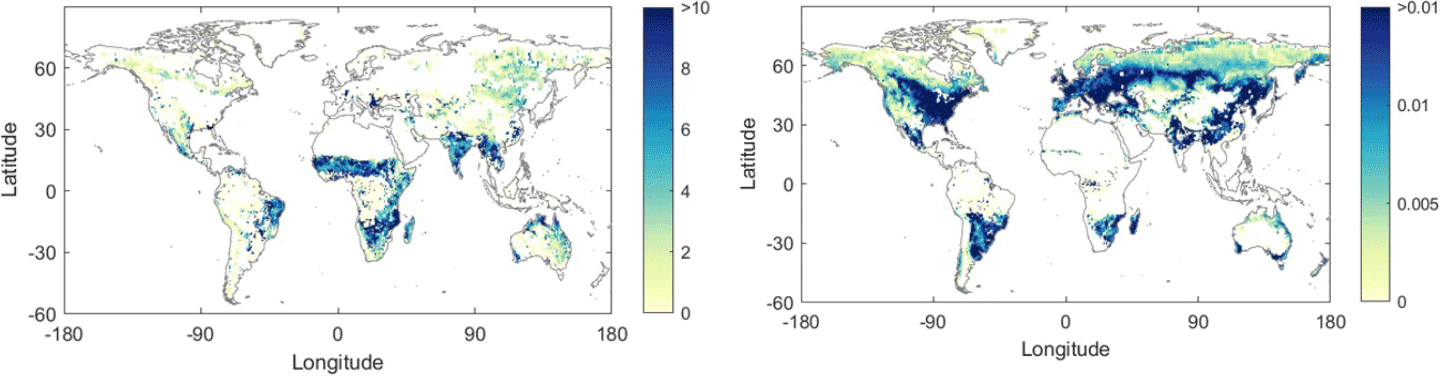
    Jim Kellner [Brown University—GEDI Co-I] kicked off the Competed Science Team (CST) presentations with an overview of his work investigating the role of stratification and quality filtering to improve GEDI data products and the impact of stratification error on prediction. He explained how GEDI quality filtering and aboveground biomass density (AGBD) model selection and prediction rely heavily on stratification by plant functional type (PFT) and geographic world region. Thus, evaluation and improvement of stratification and quality filtering will help maximize the number of usable GEDI shots, some of which are potentially excluded unnecessarily. To support these improvements, Kellner is exploring replacement of the current 1-km (0.62-mi) stratification layer with a 30-m (98-ft) product derived from Landsat and similarly upgrading the 500-m (1640-ft) phenology stratification layer to a 30-m (98-ft) Landsat version. These changes aim to improve the L4A footprint-level AGBD estimates in particular, but flow through to the GEDI L4B data product.

    Birgit Peterson [United States Geological Survey (USGS), Earth Resources Observation and Science (EROS) Center] presented her research on the decomposition of GEDI waveforms to derive vegetation structure information for 3D fuels and wildfire modeling, emphasizing the importance of consistent and comprehensive information on vegetation status for effective wildland fire management. Canopy structure data, like that provided by GEDI, can play a key role in developing physics-based fire behavior models, such as QUIC-Fire. With study sites in South Dakota, the Sierra Nevada, and dispersed around the southeastern United States, Peterson’s work aims to demonstrate how vegetation structure parameters needed to run the QUIC-Fire model can be derived from GEDI waveform data.

    David Roy [Michigan State University] shared updates on his CST project leveraging GEDI data to improve understanding of species-specific tropical forest regrowth in central Africa. Focusing on the Mai Ndombe region of the Democratic Republic of the Congo (DRC), the project aims to quantify forest regrowth by integrating GEDI-derived structural data with satellite and airborne laser scanner (ALS) based maps of forest height. Roy emphasized the potential of secondary and recovering forest conservation as a low-cost mechanism for carbon sequestration and climate change mitigation. GEDI data combined with satellite maps provides new opportunities to quantify forest regrowth and carbon sequestration in secondary forests at finer detail, although high species diversity and varying regrowth rates can be complex to assess with remote sensing. Roy also presented a 2025 paper validating the GEDI relative height product in the DRC and at two US temperate forest sites with a simple method to improve the GEDI canopy height using digital terrain heights measured by airborne laser scanning (ALS). 

    Perspectives I

    After the morning CST presentation session, meeting attendees heard the first perspectives presentation from Amanda Whitehurst [NASA Headquarters (HQ] GEDI Program Scientist and NASA Terrestrial Ecology Program Manager]. Whitehurst is new to the GEDI Program Scientist role; she used this opportunity to officially introduce herself to the ST and expressed her enthusiasm for the work ahead  She commended the GEDI team on the impressive accomplishments of the mission to date, and spoke about the exciting potential for continued data collection and scientific discovery through the program.

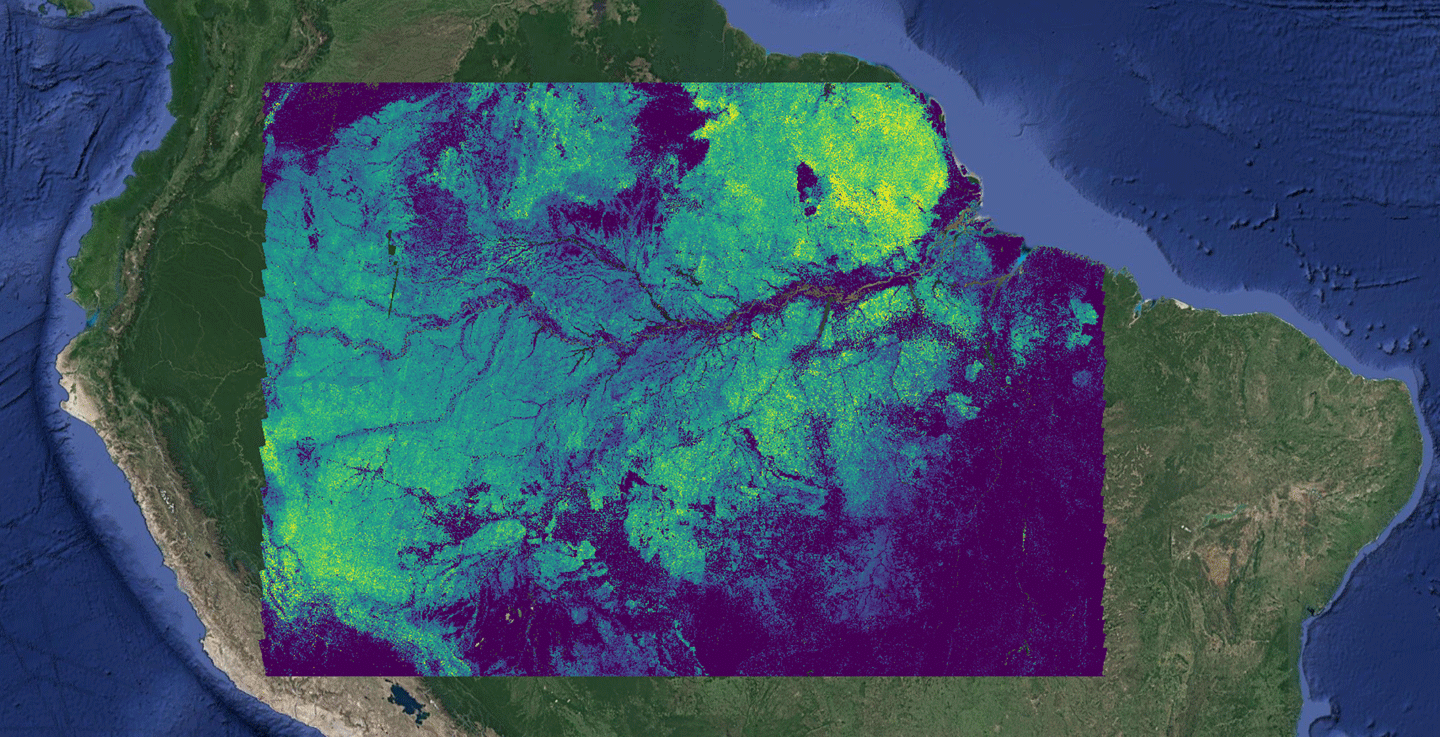
    Matteo Pardini [DLR] shared his perspective on the potential of combining synthetic aperture radar (SAR) with lidar data to improve four-dimensional (4D) forest structure mapping. He highlighted DLR’s TerraSAR-X and TanDEM-X missions, which have been acquiring interferometric data since 2007 and 2010, respectively. Both missions are expected to continue acquiring data through 2028. The TanDEM-X Global Digital Elevation Model, covering 150 million km2 (58 million mi2) with approximately 1-m (3-ft) accuracy, can be used to derive forest height and biomass. The fusion of TanDEM-X and GEDI data can improve biomass estimates – see Figure 2 – and help researchers parameterize the relationship between coherence and forest structure. Pardini also previewed the upcoming BIOMASS mission, which will operate at a lower frequency and be able to penetrate vegetation, providing complementary information to the TerraSAR-X and TanDEM-X missions.

    GEDI figure 2
    Figure 2. Biomass estimates over the Amazon basin at 25-m (82-ft) resolution derived using a fusion of data from NASA’s GEDI and DLR’s TanDEM-X missions.
    Figure credit: Wenlu Qi

    CST Presentations – Session II

    Chris Hakkenberg [University of California, Los Angeles (UCLA)] opened the second CST presentation session with a discussion on his research using GEDI to characterize fuel structure, burn severity, and post-fire response across the regions of California affected by wildfire. He began by highlighting significant land cover changes resulting from wildfires in recent years that are visible as enormous [greater than 100 km2 (38 mi2)] conversions from forest to grass/scrub in the National Land Cover Dataset. Hakkenberg’s project aims to examine the role of fuel structure in driving fire severity patterns, improve burn severity maps using GEDI for change detection, and characterize post-fire response using data from Landsat 5, 7, and 8 and GEDI. He noted that while fire behavior is heavily dependent on weather, topography, and fuels – only fuels can be actively managed. GEDI provides valuable insights into forest fuel structure by measuring canopy volume (total fuel quantities) and vertical continuity (how fire may spread through those volumes). Hakkenberg and his team found that vertical fuel continuity metrics were stronger predictors of severity than fuel volume, especially in extreme weather conditions, and are most closely related to the high-burn severities that can delay long-term recovery. Finally, Hakkenberg presented research that combines GEDI and Landsat to improve burn severity assessments, which will be the focus on the next phase of this research project.

    Sean Healey [U.S. Forest Service (USFS)—GEDI Co-I] presented an overview of the Online Biomass Inference using Waveforms and iNventory (OBI-WAN) project. OBI-WAN provides globally consistent estimates of biomass and carbon, as well as changes in these estimates over time, for user-defined areas and periods of interest rather than fixed 1-km (0.62-mi) squares. The project leverages GEDI L4A models to predict biomass at the footprint level and uses this dense collection of footprints to create local-level biomass models with Landsat (assuming consistent calibration of Landsat through time). To quantify uncertainty in change estimates, OBI-WAN employs a statistical method called bootstrapping, which can be embedded into customized accounting systems through a powerful programming interface accessed through Google Earth Engine.

    Data Product Status I

    Michelle Hofton [UMD—GEDI Co-I] and Sarah Story [GSFC] returned to the topic of GEDI data product status. They presented an update on the GEDI L2A product, which includes ground topography and canopy height measurements. Encouragingly, preliminary testing shows that GEDI’s post-storage performance has remained consistent with pre-storage. Hofton explained GEDI observations are compared with high-quality intersections with the Land, Vegetation, and Ice Sensor (LVIS) (an airborne lidar) data in order to assess GEDI data quality and accuracy.  She highlighted the use of bingos – pairs of GEDI waveforms believed to be spatially coincident in vegetated areas – as a valuable tool for assessing geolocation and waveform errors as well as algorithm performance. As of December 2024, more than one million bingos had been collected. Hofton and Story concluded with a preview of anticipated updates to the L2A product for V3.0, including new quality flags for data cleaning and a refined algorithm selection approach. 

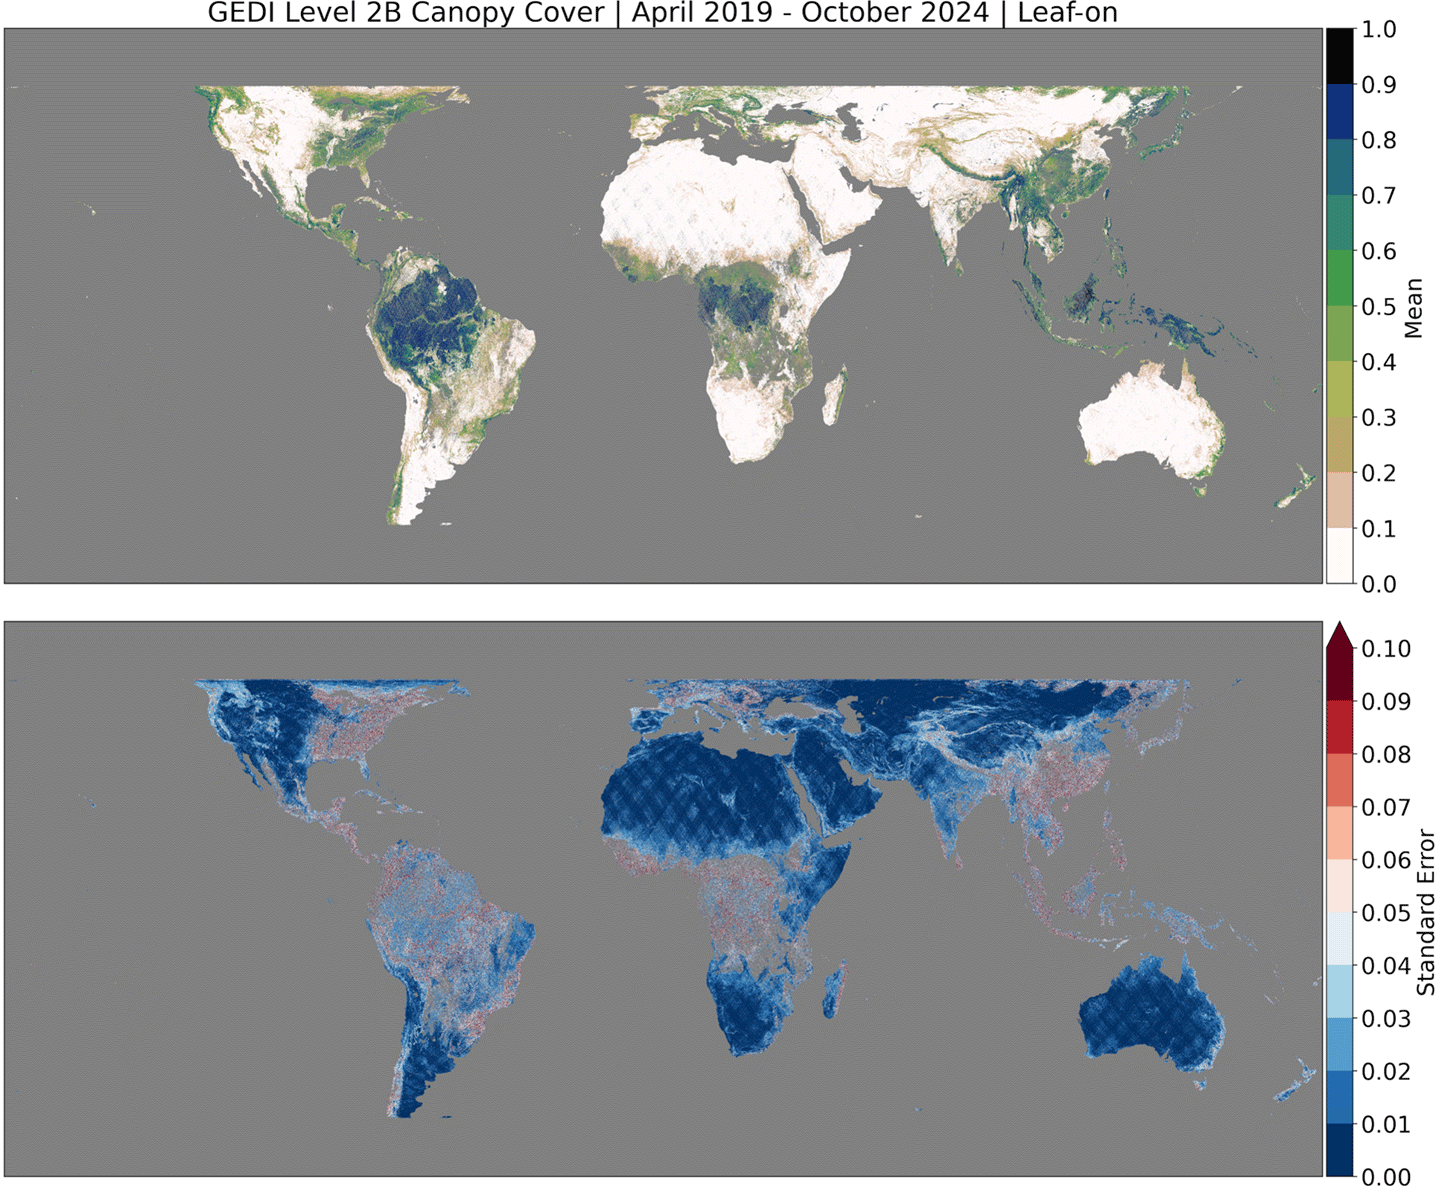
    John Armston [UMD—GEDI Co-I] presented on GEDI L2B data, which provides gridded footprint-level [25-m (82-ft) resolution] metrics such as canopy cover (see Figure 3), plant area index (PAI), plant area volume density (PAVD), and foliage height diversity (FHD). Waveform analysis will remain largely unchanged from V2.0. He shared that the upcoming V3.0 release will differ from V2.0 in that it will use GEDI-derived canopy-ground reflectance ratios — rather than values derived from NASA LVIS — to estimate canopy cover, thus allowing for spatial variability. Waveform analysis will remain largely unchanged from V2.0. Armston also presented 1-km (0.62-mi) leaf-on and leaf-off gridded L2B canopy cover fraction maps using both pre- and post-storage data (April 2019–November 2024), explaining how post-storage data were used to fill gaps. Additionally, the mission team has mapped GEDI canopy cover distributions using a H3-indexing API developed by Tiago de Conto [UMD], which are being used to improve GEDI L2A algorithms for ground detection. V3.0 will offer a more direct measure of canopy structure to complement L2A relative height metrics by improving quality flags and including relative canopy height metrics. Finally, the team presented progress on the independent validation of GEDI L2B V3.0 algorithms and products using the GEDI FSBD and NASA LVIS campaign data from Costa Rica, Gabon, French Guiana and the United States.

    GEDI figure 3
    Figure 3. GEDI L2B leaf-on canopy cover fraction map derived from data obtained April 2019–October 2024.
    Figure credit: John Armston

    Jamis Bruening [UMD] shared the final data product update of the day. He discussed GEDI’s L4B gridded aboveground biomass density (AGBD) product, which is a 1-km (0.62-mi) raster dataset representing area-level estimates of mean AGBD and associated uncertainty across the mission’s range of observation. GEDI’s L4B estimates are derived from the footprint-level L4A AGBD predictions through one of two statistical modes of inference. Currently, hybrid estimation is used to generate L4B. This approach uses GEDI data as the sole input and requires at least two GEDI tracks in a 1-km (0.62-mi) grid cell to produce a mean estimate. The hybrid estimator also provides a standard error, accounting for both model variance in the L4A predictions and GEDI’s sampling uncertainty. To address gaps in GEDI’s coverage where hybrid estimates cannot be produced, the team has begun implementing an alternative inference mode, called generalized hierarchical model-based (GHMB) estimation. GHMB incorporates auxiliary imagery, such as Landsat, SAR, and GEDI’s L4A predictions, to infer mean biomass and its standard error. Although the addition of post-storage data has increased GEDI’s coverage, GHMB remains essential for producing a complete, gap-free 1-km (0.62-mi) AGBD map. Both hybrid and GHMB approaches will soon be used together to generate a global, gap-free L4B product. Users can expect the release of V3.0 L4B estimates – featuring hybrid and GHMB models of biomass inference using both pre- and post-storage data – later in 2025.

    What’s Next?

    Day one concluded with John Armston, who presented on the potential new satellite laser altimetry mission called Earth Dynamics Geodetic Explorer (EDGE), which was competitively selected for a Phase A Concept Study under NASA’s Earth Systems Explorer Announcement of Opportunity. If selected, EDGE would launch in 2030 and operate for a two-year mission, providing a critical link between current and future satellite laser altimetry missions.

    Armston explained that EDGE addresses two of the targeted observables identified in the 2017 Earth Science Decadal Survey – terrestrial ecosystem structure and ice elevation. It provides a dramatic improvement in coverage and resolution over current active missions by operating in a Sun-synchronous orbit that will enable the direct measurement of change in the three-dimensional (3D) structure of vegetation and the surface topography of ice at the spatial and temporal scales needed to observe the driving processes. EDGE will provide fine-scale detail of ecosystem structure in some of the world’s most critical and challenging-to-quantify regions, including the boreal, transforming the field’s understanding of global terrestrial ecosystem structure and its response to natural and anthropogenic change over all of Earth’s wooded ecosystems. 

    DAY TWO

    Data Product Status II/Extended and Demonstrative Products I

    Jim Kellner began day two with an L4A footprint-level AGBD product update. His presentation focused on current product status and planned evaluation of and improvements to the L4A algorithm. Since the last STM, L4A V2.1 was updated to include data through MW 311 (through November 2024) and is now available to end users. V3.0, along with an updated Algorithm Theoretical Basis Document (ATBD), is expected later in 2025. The revised ATBD will outline enhancements to the waveform simulator, quality filtering, stratification, and model selection thanks in part to the availability of on-orbit data. V3.0 will also benefit from the ingestion of approximately 35% more simulated waveforms that passed quality assurance and quality control in the FSBD, significantly expanding training data coverage, particularly in Africa and North America. Kellner noted that users should be aware of key differences between L2 and L4 quality flags; L4 flags account for factors such as sensitivity, water presence, urban conditions, and phenology. Additionally, updates to the selected models may lead to changes in AGBD estimates, which will be more clearly communicated in the V 3.0 release. Comparing pre- and post-storage data, Kellner and his team found that AGBD estimates remain stable across both periods. He encouraged users to review the updated ATBD upon release to fully understand the changes and their implications.

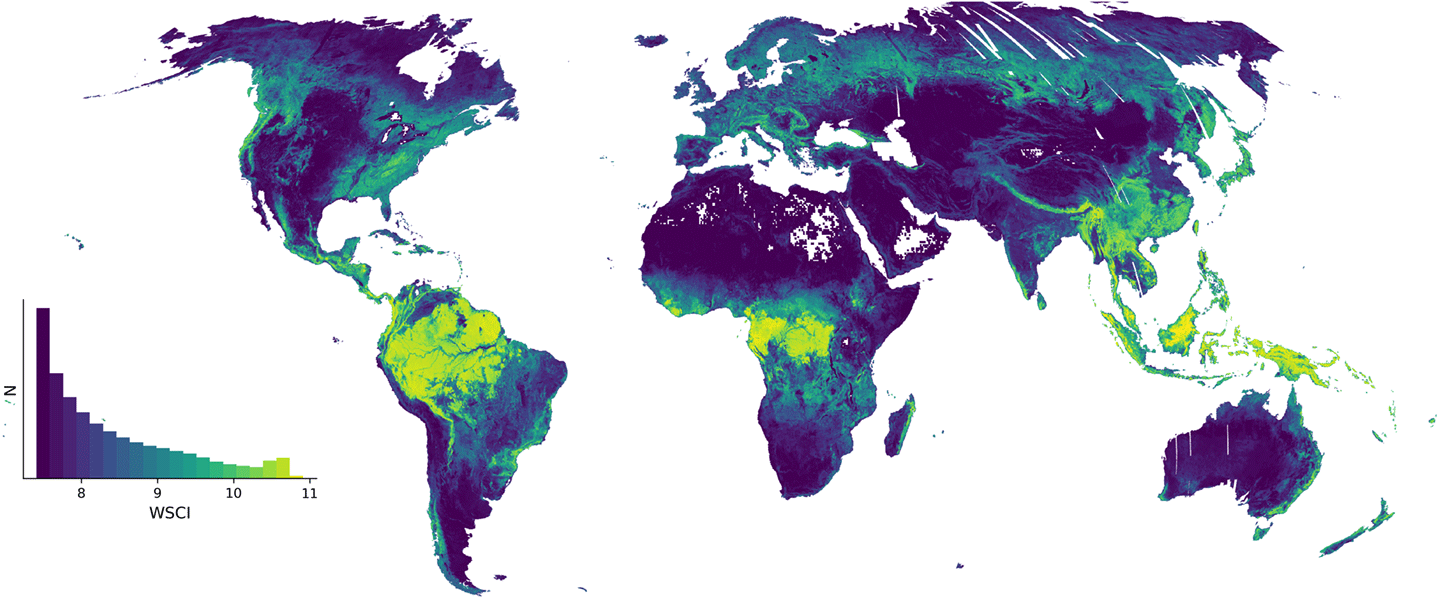
    Tiago de Conto [UMD] presented the new GEDI L4C WSCI product, which was released in May 2024 and available through the ORNL DAAC – see Figure 4. This footprint-level metric captures the amount and variability of canopy structure in 3D space, reflecting the richness of structural information underlying any given GEDI observation. It synthesizes multiple structural attributes into a single metric and incorporates elements of both vertical and horizontal variability. WSCI models are trained at the PFT level (i.e., deciduous broadleaf trees, evergreen broadleaf trees, evergreen needleleaf trees, and the combination of grasslands, shrubs, and woodlands) using crossovers of GEDI and airborne lidar point clouds. While WSCI tends to scale with canopy height, the relationship varies across biomes. Looking ahead, de Conto previewed forthcoming WSCI–SAR fusion work designed to produce wall-to-wall maps that are suitable for applications, such as change detection. Early fusion results using data from the European Union’s Copernicus Sentinel-1 (a synthetic aperture radar mission) and the Japan Aerospace Exploration Agency’s (JAXA) Advanced Land Observing Satellite Phased Array L-band Synthetic Aperture Radar (ALOS-PALSAR) show stable prediction performance across different biomes and time periods as well as consistent performance against airborne lidar wall-to-wall reference data.

    GEDI figure 4
    Figure 4. The global frequency distribution of GEDI L4C Waveform Structural Complexity Index.
    Figure credit: Tiago de Conto

    Paul May [South Dakota School of Mines and Technology] presented his work predicting interpolated waveforms, along with their associated uncertainties, over USDA Forest Inventory and Analysis (FIA) field plots across the contiguous United States (CONUS). This project aims to develop regression models that convert GEDI’s waveform data into measurements of key forest attributes and enhance monitoring capabilities for a variety of applications. The resulting data product – GEDI-FIA Fusion: Training Lidar Models to Estimate Forest Attributes – was released June 2025 and is publicly available through the ORNL DAAC.

    Sean Healey presented ongoing work on the GEDI L4D Imputed Waveform product, led by postdoctoral researcher Eugene Seo [Oregon State University]. This product aims to generate a wall-to-wall 30-m (98-ft) resolution map of GEDI waveforms across the globe in 2023. To achieve this, Seo, Healey, and Zhiqiang Yang [USFS] are using a k-nearest neighbor (k-NN) imputation approach to address areas without GEDI observations. The model operates at a 10-km (6-mi) scale but draws neighbors from a surrounding 30×30 km (19×19 mi) window. The resulting 30-m (98-ft) resolution imputed waveform map is aligned with Landsat data from 2023. Users can expect the release of the L4D product later in 2025.

    GEDI Applications and Perspectives II

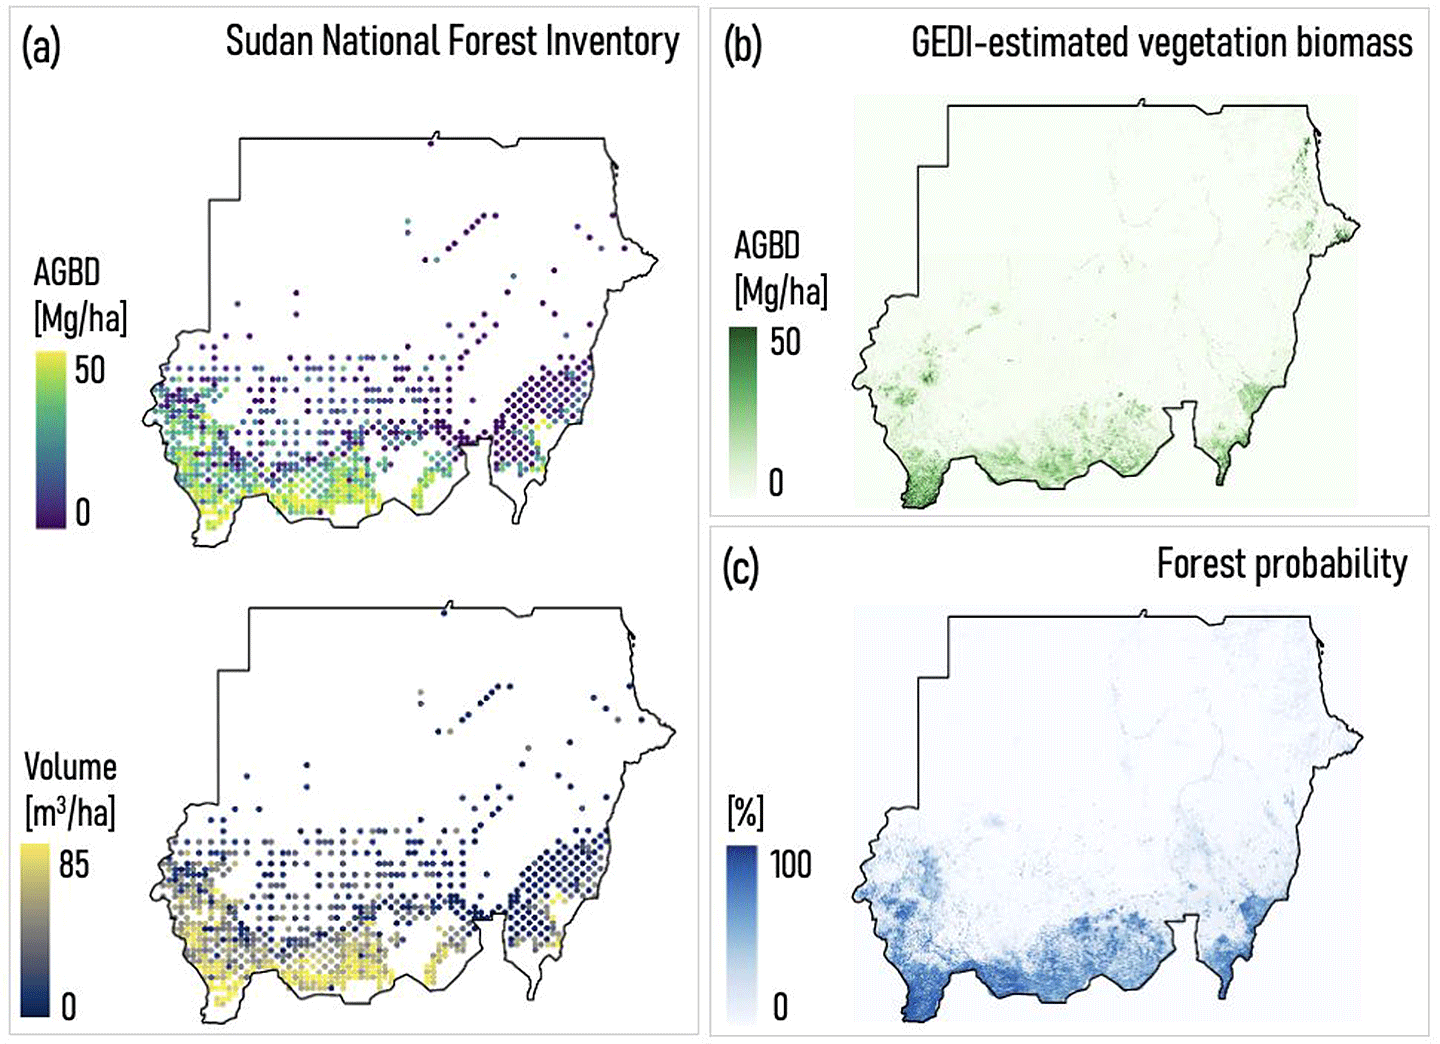
    Neha Hunka [European Space Agency] shared her work using GEDI to fill gaps in the Republic of Sudan’s National Forest Inventory (NFI) in support of their Forest Reference Level (FRL) report to the United Nations Framework Convention on Climate Change (UNFCCC). Using existing NFI data for calibration, Hunka and colleagues developed a geostatistical model-based approach that interpolates between NFI sample units, allowing predictions of AGBD to be made in areas of interest – see Figure 5. (Hunka was lead author on a 2025 paper in Remote Sensing of Environment that describes a similar approach to what she described in this presentation.) UNFCCC called for the modeling approach to be transparent and replicable. Hunka emphasized the importance of access to and preparation of covariate data and called for greater capacity-building and knowledge-transfer support to help other countries adopt GEDI in their reporting. Sudan’s submission marks the first time GEDI data has been used in an FRL report.

    GEDI figure 5
    Figure 5. A geostatistical model-based approach uses data from the Republic of Sudan’s National Forest Inventory (NFI) for calibration and interpolates between NFI sample units, allowing predictions of aboveground biomass density where desired.
    Figure credit: Neha Hunka

    Forests cover about 30% of Earth’s land area, store over 80% of terrestrial biomass and carbon, and absorb around 30% of anthropogenic carbon dioxide (CO₂) emissions. While storing carbon in forests can help mitigate carbon emissions, deforestation, disturbances, shifting global economy, and low confidence in forest carbon credits add risk and uncertainty to this strategy. By monitoring forest biomass, some of these risks can be alleviated. Stuart Davies [Smithsonian Institution] joined the STM to present his work on GEO-TREES, a global forest biomass reference system aiming to provide high-quality, publicly available ground data from a network of long-term forest inventory sites to improve biomass mapping on the global scale. Despite many Earth observing (EO) missions focused on forest biomass, a lack of standardized ground reference data has hindered accurate validation. GEO-TREES addresses this need, by fostering collaboration between carbon monitoring, biodiversity research, and EO communities. The project includes 100 core sites and 200 supplementary sites across tropical and temperate regions, selected to represent environmental and human-use gradients, with greater emphasis on sampling in the tropics. Each core site follows Committee on Earth Observation Satellites (CEOS) protocol and includes three types of measurements: forest plot inventory plot, terrestrial laser scanning, and ALS.

    CST Presentations – Session III

    Atticus Stovall [GSFC] shared first-year findings from his research on post-fire disturbance forest recovery in Mediterranean ecosystems – specifically Spain and Portugal – where the frequency and intensity of wildfires have significantly increased in the 21st century. Using Iberian Forest Inventory ALS data and GEDI footprint data, Stovall and his team showed that GEDI can be used to assess post-fire change as well as evaluate degradation patterns from increasing fire recurrence and intensity. Stovall shared examples demonstrating the use of GEDI to detect both immediate fire effects as well as recovery after disturbance, including stand-replacement and understory clearing. By overlaying disturbance maps with GEDI data, the team observed that recovery rates differ across height class. Looking forward, they plan to investigate how recovery rates vary across environmental gradients and incorporate field plot data to validate their findings.

    KC Cushman [ORNL] presented on biomass calibration and validation (cal/val) activities for the NISAR mission, which launched in July 2025. She outlined the general approach to the NISAR biomass algorithm, which uses multiple observations from NISAR every year to produce annual biomass estimates at 1-ha (0.004 mi2) resolution. Cal/val efforts will use ALS to link sparse field data to larger landscapes with estimates at two or more sites in 15 different ecoregions. NISAR has supported cal/val field plot data collection in Spain, South Africa, and various National Ecological Observatory Network (NEON) sites in addition to ALS campaigns at Agua Salud, Panama, near the Los Amigos Biological Station, Peru, in the Chaco ecosystem, Argentina, and near Madrid, Spain.

    Chi Chen [Rutgers University] presented his work exploring vertical acclimation of vegetation canopy structure and photosynthetic activities using GEDI data. Chen’s research aims to generate gap-free, high-temporal-frequency canopy profile data and to develop a novel framework that integrates GEDI observations into a multi-layer canopy process model. By training a random forest model with spatially discontinuous GEDI PAVD profiles and multiple features, e.g., multiband spectral reflectance, tree height, and forest type, Chen and his team successfully estimated spatially continuous PAI profiles across different canopy heights. The team cross-validated their predicted PAI with GEDI PAI, NEON PAI, and LAI measurements from the Moderate Resolution Imaging Spectroradiometer (MODIS) instrument on NASA’s Terra and Aqua platforms. These data could be used to study seasonal variation in different canopy heights. Using a Global Multilayer Canopy OPTimization (GMC-OPT) model, they also found that GEDI-informed data has the potential to identify the vertical position of “net” seasonal leaf turnover –  ultimately improving the accuracy of estimates of carbon and water fluxes.

    CST Presentations – Session IV

    Marcos Longo [Lawrence Berkeley National Laboratory (LBNL) in transition to Brazilian National Institute for Space Research (INPE)] and his team presented a proposed project that integrates GEDI data with process-based models to assess the impact of wildfires on forest structure, recovery, and ecosystem function. As western US forests face increasing wildfire risk due to drier climates, more human ignitions, and a legacy of fire suppression, changes in forest structure, composition, and function are likely to become more detectable over time. This project, under the leadership of Robinson Negron Juarez [University of California, Irvine and LBNL—PI] aims to quantify biomass changes in mixed conifer forests across California, Oregon, and Washington using both ALS and GEDI data. The team plans to use GEDI L2A and L2B data to assess immediate fire impacts on forest structure, investigate post-fire forest recovery, and establish relationships between forest structure and fire intensity/severity. This information will inform process-based models – e.g., the U.S. Department of Energy’s Functionally Assembled Terrestrial Ecosystem Simulator (FATES) – and support a better understanding of forest resilience under fire disturbance regime changes.

    Ovidiu Csillik [Wake Forest University] presented work using GEDI and ALS to investigate biomass and structural changes in tropical forests. The work, conducted with Michael Keller [NASA/ Jet Propulsion Laboratory (JPL), USFS—PI], aims to use models to quantify changes in tropical forest biomass and evaluate understanding of topical forest productivity drivers. The project will use ALS data from over the Brazilian Amazon and other sites in Brazil, Gabon, French Guiana, Costa Rica, Mexico, and Borneo alongside GEDI data over pantropical regions around the globe. Csillik and Keller are currently conducting ALS–ALS and GEDI–GEDI comparisons, and are planning to estimate aboveground biomass change from ALS–ALS, ALS–GEDI, and GEDI–GEDI comparisons at both regional and pantropical scales from 2008–2026.

    Zhenpeng Zuo [Boston University (BU)] presented his team’s research, led by Ranga Myneni [BU—PI], using mechanistic model-GEDI integration to map potential canopy top height (pCTH) and inform forest restoration planning. Predicting restoration potential is challenging, as empirical, deep-learning, and mechanistic methods vary in their accuracy, interpretability, and spatial detail. This project uses a mechanistic model based on water use and supply equilibrium, calibrated using GEDI canopy height metrics, to predict pCTH. The team found this approach produced robust pCTH predictions and shows that the Eastern US has vast restorable areas. Future work will expand to dynamic modeling to incorporate disturbance risks and effects under different climate scenarios.

    DAAC Reports

    Rupesh Shrestha [ORNL DAAC] presented the status of GEDI L3 and L4 datasets at the ORNL DAAC – see Figure 6. Since the 2023 STM, three new datasets have been released: L4B (country-level summaries of aboveground biomass), L4C (footprint level waveform structural complexity index), and a GEDI-FIA (fusion dataset for training lidar models to forest attributes). In total, almost 34,000 unique users have downloaded GEDI L3 and L4A-C data 13,770,648 times, with L4A being the most popular at 13.1 million downloads. As of April 30, 2025, all GEDI footprint-level datasets from L1–L4 are available with data through mission week 311 (November 2024), besides L4C. Users can look forward to a GEDI L4D Imputation Dataset later in 2025 along with the much-anticipated V3.0 GEDI data product release. All levels of GEDI data can now be accessed in one place through the NASA Earthdata Search and Data Catalog. In addition to the data products themselves, data tools and services, publications citing GEDI data and GEDI data tutorials and workshops can be found at the ORNL DAAC website. The ORNL DAAC provides data user support through the Earthdata Forum, or via their email uso@daac.ornl.gov.

    GEDI figure 6
    Figure 6. GEDI L3 and L4B data projected on NASA WorldView/GIBS API. Explore the program here.
    Figure credit: Rupesh Shrestha

    Jared Beck [Land Processes Distributed Active Archive Center (LP DAAC)] presented on GEDI data products at the LP DAAC, a USGS–NASA partnership that archives and distributes lower-level GEDI products (GEDI L1B, L2A, and L2B). The LP DAAC has distributed over seven petabytes of GEDI data so far, and is now exclusively distributing GEDI data through NASA’s Earth Data Cloud. GEDI L2A is the most popular of the products in terms of terabytes of distribution. Like the ORNL DAAC, data user support also flows through the NASA Earthdata Forum. Tutorials can be found on GitHub. All levels of GEDI data can now be accessed in one place through the NASA Earthdata search and data catalog options.

    GEDI Extended and Demonstrative Products II

    Scott Goetz [NAU] discussed his team’s research leveraging GEDI data for biodiversity applications, emphasizing its potential to help improve species distribution models and the high value of understanding forest structure for conservation assessments. He highlighted a 2022 Nature Ecology & Evolution article showing that forests with higher structural integrity and cover reduced the extinction risk for over 16,000 threatened or declining species. Another 2023 study in Nature demonstrated how biodiversity indicators, such as habitat cover, canopy structure, and human pressures, can influence the effectiveness of protected areas. In order to have a wider variety of gridded products to work with for species distribution models, Pat Burns [NAU], Chris Hakkenberg, and Goetz developed the Gridded GEDI Vegetation Structure Metrics and Biomass Density at Multiple Resolutions product that has been released through the ORNL DAAC and Google Earth Engine along with a data descriptor paper published in a Nature Scientific Data paper – see Figure 7. Burns elaborated that, relative to fusion products, gridded GEDI products performed better when measuring structure, especially in the understory. The team is now comparing species distribution models in mainland Southeast Asia using fusion versus solely GEDI data.

    GEDI figure 7
    Figure 7. GEDI mean foliage height diversity (FHD) map using shots from April 2019 to March 2023 at 6-km (4.7-mi) spatial resolution. Red boxes indicate the approximate location of airborne lidar used for intercomparison. Three insets show GEDI mean FHD at finer spatial resolution [1 km (0.62 mi)] as well as more detailed airborne lidar coverage (red polygons). From left to right the insets show: Sonoma County, California, Coconino National Forest, Arizona, and Sumatra/Borneo.
    Figure credit: From Patrick Burns et al (2024) Nature Scientific Data

    Perspectives III

    STM attendees concluded day two with a perspective talk from Marc Simard [JPL], who showcased a range of studies demonstrating diverse applications of GEDI data, opportunities for its improvement, and potential for informing future scientific research. Drawing on his own work, Simard shared examples of using GEDI data for cal/val of global Digital Elevation Measurement (DEM) and Digital Terrain Model (DTM), mapping global mangrove heights, monitoring forest growth, and analyzing hydrological processes. In more detail, he explained how he led the development of a 12-m (39-ft) spatial resolution global mangrove height product using GEDI and TanDEM-X data. Additionally, he discussed a study evaluating tree growth rates in the Laurentides Wildlife Reserve in Quebec, Canada using both GEDI and ALS. The analysis revealed an average growth rate of approximately 32 ±23 cm (12 ±9 in) per year. Finally, he presented a paper under review examining water level detection and hydrological conditions in coastal regions using GEDI alongside Ice, Cloud, and land Elevation Satellite 2 (ICESat-2) data. In closing, Simard emphasized that GEDI datasets can help identify critical data and knowledge gaps, guiding the development of new missions – e.g., the Surface Topography and Vegetation (STV) mission concept called for in the 2017 Earth Science Decadal Survey report. As described in the STV Study Team Report, the mission would focus on elevation and vertical structure to study the solid Earth, cryosphere, vegetation structure, hydrology, and coastal geomorphology.

    DAY THREE

    CST Presentations – Session V

    Jody Vogeler [Colorado State University] opened the final CST presentation session with an overview of her research using GEDI data fusions to characterize post-fire landscapes and understand habitat refugia for the threatened Canada lynx (Lynx canadensis). This project builds on her team’s phase-I work, which produced 30-m (98-ft) resolution gridded GEDI fusion maps across six Western U.S. states to support habitat and diversity applications related to cavity-nesting birds, small mammals, and carnivore–prey relationships. The team is now focusing on validating and improving their GEDI fusion products within post-disturbance landscapes, specifically post-fire. Using this data, Vogeler and her team aim to better understand how post-fire structural information from GEDI improves their ability to understand lynx behavior–habitat relationships across early post-fire landscapes. This information can help evaluate what structural attributes determine post-fire refugia patch use by lynx. Next steps for this work include integrating GEDI V3.0 data upon its release, identifying new GEDI metrics and derived products, and incorporating lynx radio-collar data into their analyses. Vogeler also presented her work as co-PI on a NASA Ecological Conservation Project in Greater Kruger National Park, South Africa, where she and her team are developing spatial monitoring tools to support management and conservation planning.

    Jingfeng Xiao [University of New Hampshire] provided updates on his team’s research using GEDI data to understand how structural diversity influences productivity and carbon uptake of forests in the United States. The project aims to assess GEDI’s ability to quantify structural diversity, investigate how that diversity regulates forest productivity and carbon uptake, and understand its role in resilience of forest productivity to drought. When analyzing the relationships of gross primary production (GPP) and evapotranspiration (ET) with canopy structure metrics, the team found that increased canopy structure complexity positively affected GPP and ET and reduced their seasonal variability. They also found that greater canopy complexity improved ecosystem resistance to drought. As part of the project, the team also produced 1-km (0.62-mi) resolution gridded maps of GPP and ET.

    Lei Ma [UMD] delivered the final talk of the STM, presenting his project that integrates GEDI observations with mechanistic ecosystem modeling to quantify forest regrowth in a changing climate. Ma used GEDI data and the Ecosystem Demography (ED) model in his research and found that height and aboveground biomass (AGB) regrowth rates can be derived by combining GEDI and land-use and land-cover change data. Ma found that regrowth rates derived from different inputs are generally consistent at large scales but variable at fine scales. Notably, regrowth rates showed temporal dependence, decreasing by roughly 50% every decade. Lastly, Ma and his team found that spatial variation in height and AGB regrowth rates can be partially explained by environmental conditions and disturbance frequency.

    Conclusion

    The 2025 GEDI STM was especially exciting, as it came on the cusp of post-storage data being processed and released as V2.1. Additionally, it marked the first time the new CST cohort presented on their research and joined breakout sessions with the wider GEDI team. The meeting highlighted the mission’s ongoing success and scientific value following hibernation on the ISS. Looking ahead, data users can anticipate the V3.0 product release later in 2025.

    Talia Schwelling
    University of Maryland College Park
    tschwell@umd.edu

    Details

    Last Updated

    Aug 18, 2025

  • A Decade of Global Water Cycle Monitoring: NASA Soil Moisture Active Passive Mission

    Feature Article header

    21 min read

    A Decade of Global Water Cycle Monitoring: NASA Soil Moisture Active Passive Mission

    Introduction

    The NASA Soil Moisture Active Passive (SMAP) mission, launched in 2015, has over 10 years of global L-band radiometry observations. The low frequency [1.4 GHz frequency or 21 cm (8 in) wavelength] measurements provide information on the state of land surfaces in all weather conditions – regardless of solar illumination. A principal objective of the SMAP mission is to provide estimates of surface soil moisture and its frozen or thawed status. Over the land surface, soil moisture links the water, energy, and carbon cycles. These three cycles are the main drivers of regional climate and regulate the functioning of ecosystems.

    The achievement of 10 years in orbit is a fitting time to reflect on what SMAP has accomplished. After briefly discussing the innovative measurement approach and the instrument payload (e.g., a radiometer and a regrettably short-lived L-band radar), a significant section of this article is devoted to describing the mission’s major scientific achievements and how the data from SMAP have been used to serve society (e.g., applied sciences) – including SMAP’s pathfinding role as Early Adopters. This content is followed by a discussion of how SMAP has dealt with issues related to radio frequency interference in the L-Band region, a discussion of the SMAP data products suite, future plans for the SMAP active–passive algorithm, and a possible follow-on L-band global radiometry mission being developed by the European Union’s Copernicus Programme that would allow for data continuity beyond SMAP. This summary for The Earth Observer is excerpted from a longer and more comprehensive paper that, as of this article’s posting, is being prepared for publication in the Proceedings of the Institute of Electrical and Electronics Engineers (IEEE).

    SMAP Measurement Approach and Instruments

    The SMAP primary and operating instrument is the L-band radiometer, which collects precise surface brightness temperature data. The radiometer includes advanced radio frequency interference (RFI) detection and mitigation hardware and software. The radiometer measures vertical and horizontal polarization observations along with the third and fourth Stokes parameters (T3 and T4) of the microwave radiation upwelling from the Earth. The reflector boom and assembly, which includes a 6 m (20 ft) deployable light mesh reflector, is spun at 14.6 revolutions-per-minute, which creates a 1000 km (621 mi) swath as the SMAP satellite makes its Sun-synchronous orbit of the Earth – see Figure 1. This approach allows coverage of the entire globe in two to three days with an eight-day exact repeat. The radiometer instrument is calibrated monthly by pointing it to the deep sky.

    SMAP figure 1
    Figure 1. An artist’s rendering of the SMAP Observatory showing both the radiometer and radar.
    Figure credit: NASA/Jet Propulsion Laboratory/California Institute of Technology

    The original SMAP instrument design included a companion L-band radar, which operated from April through early July 2015, acquiring observations of co- and cross-polarized radar backscatter at a spatial resolution of about 1 km (0.6 mi) with a temporal revisit of about three days over land. This data collection revealed the dependence of L-band radar signals on soil moisture, vegetation water content, and freeze thaw state. The radar transmitter failed on July 7, 2015. Shortly thereafter, the radar receiver channels were repurposed to record the reflected signals from the Global Navigation Satellite System (GNSS) constellation in August 2015, making SMAP the first full-polarimetric GNSS reflectometer in space for the investigation of land surface and cryosphere.

    Scientific Achievements from a Decade of SMAP Data

    A decade of SMAP soil moisture observations have led to a plethora of scientific achievements. The data have been used to quantify the linkages of the three main metabolic cycles (e.g., carbon, water, and energy) on land. They have also been used to improve drought assessments and flood prediction as well as the accuracy of numerical weather prediction (NWP) models. They are also used to measure liquid water and thickness of ice sheets, and sea surface salinity. The subsections that follow describe how SMAP data are being put to use in myriad ways that benefit society.

    Quantifying Processes that Link the Terrestrial Water, Energy, and Carbon Cycles

    The primary SMAP science goal is to develop observational benchmarks of how the water, energy, and carbon cycles link together over land. Soil moisture is the variable state of the land branch of the water cycle. It links the water cycle to the energy cycle through limiting latent heat flux – the change in energy as heat exchanges when water undergoes a phase change, such as evapotranspiration at the land–atmosphere interface. Soil moisture also links the water and carbon cycles, which is evident through plant photosynthesis. SMAP global observations of soil moisture fields, in conjunction with remote sensing of elements of the energy and carbon cycles, can reveal how these three cycles are linked in the real world as a benchmark for weather and Earth system models.

    Photosynthesis is down-regulated by both the deficit in water availability and the lack of an adequate amount of photosynthetically active radiation. Global maps reveal how soil moisture and light regulate photosynthesis – see Figure 2. These benchmark observational results can be used to assess how Earth system models link to the three main metabolic cycles of the climate system.

    SMAP figure 2
    Figure 2. Observed regulation of photosynthesis by water availability [left] and light availability [right]. Blue denotes greater limitation. Photosynthesis rates for both maps determined using solar-induced fluorescence (SIF) measurements (mW/m2 nm sr) from the Tropospheric Ozone Monitoring Instrument (TROPOMI) on the European Union’s Copernicus Sentinel-5P mission. Water availability was determined using soil moisture (SM) measurements from the Soil Moisture Active Passive (SMAP) mission. Light availability was determined using measurements of photosynthetically active radiation (PAR) from the Moderate Resolution Imaging Spectroradiometer (MODIS) on NASA’s Terra and Aqua platforms. The resulting maps show the model slope (mW/m2/nm/sr) of the estimated SIF-SM relationship in the water-limited regime [left] and the model slope (10-3/nm/sr) of estimated SIF-PAR relationship in the light-limited regime [right].
    Figure credit: Jonard et al (2022) in Biogeosciences

    Development of Improved Flood Prediction and Drought Monitoring Capability

    SMAP products have also been widely used in applied sciences and natural hazard decision-support systems. SMAP’s observation-based soil moisture estimates offer transformative information for managing water-related natural hazards, such as monitoring agricultural drought – defined as a persistent deficit in soil moisture – and flood volumes – defined as the landscape’s water absorption capacity during precipitation events. The SMAP project produces a parallel, near-real-time data stream that is accessed by a number of federal and state agencies in decision-support systems related to drought monitoring, food security, and landscape inundation and trafficability.

    Enhancing Weather and Climate Forecasting Skill

    SMAP’s enhancement of numerical weather prediction, model skill, and reduction of climate model projection uncertainties is based on the premise of the contribution of solar energy to weather and climate dynamics. Soil moisture has a strong influence on how available solar energy is partitioned into components (e.g., sensible heat flux versus latent heat flux) over land. The influence propagates through the atmospheric boundary layer and ultimately influences the evolution of weather.

    To give an example, land surface processes can affect the evolution of the U.S. Great Plains low-level jets (GPLLJs). These jets drive mesoscale convective weather systems. Previous studies have shown that GPLLJs are sensitive to regional soil moisture gradients. Assimilation of SMAP soil moisture data improves forecasts of weakly synoptically forced or uncoupled GPLLJs compared to forecasts of cyclone-induced coupled GPLLJs. For example, the NASA Unified Weather Research and Forecasting Model, with 75 GPLLJs at 9 km (5.6 mi) resolution both with and without SMAP soil moisture data assimilation [SMAP data assimilation (DA) and no-DA respectively], shows how the windspeed mean absolute difference between SMAP DA and no-DA increase approximately linearly over the course of the simulation with maximum differences at 850 hPa (or mb) for the jet entrance and core – see Figure 3.

    SMAP figure 3
    Figure 3. The impact of adding soil moisture data [SMAP data assimilation (DA) minus no-DA] to a model simulation from theNASA Unified Weather Research and Forecasting Model (NU-WRF)) of the Great Plains Low Level Jet (GPLLJ). The results show the mean over 75 independent GPLLJ events. The plots correspond to wind speed difference with height (y-axis) and time (hours on x-axis). The panels are for jet entrance [left], jet core [middle] and jet exit [right]. Soil moisture data assimilation enhances the intensity of the simulated GPLLJ. The stippling corresponds to 99% statistical confidence.
    Figure credit: Ferguson (2020) in Monthly Weather Review

    Measuring Liquid Water Content and Thickness of Ice Sheets

    The mass loss of Greenland and Antarctica ice sheets contributes to sea-level rise – which is one of the most impactful and immediate damaging consequences of climate change. The melt rates over the last few years have raised alarm across the globe and impact countries with coastal communities. The cryosphere community has raised a call-to-action to use every observing system and model available to monitor the patterns and rates of land ice melt.

    Surface melt affects the ice cap mass loss in many ways: the direct melt outflow from the ablation zone of the Greenland ice sheet, the structural change of the percolation zone of the Greenland ice sheet, changes in the melt water retention and outflow boundaries, changes in the structure of the Antarctic ice shelves, and destabilization of the buttressing of the glacier outflow through various processes (e.g., hydrofracturing and calving). The long-term climate and mass balance models rely on accurate representation of snow, firn, and ice processes to project the future sea level.

    The SMAP L-band radiometer has relatively long wavelength [21 cm (8 in)] observations compared to other Earth-observing instruments. It enables the measurement of liquid water content (LWC) in the ice sheets and shelves as it receives the radiation from the deep layers of the snow/firn/ice column. Relatively high LWC values absorb the emission only partially, making the measurement sensitive to different liquid water amounts (LWA) in the entire column. Figure 4 shows the cumulative LWA for 2015–2023 based on SMAP measurements.  

    SMAP figure 4
    Figure 4. Total annual sum of SMAP daily liquid water amount (LWA) for 2015–2023. The black solid line on each map represents grid edges, and the grey color mask inside the ice sheet indicates melt detections by decreasing brightness temperature.
    Figure Credit: Andreas Colliander [Finnish Meteorological Institute].

    The SMAP L-band radiometer has also been used to derive the thickness of thin sea ice [< 0.5–1 m (<1.6–3.3 ft)] across both the Arctic and Southern Ocean. Thin ice thickness retrievals from the European Space Agency’s (ESA) Soil Moisture and Ocean Salinity (SMOS) mission have been recalibrated to SMAP, using the same fixed incidence angle. The data show strong agreement and demonstrate clear benefits of a combined dataset. The L-band thin ice thickness retrievals provide a useful complement to higher-resolution profiles of thicker ice obtained from satellite altimeters (e.g. ESA’s CryoSat-2 and NASA’s Ice, Clouds and land Elevation Satellite–2 missions).

    Extending and Expanding the Aquarius Sea Surface Salinity Record

    The joint NASA/Argentinian Aquarius/Satélite de Aplicaciones Científicas (SAC)-D (Aquarius), which operated from 2011–2015, used an L-band radiometer and an L-band scatterometer to make unprecedented monthly maps of global sea surface salinity at 150-km (93-mi) resolution. The SMAP L-band radiometer has not only extended the sea surface salinity record in the post-Aquarius period, it has also increased the spatial resolution and temporal frequency of these measurements because of its larger reflector and wider swath. The increased resolution and revisit allow new and unprecedented perspectives into mixing and freshwater events, coastal plume tracking, and other more local oceanic features.

    Providing New Perspectives on Global Ecology and Plant Water Stress

    The L-band vegetation optical depth (VOD) – which is related to water content in vegetation – has been retrieved simultaneously with soil moisture using SMAP’s dual-polarized brightness temperatures and is being used to better understand global ecology. Water in above-ground vegetative tissue attenuates and thus depolarizes surface microwave emission, and VOD quantifies this effect. SMAP can provide global observations of VOD in all weather conditions with a two to three day temporal frequency. Changes in VOD indicate either plant rehydration or growth. Ecologists benefit from this new ecosystem observational data, which augments optical and near-infrared vegetation indices [e.g., leaf area index (LAI)] and has a higher temporal frequency that is not affected by clouds and does not saturate as rapidly for dense vegetation.

    Examples of how the data have been used include deciphering the conditions when vegetation uptakes soil water only for rehydration (i.e., VOD increase with no LAI change) compared to plant growth (i.e., increase in both VOD and LAI). The applications of VOD are increasing and the ecology community views this product as a valuable additional perspective on soil–plant water relations.

    At the moment, this measurement has no ground-based equivalent. Therefore, field experiments with airborne instruments and ground sampling teams are needed to firmly establish the product as a new observational capability for global ecology.

    Applied Science Collaboration: SMAP Observations Serving Society

    The SMAP project has worked with the NASA Earth Science Division Applied Sciences Program (now known as Earth Science to Action) and the natural hazards monitoring and forecasting communities for pre- and post-launch implementation of SMAP products in their operations. In some operational applications, for which long-term data continuity is a requirement, the SMAP data are still used for assessment of current conditions, as well as research and development.

    The Original Early Adopters

    Prior to its launch, the SMAP mission established a program to explore and facilitate applied and operational uses of SMAP mission data products in decision-making activities for societal benefit. To help accomplish these objectives, SMAP was the first NASA mission to create a formal Applications Program and an Early Adopter (EA) program, which eventually became a requirement for all future NASA Earth Science directed satellite missions. SMAP’s EA program increases the awareness of mission products, broadens the user community, increases collaboration with potential users, improves knowledge of SMAP data product capabilities, and expedites the distribution and uses of mission products after launch.

    SMAP Data in Action

    Several project accomplishments have been achieved primarily through an active continuous engagement with EAs and operational agencies working towards national interests. SMAP soil moisture data have been used by the U.S. Department of Agriculture (USDA) for domestic and international crop yield applications. For example the USDA’s National Agricultural Statistics Service (NASS) conducts a weekly survey of crop progress, crop condition, and soil moisture condition for U.S. cropland. NASS surveys and publishes state-level soil moisture conditions in the NASS Crop Progress Report.

    The traditional field soil moisture survey is a large-scale, labor-intensive data collection effort that relies heavily on responses from farmers, agricultural extension agents and/or other domain experts for field observations. One weakness of these observations is that they are based on subjective assessments rather than quantitative measures and can lead to spatial inconsistency based on the human responses from the respective counties. Moreover, the NASS Crop Progress Reports do not provide specific geolocation information for the assessed soil moisture conditions – which are extremely useful metadata to provide to data users. NASS implemented the use of SMAP observations in their weekly reports during the growing period (March–November). SMAP maps estimated root-zone soil moisture for the week of November 14–20, 2022, over NASS Pacific (California and Nevada) and Delta (Arkansas, Mississippi and Louisiana) regional domains—see Figure 5.

    SMAP figure 5
    Figure 5. SMAP-based soil moisture estimates for California, Nevada, Arkansas, Mississippi, and Louisiana, used by the U.S. Department of Agriculture’s (USDA) National Agricultural Statistics Service (NASS) in their weekly report covering November 14–20, 2022. These data are available for selected states at the NASS website linked in the text.
    Figure Credit: NASS

    SMAP Radio Frequency Interference Detection and Mitigation

    Although SMAP operates within the protected frequency allocation of 1400–1427 MHz, the radiometer has been impacted by radio frequency interference over the mission lifetime. Unauthorized in-band transmitters as well as out-of-band emissions from transmitters operating adjacent to the allocated spectrum have been observed in SMAP measurements since its launch. The previously launched SMOS and Aquarius radiometers provide evidence of global RFI at L-band. Consequently, SMAP was designed to incorporate a novel onboard digital detector on the back end to enable detection and filtering of RFI. The radiometer produces science data in time and frequency, enabling the use of multiple RFI detection methods in the ground processing software.

    On-orbit data demonstrate that the RFI detection and filtering performs well and improves the quality of SMAP brightness temperature measurements. The algorithms are most effective at filtering RFI that is sparse in time and frequency, with minimal impact on the noise equivalent delta temperature (NEDT) – a measure of the radiometer sensitivity. Some areas of the globe remain problematic as RFI that is very high level and persistent results in high percentages of data loss due to removal of contaminated data. A global map of RFI detection rate for January 2025 shows a large contrast between Eastern and Western Hemispheres and between Northern and Southern Hemispheres – see Figure 6. Regions of isolated RFI and severe RFI correspond to populated areas. A detection rate of 100% means all pixels are flagged and removed, resulting in data loss. Analysis of spectral information reveal many sources are likely terrestrial radar systems; however, many wideband, high-level sources and low-level, non-radar sources also persist. Over areas of geopolitical conflict, the time-frequency data show interference covering the entire radiometer receiver bandwidth.

    SMAP figure 6
    Figure 6. Percentage of pixels on a 0.25° grid for January 2025 that have been flagged for removal by the Soil Moisture Active Passive radio frequency interference detection algorithms.
    Figure Credit: Priscilla N. Mohammed [GSFC]

    The RFI challenge is further addressed through official spectrum management channels and formal reports that include the geolocated coordinates of sources, interference levels, frequency of occurrence during the observed period, and spectral information – all of which aid field agents as they work to identify potential offenders. Reports are submitted to the NASA Spectrum office and then forwarded to the country of interest through the Satellite Interference Reporting and Resolution System.

    SMAP Science Data Products

    The current suite of SMAP science data products is available in the Table. The principal data products are grouped in four levels designated as L1–4. The L1 products are instrument L-band brightness temperature in Kelvin and include all four Stokes parameters (i.e., horizonal and vertical polarization as well as third and fourth Stokes). Both 6:00 AM equatorial crossing (descending) and 6:00 PM equatorial crossing (ascending data) are contained in the products. The user has access to quality flags of the conditions under which measurements are available for each project. The L1B products are time-ordered and include fore and aft measurements. L1C products are on the Equal-Area Scalable Earth V2 (EASE2) grid with polar and global projections. L2 data products are geophysical retrievals (i.e., soil moisture, VOD, and binary freeze/thaw classification on a fixed Earth grid). The L2 half-orbit products are available to the public within a day of acquisition. L3 products are daily composites and include all half-orbits for that day.

    The SMAP project also produces L4 data that are the result of data assimilation. The L4 products take advantage of other environmental observations, such as precipitation, air temperature and humidity, radiative fluxes at the land surface, and ancillary land use and soil texture information, to produce estimates of surface [nominally 0–5 cm (0–2 in)] and subsurface (e.g., root-zone up to a meter) soil moisture. The data assimilation system is a merger of model and measurements and hence resolves the diurnal cycle of land surface conditions. The data assimilation system also provides estimates of surface fluxes of carbon, energy, and water, such as evaporation, runoff, gross primary productivity (GPP), and respiration. The difference between GPP and respiration is the net ecosystem exchange, which is the net source/sink of the carbon cycle over land.

    The SMAP suite of products also include near-real-time (NRT) brightness temperature and soil moisture products for use in operational weather forecast applications. The NRT product targets delivery to users within three hours of measurement acquisition. The NRT uses predicted SMAP antenna pointing (instead of telemetry) and model predicted ancillary data (soil temperature) in order to support operational centers that require more than three hours of data products for updating weather forecast models. To date SMAP has met its required and target (for NRT) latency requirements.

    Two other data projects merge synergistically with other (colocated) satellite measurements. The SPL2SMAP_S merges SMAP L-band radio brightness measurements with C-band synthetic aperture radar (SAR) measurements from the ESA Copernicus Sentinel-1 mission. The SAR data have high resolution and allow the generation of 1 and 3 km (0.62 and 1.8 mi) merged surface soil moisture estimates. The high resolution soil moisture information, however, is only available when there is coincident SMAP and Sentinel-1 measurements. The refresh rate of this product is limited and can be as long as 12 days.

    The merged SMOS–SMAP passive L-band radiometry data allows the generation of global, near daily surface soil moisture estimates, which are required to resolve fast hydrologic processes, such as gravity drainage and recharge flux. These parameters are only partially resolved with the SMAP, with a two to three day data refresh rate. This product interpolates the multi-angular SMOS data to the SMAP 40º incident angle and uses all SMAP algorithms, including correction of waterbody impact on SMAP brightness temperature, and ancillary data for geophysical inversions to soil moisture and VOD, ensuring consistency. The combined SMAP–SMOS data product may not be available daily across locations, such as Japan, parts of China, and the Middle East, where RFI affects data collection.

    Table. Soil Moisture Active Passive suite of science products are available through the National Snow and Ice Data Center, one of NASA’s Distributed Active Archive Centers.

    Product Type Product description Resolution (Gridding) Granule Extent
    SPL1BTB Geolocated, calibrated brightness temperature in time order 36 km Half Orbit
    SPL1CTB_E Backus-Gilbert interpolated, calibrated brightness temperature in time order (9 km) Half Orbit
    SPL1CTB Geolocated, calibrated brightness temperature on Equal-Area Scalable Earth V2 (EASE2) grid 36 km Half Orbit
    SPL1CTB_E Backus-Gilbert interpolated, calibrated brightness temperature on EASE2 grid (9 km) Half Orbit
    SPL2SMP Radiometer soil moisture and vegetation optical depth 36 km Half Orbit
    SPL2SMP_E Radiometer soil moisture and vegetation optical depth based on SPL1CTB (9 km) Half Orbit
    SPL2SMAP_S SMAP radiometer/Copernicus Sentinel-1 soil moisture 3 km Sentinel-1
    SPL3SMP Daily global composite radiometer soil moisture and vegetation optical depth based on SPL1CTB 36 km Daily–Global
    SPL3SMP_E Daily global composite radiometer soil moisture and vegetation optical depth based on SPL1CTB_E (9 km) Daily–Global
    SPL3FTP Daily composite freeze/thaw state based on SPL1CTB 36 km Daily–Global
    SPL3FTP_E Daily composite freeze/thaw state based on SPL1CTB_E (9 km) Daily–Global
    SPL4SMAU Surface and Root Zone soil moisture 9 km 3 hours – Global
    SPL4CMDL Carbon Net Ecosystem Exchange 9 km Daily–Global
    SPL1BTB_NRT Near Real Time Geolocated, calibrated brightness temperature in time order 36 km Half Orbit
    SPL2SMP_NRT Near Real Time Radiometer soil moisture 36 km Half Orbit
    L2/L3 SMOS SM SMOS soil moisture and VOD based on SMAP algorithms (9 km) Half Orbit/Daily Global

    Future Directions for the SMAP Active–Passive Algorithm

    Although the SMAP radar failed not long after launch, the data that were collected have been used to advance the development of the SMAP Active–Passive (AP) algorithm, which will be applied to the combined SMAP radiometer data and radar data from the NASA–Indian Space Research Organisation (ISRO) Synthetic Aperture Radar [NISAR] mission, a recently-launched L-Band Synthetic Aperture mission to produce global soil moisture at a spatial resolution of 1 km (0.62 mi) or better. The high resolution product can advance applications of SMAP data (e.g., agricultural productivity, wildfire, and landslide monitoring).

    Data Continuity Beyond SMAP

    A forthcoming mission meets some – but not all – of the SMAP measurement requirements and desired enhancements. The European Union’s Copernicus Program Copernicus Imaging Microwave Radiometer (CIMR) mission is a proposed multichannel microwave radiometry observatory that includes L-band and four other microwave channels sharing a large mesh reflector. The mesh reflector is similar to the one that is used on SMAP, but larger. The successful SMAP demonstration of rotating large deployable mesh antennas for Earth observations has been useful to the CIMR design.

    In terms of RFI detection capability, CIMR will also use an approach that is similar to SMAP. With regard to instrument thermal noise (NEDT) and data latency, CIMR meets or comes close to the next-mission desired characteristics and equals or exceeds SMAP in most of the attributes. The native L-band resolution of CIMR is ~60 km (37 mi); however, the measurements are coincident and higher-resolution measurements in this configuration allow reconstruction of L-band radiometry at higher resolution than CIMR’s L-band. It may be possible to combine the L- and C-bands and achieve a reconstructed ~15 km (9 mi) L-band product based on the coincident and overlapping measurements. A refresh rate of one day is possible with the wide-swath characteristic of CIMR.

    CIMR is currently in development; the first version, CIMR-1A, is expected to launch within this decade and the second version, CIMR-1B, in the mid 2030s. Since the Copernicus program supports operational activities (e.g., numerical weather prediction), the program includes plans for follow-on CIMR observatories so that the data record will be maintained without gaps in the future.

    Conclusions

    The SMAP mission was launched in 2015 and has produced over 10 years of science data. Because of its unique instrument and operating characteristics, the global low-frequency microwave radiometry with the SMAP observatory has resulted in surface soil moisture, vegetation optical depth, and freeze/thaw state estimates that outperform past and current products. The data have been widely used in the Earth system science community and also applied to natural hazards applications.

    The Earth system science and application communities are actively using the decade-long, high-quality global L-band radiometry. The intensity and range of SMAP science data usage is evident in the number of peer-reviewed journal publications that contain SMAP or Soil Moisture Active Passive in their title or abstract and use SMAP data in the study (i.e., search: www.webofscience.com data-base). The authors acknowledge that many publications escape this particular query approach. Currently the bibliography includes over 1700 entries and over 20,000 citations spanning several elements of Earth system science, including hydrologic science and regional and global water cycle, oceanic and atmospheric sciences, cryosphere science, global ecology as well as microwave remote sensing technologies.

    To Learn More About SMAP

    A more comprehensive bibliography of studies published based on SMAP data products, a set of one-page SMAP science and applications highlights in standardized format, and SMAP project documents including assessment reports are all available online via the links provided.

    Black Separator Line

    Acknowledgements

    The authors wish to acknowledge the contributions of the SMAP Science Team, the SMAP Algorithm Development Team, and the SMAP Project Office engineers and staff. All of these teams contribute to the ongoing SMAP science product generation and uses reported in this article.

    Black Separator Line

    Dara Entekhabi
    Massachusetts Institute of Technology
    darae@mit.edu

    Simon Yueh
    Jet Propulsion Laboratory/California Institute of Technology
    simon.h.yueh@jpl.nasa.gov

    Rajat Bindlish
    NASA Goddard Space Flight Center
    rajat.bindlish@nasa.gov

    Mark Garcia
    Jet Propulsion Laboratory/California Institute of Technology
    mark.d.garcia@jpl.nasa.gov

    Jared Entin
    NASA Headquarters
    jared.k.entin@nasa.gov

    Craig Ferguson
    NASA Headquarters
    craig.r.ferguson@nasa.gov

    Details

    Last Updated

    Aug 18, 2025

    Related Terms

  • Portable Planetarium takes Thousands of Alaskan Students on a Cosmic Adventure

    3 min read

    Portable Planetarium takes Thousands of Alaskan Students on a Cosmic Adventure

    Exploring the Cosmos and Inspiring Young Minds

    From January through June 2025, the Education Outreach Office at the University of Alaska Fairbanks Geophysical Institute (GI) continued its mission of bringing science to life by delivering the magic of its portable planetarium to communities across Alaska. This year, they reached over 1,807 students, educators, and participants through engaging, interactive astronomy experiences.

    The portable planetarium is more than just a dome. It’s a getaway to curiosity, discovery and connection. Especially in Alaska’s long, cold winters, the dome offers a warm and welcoming space where learners of all ages can look up, wonder, and learn together. After experiencing the planetarium, feedback from students across the state reflects increased excitement about space, science, and their own place in the universe.

    Inside the Dome: The Presentation

    Each session begins with a warm introduction, a safety briefing, and a land acknowledgement. Participants experience constellations, planets, and space science concepts through dynamic storytelling and exciting visuals. The presentations connects ancient skywatching traditions with modern science, reminding students that long before the internet, the stars were a source of direction and knowledge. The presentation begins on Earth, exploring the State of Alaska, discussing the moon’s phases, and then, journeys outward to Mars, the last rocky planet, before reaching the gas giants. A standout moment of experience is the “Planet Walk” — an interactive journey from the Sun through the solar system. Learners leave with a new favorite word: ‘heliophysics,’ the science of the Sun and its influence on the solar system.

    People Behind the Program

    Knowledgeable presenters bring science to life with energy, empathy, and enthusiasm, engaging diverse audiences and making the event a memorable and impactful experience. Soumitra Sakhalkar, for example, is a GI graduate student researcher studying remote sensing of permafrost regions. Another presenter, Austin Smith, is a GI graduate student researcher in space physics. Several GI Communications staff members also contribute to the program’s success with logistics and technology support, crowd control and more.

    Giving Thanks

    This program is funded in part by the NASA Heliophysics Education Activation Team, which is part of NASA’s Science Activation Portfolio. Learn more about how Science Activation connects NASA science experts, content, and experiences with community leaders to do science in ways that activate minds and promote deeper understanding of our world and beyond: https://science.nasa.gov/learn/about-science-activation/. The remainder of the funding was generously supported by schools and organizations requesting the planetarium program.

    One participant shares their planetary knowledge and enthusiasm after attending a planetarium program on January 28, 2025 in collaboration with Fairbanks BEST Homeschool Network.
    Kalee Meurlott

    Details

    Last Updated

    Aug 18, 2025

    Editor
    NASA Science Editorial Team
  • NASA-Developed Printable Metal Can Take the Heat

    3 min read

    Preparations for Next Moonwalk Simulations Underway (and Underwater)

    A metallic cast of the NASA insignia. Half of the disk is silver, while the other half is ablaze, subjected to high heat.
    GRX-810 is a new metal alloy developed by NASA for 3D printing parts that can withstand the extreme temperatures of rocket engines, allowing affordable printing of high-heat parts.
    NASA

    Until now, additive manufacturing, commonly known as 3D printing, of engine components was limited by the lack of affordable metal alloys that could withstand the extreme temperatures of spaceflight. Expensive metal alloys were the only option for 3D printing engine parts until NASA’s Glenn Research Center in Cleveland, Ohio, developed the GRX-810 alloy.

    The primary metals in the GRX-810 alloy include nickel, cobalt, and chromium. A ceramic oxide coating on the powdered metal particles increases its heat resistance and improves performance. Known as oxide dispersion strengthened (ODS) alloys, these powders were challenging to manufacture at a reasonable cost when the project started. 

    However, the advanced dispersion coating technique developed at Glenn employs resonant acoustic mixing. Rapid vibration is applied to a container filled with the metal powder and nano-oxide particles. The vibration evenly coats each metal particle with the oxide, making them inseparable. Even if a manufactured part is ground down to powder and reused, the next component will have the qualities of ODS.

    The benefits over common alloys are significant – GRX-10 could last up to a year at 2,000°F under stress loads that would crack any other affordable alloy within hours. Additionally, 3D printing parts using GRX-810 enables more complex shapes compared to metal parts manufactured with traditional methods.

    Elementum 3D, an Erie, Colorado-based company, produces GRX-810 for customers in quantities ranging from small batches to over a ton. The company has a co-exclusive license for the NASA-patented alloy and manufacturing process and continues to work with the agency under a Space Act Agreement to improve the material.

    “A material under stress or a heavy load at high temperature can start to deform and stretch almost like taffy,” said Jeremy Iten, chief technical officer with Elementum 3D. “Initial tests done on the large-scale production of our GRX-810 alloy showed a lifespan that’s twice as long as the small-batch material initially produced, and those were already fantastic.”

    Commercial space and other industries, including aviation, are testing GRX-810 for additional applications. For example, one Elementum 3D customer, Vectoflow, is testing a GRX-810 flow sensor. Flow sensors monitor the speed of gases flowing through a turbine, helping engineers optimize engine performance. However, these sensors can burn out in minutes due to extreme temperatures. Using GRX-810 flow sensors could improve airplane fuel efficiency, reduce emissions and hardware replacements.

    Working hand-in-hand with industry, NASA is driving technology developments that are mutually beneficial to the agency and America’s space economy. Learn more: https://spinoff.nasa.gov/

  • Human Rating and NASA-STD-3001

    3 min read

    Preparations for Next Moonwalk Simulations Underway (and Underwater)

    Human-rating is a critical certification process that validates the safety, reliability, and suitability of space systems—including orbiters, launch vehicles, rovers, spacesuits, habitats, and other crewed elements—for human use and interaction. This process ensures that systems are designed not only to protect human life but also to accommodate human needs and effectively integrate human capabilities. Human-rating requires that systems can tolerate failures, provide life-sustaining environments, and offer the crew sufficient control and situational awareness. NASA’s standards, such as a maximum allowable probability of loss of crew of 1 in 500 for ascent or descent, reflect the agency’s commitment to minimizing risk in human spaceflight.

    Over the decades, the concept of human-rating has evolved significantly. Early efforts focused primarily on basic crew survival and redundancy in critical systems. Today, human-rating is an interdisciplinary effort that integrates engineering, medical, operational, and various other expertise to ensure that systems are not only survivable but also support optimal human function in extreme environments. As missions became more complex and extended in duration, the scope of human-rating will continue to evolve to meet the demands of space travel.

    Modern human-rating standards—such as NASA Procedural Requirements (NPR) 8705.2CNASA-STD-8719.29 (Technical Requirements for Human-Rating), and NASA-STD-3001 (Human System Standards)—form the foundation of NASA’s approach. These documents emphasize risk-informed design, fault tolerance, human factors engineering, and the ability to recover from hazardous situations. They also provide detailed guidance on system safety, crew control interfaces, abort capabilities, and environmental health requirements. Together, they ensure that human spaceflight systems are designed to accommodate, utilize, and protect the crew throughout all mission phases.

    The human-rating certification process is rigorous and iterative. It involves extensive testing, validation, and verification of system performance, including simulations, flight tests, and integrated safety analyses. Certification also requires continuous monitoring, configuration control, and maintenance to ensure that systems remain in their certified state throughout their operational life. Importantly, human-rating is not just a checklist of technical requirements—it represents a cultural commitment to crew safety. It fosters a mindset in which every team member, from design engineers to mission operators, shares responsibility for protecting human life.

    To support program and project teams in applying these standards, NASA has conducted cross-reviews of documents like NASA-STD-3001 in relation to NASA-STD-8719.29. These assessments help identify relevant human health and performance requirements that should be considered during system design and development. While not a substitute for detailed applicability assessments, such reviews provide valuable guidance for integrating human-rating principles into mission planning and vehicle architecture.

    NASA/Sydney Bergen-Hill
  • NASA Astronauts to Answer Questions from Students in Minnesota

    The crew of NASA’s SpaceX Crew-11 mission pose for a photo during a training session.
    Credit: SpaceX

    NASA astronauts Michael Fincke and Zena Cardman will connect with students in Minnesota as they answer prerecorded science, technology, engineering, and mathematics (STEM) questions aboard the International Space Station.

    The Earth-to-space call will begin at 11 a.m. EDT on Wednesday, Aug. 20, and will stream live on the agency’s Learn With NASA YouTube channel.

    Media interested in covering the event must RSVP by 5 p.m., Tuesday, Aug. 19, to Elizabeth Ross at: 952-838-1340 or elizabeth.ross@pacer.org.

    The PACER center will host this event in Bloomington for students in their Tech for Teens program. The organization aims to improve educational opportunities and enhance the quality of life for children and young adults with disabilities and their families. The goal of this event is to help educate and inspire teens with disabilities to consider opportunities in STEM fields.

    For nearly 25 years, astronauts have continuously lived and worked aboard the space station, testing technologies, performing science, and developing skills needed to explore farther from Earth. Astronauts communicate with NASA’s Mission Control Center in Houston 24 hours a day through SCaN’s (Space Communications and Navigation) Near Space Network.

    Research and technology investigations taking place aboard the space station benefit people on Earth and lay the groundwork for other agency missions. As part of NASA’s Artemis campaign, the agency will send astronauts to the Moon to prepare for future human exploration of Mars; inspiring Golden Age explorers and ensuring the United States continues to lead in space exploration and discovery.

    See more information on NASA in-flight downlinks at:

    https://www.nasa.gov/stemonstation

    -end-

    Gerelle Dodson
    Headquarters, Washington
    202-358-1600
    gerelle.q.dodson@nasa.gov

    Sandra Jones
    Johnson Space Center, Houston
    281-483-511
    sandra.p.jones@nasa.gov

  • Countdown to Space Station’s Silver Jubilee with Silver Research

    Rubins stands at an angle wearing a navy-blue shirt, smiling while conducting an experiment inside a glovebox. The metallic glovebox is about the size of a washing machine, with a glass cover. Rubins’ arms are inserted through the glass cover, wearing protective blue latex gloves and white protective sleeves. A black camera is pointed towards the glovebox, and the surrounding walls have many wires, hardware, and containers attached.
    On January 7, 2021, NASA astronaut Kate Rubins serviced samples for Bacterial Adhesion and Corrosion. This investigation looked at how spaceflight affects the formation of microbial biofilms and tested a silver-based disinfectant.
    NASA

    This November marks a quarter century of continuous human presence aboard the International Space Station, which has served as a springboard for developing a low Earth economy and NASA’s next great leaps in exploration, including human missions to the Moon and Mars. To kick off the orbiting laboratory’s silver 25th anniversary countdown, here are a few silver-themed science investigations that have advanced research and space exploration.

    Antimicrobial properties

    Silver has been used for centuries to fight infection, and researchers use its unique properties to mitigate microbial growth aboard the space station. Over time, microbes form biofilms, sticky communities that can grow on surfaces and cause infection. In space, biofilms can become resistant to traditional cleaning products and could infect water treatment systems, damage equipment, and pose a health risk to astronauts. The Bacterial Adhesion and Corrosion investigation studied the bacterial genes that contribute to the formation of biofilms and tested whether a silver-based disinfectant could limit their growth.

    Another experiment focused on the production of silver nanoparticles aboard the space station. Silver nanoparticles have a bigger surface-to-volume ratio, allowing silver ions to come in contact with more microbes, making it a more effective antimicrobial tool to help protect crew from potential infection on future space missions. It also evaluated whether silver nanoparticles produced in space are more stable and uniform in size and shape, characteristics that could further enhance their effectiveness.

    Wearable tech

    Silver is a high-conductivity precious metal that is very malleable, making it a viable option for smart garments. NASA astronauts aboard the orbiting laboratory tested a wearable monitoring vest with silver-coated sensors to record heart rates, cardiac mechanics, and breathing patterns while they slept. This smart garment is lightweight and more comfortable, so it does not disturb sleep quality. The data collected provided valuable insight into improving astronauts’ sleep in space.

    Silver crystals

    In microgravity, there is no up or down, and weightlessness does not allow particles to settle, which impacts physical and chemical processes. Researchers use this unique microgravity environment to grow larger and more uniform crystals unaffected by the force of Earth’s gravity or the physical processes that would separate mixtures by density. The NanoRacks-COSMOS investigation used the environment aboard the station to grow and assess the 3D structure of silver nitrate crystals. The molecular structure of these superior silver nitrate crystals has applications in nanotechnology, such as creating silver nanowires for nanoscale electronics.

    Details

    Last Updated

    Aug 14, 2025

  • Spacewalk Pop-Up

    An astronaut in a white spacesuit comes out of a hatch on the International Space Station. We can see parts of the space station in the photo.
    NASA

    Former NASA astronaut Shane Kimbrough is photographed as he left the airlock hatch during a spacewalk on Jan. 13, 2017. Kimbrough performed nine spacewalks during his three spaceflights. He retired in July 2022.

    Astronauts conduct spacewalks to perform maintenance on the space station, install new equipment, or deploy science experiments. These activities also inform future missions like the Artemis campaign and exploring Mars; through NASA’s Extravehicular Activity and Human Surface Mobility Program, the agency develops next-generation spacesuits, human-rated rovers (pressurized and unpressurized), and tools, along with all the necessary spacewalking support systems for use in microgravity, on the lunar surface and, eventually, on other planets.

    Learn more about spacewalks at the International Space Station.

    Image credit: NASA

  • NASA Seeks Proposals for 2026 Human Exploration Rover Challenge 

    3 min read

    Preparations for Next Moonwalk Simulations Underway (and Underwater)

    NASA now is accepting proposals from student teams for a contest to design, build, and test rovers for Moon and Mars exploration through Sept. 15.

    Known as the Human Exploration Rover Challenge, student rovers should be capable of traversing a course while completing mission tasks. The challenge handbook has guidelines for remote-controlled and human-powered divisions.

    Two astronauts ride in a lunar rover in this illustration for the cover of the HERC 2026 handbook.
    The cover of the HERC 2026 handbook, which is now available online.

    “Last year, we saw a lot of success with the debut of our remote-controlled division and the addition of middle school teams,” said Vemitra Alexander, the activity lead for the challenge at NASA’s Marshall Space Flight Center in Huntsville, Alabama. “We’re looking forward to building on both our remote-controlled and human-powered divisions with new challenges for the students, including rover automation.” 

    This year’s mission mimics future Artemis missions to the lunar surface. Teams are challenged to test samples of soil, water, and air from sites along a half-mile course that includes a simulated field of asteroid debris, boulders, erosion ruts, crevasses, and an ancient streambed. Human-powered rover teams will play the role of two astronauts in a lunar terrain vehicle and must use a custom-built task tool to manually collect samples needed for testing. Remote-controlled rover teams will act as a pressurized rover, and the rover itself will contain the tools necessary to collect and test samples onboard. 

    “NASA’s Human Exploration Rover Challenge creates opportunities for students to develop the skills they need to be successful STEM professionals,” said Alexander. “This challenge will help students see themselves in the mission and give them the hands-on experience needed to advance technology and become the workforce of tomorrow.” 

    Seventy-five teams comprised of more than 500 students participated in the agency’s 31st rover challenge in 2025. Participants represented 35 colleges and universities, 38 high schools, and two middle schools, across 20 states, Puerto Rico, and 16 nations around the world.

    The 32nd annual competition will culminate with an in-person event April 9-11, 2026, at the U.S. Space & Rocket Center near NASA Marshall.

    The rover challenge is one of NASA’s Artemis Student Challenges, reflecting the goals of the Artemis campaign, which seeks to explore the Moon for scientific discovery, technology advancement, and to learn how to live and work on another world as we prepare for human missions to Mars. NASA uses such challenges to encourage students to pursue degrees and careers in the fields of science, technology, engineering, and mathematics. 

    Since its inception in 1994, more than 15,000 students have participated in the rover challenge – with many former students now working at NASA or within the aerospace industry.    

    To learn more about HERC, visit: 

    https://www.nasa.gov/roverchallenge/

    Details

    Last Updated

    Aug 15, 2025

    Editor
    Beth Ridgeway

  • Curiosity Blog, Sols 4627-4628: A Ridge Stop in the Boxworks

    2 min read

    Curiosity Blog, Sols 4627-4628: A Ridge Stop in the Boxworks

    A close-up color photo from Mars shows slightly rocky terrain covered with medium orange-brown soil that appears almost fluffy, like wet sand stirred up at the beach. At image center are about two dozen smallish, rounded stones, much lighter to almost white in color, just visible under a scattered layer of the soil. They look like marshmallows slightly submerged in hot chocolate.
    NASA’s Mars rover Curiosity acquired this close-up view of the rock target “Bococo” at the intersection of several boxwork ridges, showing bright millimeter-scale nodules likely to be calcium sulfate. Curiosity acquired this image using its Mars Hand Lens Imager (MAHLI), located on the turret at the end of the rover’s robotic arm, which uses an onboard focusing process to merge multiple images of the same target, acquired at different focus positions, to bring all (or, as many as possible) features into focus in a single image. Curiosity performed the merge on Aug. 10, 2025 — Sol 4625, or Martian day 4,625 of the Mars Science Laboratory mission — at 08:00:39 UTC.
    NASA/JPL-Caltech/MSSS

    Earth planning date: Monday Aug. 11, 2025

    Written by Lucy Lim, Planetary Scientist at NASA’s Goddard Space Flight Center

    On the Curiosity team, we’re continuing our exploration of the boxwork-forming region in Gale Crater. A successful 25-meter drive (about 82 feet) brought the rover from the “peace sign” ridge intersection to a new ridge site. Several imaging investigations were pursued in today’s plan, including Mastcam observations of a potential incipient hollow (“Laguna Miniques”), and of a number of troughs to examine how fractures transition from bedrock to regolith.

    With six wheels on the ground, Curiosity was also ready to deploy the rover arm for some contact science. APXS and MAHLI measurements were planned to explore the local bedrock at two points with a brushed (DRT) measurement (“Santa Catalina”) and a non-DRT measurement (“Puerto Teresa”). A third MAHLI observation will be co-targeted with one of the LIBS geochemical measurements on a light-toned block, “Palma Seca.” Because we’re in nominal sols for this plan, we were able to plan a second targeted LIBS activity to measure the composition of a high-relief feature on another block, “Yavari” before the drive.

    The auto-targeted LIBS (AEGIS) that executed post-drive on sol 4626 had fallen on a bedrock target and will be documented in high resolution via Mastcam imaging.

    Two long-distance imaging mosaics were planned for the ChemCam remote imager (RMI): one on a potential scarp and lens in sediments exposed on the “Mishe Mokwa” butte in the strata above the rover’s current position, and the second on an east-facing boxwork ridge with apparently exposed cross-bedding that may be related to the previously explored “Volcán Peña Blanca” ridge.

    As usual, the modern Martian environment will also be observed with camera measurements of the atmospheric opacity, a Navcam movie to watch for dust lifting, and the usual REMS and DAN passive monitoring of the temperature, humidity, and neutron flux at the rover’s location.

    The next drive is planned to bring us to a spot in a hollow where we hope to plan contact science on the erosionally recessive hollow bedrock in addition to imaging with a good view of the rock layers exposed in the wall of another prominent ridge.

    A rover sits on the hilly, orange Martian surface beneath a flat grey sky, surrounded by chunks of rock.
    NASA’s Mars rover Curiosity at the base of Mount Sharp
    NASA/JPL-Caltech/MSSS

    Details

    Last Updated

    Aug 14, 2025

    Related Terms