Category: Solar system

http://www.nasa.gov/rss/dyn/solar_system.rss

  • Webb Sees Sombrero Galaxy in Near-Infrared

    Image of a galaxy on the black background of space. The galaxy is a very oblong, brownish yellowish disk that extends from left to right at an angle (from about 10 o’clock to 5 o’clock). Mottled dark brown patches rim the edge of the disk and are particularly prominent where they cross directly in front of the galaxy. The galaxy’s center glows white and extends above and below the disk. There are different colored dots, distant galaxies, speckled among the black background of space surrounding the galaxy. At the bottom right, there is a particularly bright foreground star with Webb’s signature diffraction spikes.
    NASA’s James Webb Space Telescope recently imaged the Sombrero Galaxy with its NIRCam (Near-Infrared Camera), which shows dust from the galaxy’s outer ring blocking stellar light from stars within the galaxy. In the central region of the galaxy, the roughly 2,000 globular clusters, or collections of hundreds of thousands of old stars held together by gravity, glow in the near-infrared. The Sombrero Galaxy is around 30 million light-years from Earth in the constellation Virgo. From Earth, we see this galaxy nearly “edge-on,” or from the side.
    NASA, ESA, CSA, STScI

    After capturing an image of the iconic Sombrero galaxy at mid-infrared wavelengths in late 2024, NASA’s James Webb Space Telescope has now followed up with an observation in the near-infrared. In the newest image, released on June 3, 2025, the Sombrero galaxy’s tightly packed group of stars at the galaxy’s center is illuminated while the dust in the outer edges of the disk blocks some stellar light. Studying galaxies like the Sombrero at different wavelengths, including the near-infrared and mid-infrared with Webb, as well as the visible with NASA’s Hubble Space Telescope, helps astronomers understand how this complex system of stars, dust, and gas formed and evolved, along with the interplay of that material.

    Learn more about the Sombrero galaxy and what this new view can tell us.

    Image credit:  NASA, ESA, CSA, STScI

  • NASA Mars Orbiter Captures Volcano Peeking Above Morning Cloud Tops

    A softly focused, orbital view of the Arsia Mons volcano on Mars. The dark, rounded peak of the volcano emerges from a vast, bright white expanse of orographic clouds covering the planet's surface. Above the clouds, a thin, hazy green band marks the Martian atmosphere at the planet's limb, with the blackness of space filling the top of the frame.
    Arsia Mons, an ancient Martian volcano, was captured before dawn on May 2, 2025, by NASA’s 2001 Mars Odyssey orbiter while the spacecraft was studying the Red Planet’s atmosphere, which appears here as a greenish haze.
    NASA/JPL-Caltech/ASU

    The 2001 Odyssey spacecraft captured a first-of-its-kind look at Arsia Mons, which dwarfs Earth’s tallest volcanoes.

    A new panorama from NASA’s 2001 Mars Odyssey orbiter shows one of the Red Planet’s biggest volcanoes, Arsia Mons, poking through a canopy of clouds just before dawn. Arsia Mons and two other volcanoes form what is known as the Tharsis Montes, or Tharsis Mountains, which are often surrounded by water ice clouds (as opposed to Mars’ equally common carbon dioxide clouds), especially in the early morning. This panorama marks the first time one of the volcanoes has been imaged on the planet’s horizon, offering the same perspective of Mars that astronauts have of the Earth when they peer down from the International Space Station.

    Launched in 2001, Odyssey is the longest-running mission orbiting another planet, and this new panorama represents the kind of science the orbiter began pursuing in 2023, when it captured the first of its now four high-altitude images of the Martian horizon. To get them, the spacecraft rotates 90 degrees while in orbit so that its camera, built to study the Martian surface, can snap the image.

    Arsia Mons is the southernmost of the three volcanoes that make up Tharsis Montes, shown in the center of this cropped topographic map of Mars. Olympus Mons, the solar system’s largest volcano, is at upper left. The western end of Valles Marineris begins cutting its wide swath across the planet at lower right.
    NASA/JPL-Caltech

    The angle allows scientists to see dust and water ice cloud layers, while the series of images enables them to observe changes over the course of seasons.

    “We’re seeing some really significant seasonal differences in these horizon images,” said planetary scientist Michael D. Smith of NASA’s Goddard Space Flight Center in Greenbelt, Maryland. “It’s giving us new clues to how Mars’ atmosphere evolves over time.”

    Understanding Mars’ clouds is particularly important for understanding the planet’s weather and how phenomena like dust storms occur. That information, in turn, can benefit future missions, including entry, descent and landing operations.

    Volcanic Giants

    While these images focus on the upper atmosphere, the Odyssey team has tried to include interesting surface features in them, as well. In Odyssey’s latest horizon image, captured on May 2, Arsia Mons stands 12 miles (20 kilometers) high, roughly twice as tall as Earth’s largest volcano, Mauna Loa, which rises 6 miles (9 kilometers) above the seafloor.

    The southernmost of the Tharsis volcanoes, Arsia Mons is the cloudiest of the three. The clouds form when air expands as it blows up the sides of the mountain and then rapidly cools. They are especially thick when Mars is farthest from the Sun, a period called aphelion. The band of clouds that forms across the planet’s equator at this time of year is called the aphelion cloud belt, and it’s on proud display in Odyssey’s new panorama.

    “We picked Arsia Mons hoping we would see the summit poke above the early morning clouds. And it didn’t disappoint,” said Jonathon Hill of Arizona State University in Tempe, operations lead for Odyssey’s camera, called the Thermal Emission Imaging System, or THEMIS.

    The THEMIS camera can view Mars in both visible and infrared light. The latter allows scientists to identify areas of the subsurface that contain water ice, which could be used by the first astronauts to land on Mars. The camera can also image Mars’ tiny moons, Phobos and Deimos, allowing scientists to analyze their surface composition.

    More About Odyssey

    NASA’s Jet Propulsion Laboratory, a division of Caltech in Pasadena, California, manages the Mars Odyssey Project for the agency’s Science Mission Directorate in Washington as part of NASA’s Mars Exploration Program portfolio. Lockheed Martin Space in Denver built the spacecraft and collaborates with JPL on mission operations. THEMIS was built and is operated by Arizona State University in Tempe.

    For more about Odyssey:

    https://science.nasa.gov/mission/odyssey/

    News Media Contacts

    Andrew Good
    Jet Propulsion Laboratory, Pasadena, Calif.
    818-393-2433
    andrew.c.good@jpl.nasa.gov

    Karen Fox / Molly Wasser
    NASA Headquarters, Washington
    202-358-1600
    karen.c.fox@nasa.gov / molly.l.wasser@nasa.gov

    2025-077

    Details

    Last Updated

    Jun 06, 2025

  • NASA’s Ready-to-Use Dataset Details Land Motion Across North America

    A triptych of geological hazards: The left panel shows a road severely cracked by an earthquake. The center shows an aerial view of a massive landslide into the ocean. The right shows a lava lake inside a volcanic crater.
    A new online portal by NASA and the Alaska Satellite Facility maps satellite radar meas-urements across North America, enabling users to track land movement since 2016 caused by earthquakes, landslides, volcanoes, and other phenomena.
    USGS

    An online tool maps measurements and enables non-experts to understand earthquakes, subsidence, landslides, and other types of land motion.

    NASA is collaborating with the Alaska Satellite Facility in Fairbanks to create a powerful web-based tool that will show the movement of land across North America down to less than an inch. The online portal and its underlying dataset unlock a trove of satellite radar measurements that can help anyone identify where and by how much the land beneath their feet may be moving — whether from earthquakes, volcanoes, landslides, or the extraction of underground natural resources such as groundwater.

    Spearheaded by NASA’s Observational Products for End-Users from Remote Sensing Analysis (OPERA) project at the agency’s Jet Propulsion Laboratory in Southern California, the effort equips users with information that would otherwise take years of training to produce. The project builds on measurements from spaceborne synthetic aperture radars, or SARs, to generate high-resolution data on how Earth’s surface is moving.

    Formally called the North America Surface Displacement Product Suite, the new dataset comes ready to use with measurements dating to 2016, and the portal allows users to view those measurements at a local, state, and regional scales in a few seconds. For someone not using the dataset or website, it could take days or longer to do a similar analysis.

    “You can zoom in to your country, your state, your city block, and look at how the land there is moving over time,” said David Bekaert, the OPERA project manager and a JPL radar scientist. “You can see that by a simple mouse click.”

    The portal currently includes measurements for millions of pixels across the U.S. Southwest, northern Mexico, and the New York metropolitan region, each representing a 200-foot-by-200-foot (60-meter-by-60-meter) area on the ground. By the end of 2025, OPERA will add data to cover the rest of the United States, Central America, and Canada within 120 miles (200 kilometers) of the U.S. border. When a user clicks on a pixel, the system pulls measurements from hundreds of files to create a graph visualizing the land surface’s cumulative movement over time.

    “The OPERA project automated the end-to-end SAR data processing system such that users and decision-makers can focus on discovering where the land surface may be moving in their areas of interest,” said Gerald Bawden, program scientist responsible for OPERA at NASA Headquarters in Washington. “This will provide a significant advancement in identifying and understanding potential threats to the end users, while providing cost and time savings for agencies.” 

    For example, water-management bureaus and state geological surveys will be able to directly use the OPERA products without needing to make big investments in data storage, software engineering expertise, and computing muscle.

    How It Works

    To create the displacement product, the OPERA team continuously draws data from the ESA (European Space Agency) Sentinel-1 radar satellites, the first of which launched in 2014. Data from NISAR, the NASA-ISRO (Indian Space Research Organisation) Synthetic Aperture Radar mission, will be added to the mix after that spacecraft launches later this year.

    Satellite-borne radars work by emitting microwave pulses at Earth’s surface. The signals scatter when they hit land and water surfaces, buildings, and other objects. Raw data consists of the strength and time delay of the signals that echo back to the sensor. 

    To understand how land in a given area is moving, OPERA algorithms automate steps in an otherwise painstaking process. Without OPERA, a researcher would first download hundreds or thousands of data files, each representing a pass of the radar over the point of interest, then make sure the data aligned geographically over time and had precise coordinates.

    Then they would use a computationally intensive technique called radar interferometry to gauge how much the land moved, if at all, and in which direction — towards the satellite, which would indicate the land rose, or away from the satellite, which would mean it sank.

    “The OPERA project has helped bring that capability to the masses, making it more accessible to state and federal agencies, and also users wondering, ‘What’s going on around my house?’” said Franz Meyer, chief scientist of the Alaska Satellite Facility, a part of the University of Alaska Fairbanks Geophysical Institute.

    Monitoring Groundwater

    Sinking land is a top priority to the Arizona Department of Water Resources. From the 1950s through the 1980s, it was the main form of ground movement officials saw, as groundwater pumping increased alongside growth in the state’s population and agricultural industry. In 1980, the state enacted the Groundwater Management Act, which reduced its reliance on groundwater in highly populated areas and included requirements to monitor its use.

    The department began to measure this sinking, called subsidence, with radar data from various satellites in the early 2000s, using a combination of SAR, GPS-based monitoring, and traditional surveying to inform groundwater-management decisions.

    Now, the OPERA dataset and portal will help the agency share subsidence information with officials and community members, said Brian Conway, the department’s principal hydrogeologist and supervisor of its geophysics unit. They won’t replace the SAR analysis he performs, but they will offer points of comparison for his calculations. Because the dataset and portal will cover the entire state, they also could identify areas not yet known to be subsiding.

    “It’s a great tool to say, ‘Let’s look at those areas more intensely with our own SAR processing,’” Conway said.

    The displacement product is part of a series of data products OPERA has released since 2023. The project began in 2020 with a multidisciplinary team of scientists at JPL working to address satellite data needs across different federal agencies. Through the Satellite Needs Working Group, those agencies submitted their requests, and the OPERA team worked to improve access to information to aid a range of efforts such as disaster response, deforestation tracking, and wildfire monitoring.

    News Media Contacts

    Andrew Wang / Jane J. Lee
    Jet Propulsion Laboratory, Pasadena, Calif.
    626-379-6874 / 818-354-0307
    andrew.wang@jpl.nasa.gov / jane.j.lee@jpl.nasa.gov

    2025-076

  • NASA Provides Hardware for Space Station DNA Repair Experiment 

    The Vented Fly Box (VFB) holds and safely transports vials containing flies and fly food.
    The Vented Fly Box holds and safely transports vials containing flies and fly food. It includes environmental sensors that monitor temperature and relative humidity.
    NASA/Dominic Hart

    When it comes to helping NASA scientists better understand the effects of space travel on the human body, fruit flies are the heavyweights of experiments in weightlessness. Because humans and fruit flies share a lot of similar genetic code, they squeeze a lot of scientific value into a conveniently small, light package. 

    Through a new Space Act Agreement between NASA and Axiom Space, the Vented Fly Box will enable fruit flies (Drosophila melanogaster) to launch aboard a SpaceX Dragon spacecraft from NASA’s Kennedy Space Center in Florida. These tiny crew members will join the Axiom Mission 4 crew for scientific investigations on the International Space Station. The goal is to advance research into how spaceflight impacts DNA repair, a key factor in astronaut health on long-term space missions. 

    For decades, NASA has iterated and improved these specialized habitats to safely house generations of fruit flies for their trips to and from space. As the go-to organism for many of its studies, NASA gained unique knowledge and carefully finessed the steps astronauts take to perform the most efficient and rewarding life science experiments in space.

    The study is supported by NASA’s Ames Research Center in California’s Silicon Valley and Axiom Space.

  • Hubble Captures Starry Spectacle

    2 min read

    Hubble Captures Starry Spectacle

    A spiral galaxy seen directly on. It glows strongly at its center and has a short horizontal bar. Two spiral arms extend from this bar, but they are broad and irregularly shaped. The galaxy’s spiral arms hold tiny blue dots — young stars — and glowing pink clouds — star-forming nebulae. The arms break apart into many strands at the edge of the disk. Beyond the galaxy is a dark background.
    This NASA/ESA Hubble Space Telescope image features the barred spiral galaxy NGC 685.
    ESA/Hubble & NASA, J. Lee, F. Belfiore

    A galaxy ablaze with young stars is the subject of this NASA/ESA Hubble Space Telescope image. Named NGC 685, this galaxy is situated about 64 million light-years away in the constellation Eridanus (the River). NGC 685 is a barred spiral because its feathery spiral arms sprout from the ends of a bar of stars at the galaxy’s center. The Milky Way is also a barred spiral, but our galaxy is a little less than twice the size of NGC 685.

    Astronomers used Hubble to study NGC 685 for two observing programs, both focused on star formation. It’s no surprise that NGC 685 was part of these programs: numerous patches of young, blue stars highlight the galaxy’s spiral arms. Also visible are pink gas clouds, called H II (pronounced ‘H-two’) regions, that glow for a short time when particularly hot and massive stars are born. An especially eye-catching H II region peeks out at the bottom edge of the image. Despite the dozens of star-forming regions evident in this image, NGC 685 converts an amount of gas equivalent to less than half the mass of the Sun into stars each year.

    The Hubble data collected for the two observing programs will allow astronomers to catalogue 50,000 H II regions and 100,000 star clusters in nearby galaxies. By combining Hubble’s sensitive visible and ultraviolet observations with infrared data from the NASA/ESA/CSA James Webb Space Telescope and radio data from the Atacama Large Millimeter/submillimeter Array, researchers can peer into the depths of dusty stellar nurseries and illuminate the stars forming there.

    Text Credit: ESA/Hubble

    Media Contact:

    Claire Andreoli (claire.andreoli@nasa.gov)
    NASA’s Goddard Space Flight CenterGreenbelt, MD

  • Auburn Team Wins 2025 NASA Moon and Mars Design Competition

    4 min read

    Preparations for Next Moonwalk Simulations Underway (and Underwater)

    The three members of Auburn University's 2025 RASC-AL team hold their awards for first place overall and best in theme.
    Auburn University’s project, “Dynamic Ecosystems for Mars ECLSS Testing, Evaluation, and Reliability (DEMETER),” won top prize in NASA’s 2025 Revolutionary Aerospace Systems – Academic Linkage (RASC-AL) Competition Forum.
    National Institute of Aerospace

    A team from Auburn University took top honors in NASA’s 2025 Revolutionary Aerospace Systems – Academic Linkage (RASC-AL) Competition Forum, where undergraduate and graduate teams competed to develop new concepts for operating on the Moon, Mars and beyond. 

    Auburn’s project, “Dynamic Ecosystems for Mars Environmental Control and Life Support Systems (ECLSS) Testing, Evaluation, and Reliability (DEMETER)” advised by Dr. Davide Guzzetti, took home top prize out of 14 Finalist Teams from academic institutions across the nation. Virginia Polytechnic Institute and State University took second place overall for their concept, “Adaptive Device for Assistance and Maintenance (ADAM),” advised by Dr. Kevin Shinpaugh. The University of Maryland took third place overall with their project, “Servicing Crane Outfitted Rover for Payloads, Inspection, Operations, N’stuff (SCORPION),” advised by Dr. David Akin, Nich Bolatto, and Charlie Hanner. 

    The first and second place overall winning teams will present their work at the 2025 AIAA Accelerating Space Commerce, Exploration, and New Discovery (ASCEND) Conference in Las Vegas, Nevada in July. 

    Virginia Polytechnic Institute and State University team members with their second place and
    Virginia Polytechnic Institute and State University took second place overall in NASA’s 2025 Revolutionary Aerospace Systems – Academic Linkage (RASC-AL) Competition Forum for their concept, “Adaptive Device for Assistance and Maintenance (ADAM).”
    National Institute of Aerospace

    The RASC-AL Competition, which took place from June 2-4, 2025, in Cocoa Beach, Florida, is a unique initiative designed to bridge the gap between academia and the aerospace industry, empowering undergraduate and graduate students to apply their classroom knowledge to real-world challenges in space exploration. This year’s themes included “Sustained Lunar Evolution – An Inspirational Moment,” “Advanced Science Missions and Technology Demonstrators for Human-Mars Precursor Campaign,” and “Small Lunar Servicing and Maintenance Robot.”  

    “The RASC-AL Competition cultivates students who bring bold, imaginative thinking to the kinds of complex challenges we tackle at NASA,” said Dan Mazanek, RASC-AL program sponsor and senior space systems engineer at NASA’s Langley Research Center in Hampton, Virginia. “These teams push the boundaries of what’s possible in space system design and offer new insights. These insights help build critical engineering capabilities, preparing the next generation of aerospace leaders to step confidently into the future of space exploration.” 

    As NASA continues to push the boundaries of space exploration, the RASC-AL Competition stands as an opportunity for aspiring aerospace professionals to design real-world solutions to complex problems facing the Agency. By engaging with the next generation of innovators, NASA can collaborate with the academic community to crowd-source new solutions for the challenges of tomorrow. 

    Additional 2025 Forum Awards include: 

    Best in Theme: Sustained Lunar Evolution: An Inspirational Moment 

    • Virginia Polytechnic Institute and State University 
    • Project Title: Project Aeneas 
    • Advisor: Dr. Kevin Shinpaugh 

      Best in Theme: Advanced Science Missions and Technology Demonstrators for Human-Mars Precursor Campaign 

      • Auburn University 
      • Project Title: Dynamic Ecosystems for Mars ECLSS Testing, Evaluation, and Reliability (DEMETER) 
      • Advisor: Dr. Davide Guzzetti 

      Best in Theme: Small Lunar Servicing and Maintenance Robot 

      • Virginia Polytechnic Institute and State University 
      • Project Title: Adaptive Device for Assistance and Maintenance (ADAM) 
      • Advisor: Dr. Kevin Shinpaugh 

      Best Prototype: South Dakota State University 

      • Project Title: Next-gen Operations and Versatile Assistant (NOVA) 
      • Advisor: Dr. Todd Letcher, Allea Klauenberg, Liam Murray, Alex Schaar, Nick Sieler, Dylan Stephens, Carter Waggoner 

          RASC-AL is open to undergraduate and graduate students studying disciplines related to human exploration, including aerospace, bio-medical, electrical, and mechanical engineering, and life, physical, and computer sciences. RASC-AL projects allow students to incorporate their coursework into space exploration objectives in a team environment and help bridge strategic knowledge gaps associated with NASA’s vision. Students have the opportunity to interact with NASA officials and industry experts and develop relationships that could lead to participation in other NASA student research programs.   

          RASC-AL is sponsored by the Strategies and Architectures Office within the Exploration Systems Development Mission Directorate at NASA Headquarters, and by the Space Mission Analysis Branch within the Systems Analysis and Concepts Directorate at NASA Langley. It is administered by the National Institute of Aerospace.   

          For more information about the RASC-AL competition, including complete theme and submission guidelines, visit: http://rascal.nianet.org

          National Institute of Aerospace

          About the Author

          Joe Atkinson

          Public Affairs Officer, NASA Langley Research Center

        • NASA Earth Scientist Elected to National Academy of Sciences

          3 min read

          Preparations for Next Moonwalk Simulations Underway (and Underwater)

          Earth scientist Compton J. Tucker has been elected to the National Academy of Sciences for his work creating innovative tools to track the planet’s changing vegetation from space. It’s research that has spanned nearly 50 years at NASA’s Goddard Space Flight Center in Greenbelt, Maryland, where he is a visiting scientist after retiring in March. 

          Tucker’s research began with identifying wavelengths of light that are absorbed or reflected as plants undergo photosynthesis, and has evolved into calculating the health and productivity of vegetation over time with satellites. 

          “I’m honored and surprised,” Tucker said of his election. “There were opportunities at the Goddard Space Flight Center that have enabled this work that couldn’t be found elsewhere. There were people who built satellites, who understood satellite data, and had the computer code to process it. All the work I’ve done has been part of a team, with other people contributing in different ways. Working at NASA is a team effort of science and discovery that’s fun and intellectually rewarding.” 

          A headshot of a man smiling in front of a screen showing colorful data about Earth's oceans. he has grey hair, glasses and a moustache.
          Earth scientist Compton Tucker, who has studied remote sensing of vegetation at NASA Goddard for 50 years, has been elected to the National Academy of Sciences.
          Courtesy Compton Tucker

          Tucker earned his master’s and doctoral degrees from Colorado State University, where he worked on a National Science Foundation-funded project analyzing spectrometer data of grassland ecosystems. In 1975, he came to NASA Goddard as a postdoctoral fellow and used what he learned in his graduate work to modify the imager on National Oceanic and Atmospheric Administration (NOAA) meteorological satellites and modify Landsat’s thematic mapper instrument. 

          He became a civil servant at the agency in 1977, and continued work with radiometers to study vegetation – first with handheld devices, then with NOAA’s Advanced Very High Resolution Radiometer satellite instruments.  He has also used data from Landsat satellites, Moderate Resolution Imaging Spectroradiometer instruments, and commercial satellites. His scientific papers have been cited 100,000 times, and one of his recent studies mapped 10 billion individual trees across Africa’s drylands to inventory carbon storage at the tree level.

          “The impact of Compton Tucker’s work over the last half-century at Goddard is incredible,” said Dalia Kirschbaum, director of the Earth Sciences Division at NASA Goddard. “Among his many achievements, he essentially developed the technique of using satellites to study photosynthesis from plants, which people have used to monitor droughts, forecast crop shortages, defeat the desert locust, and even predict disease outbreaks. This is a well-deserved honor.”

          A collage of three images, all grainy film photos that have been digitized. To the left is a vertical image of a man in a green field, with a scientific instrument hanging from a strap around his neck, a cylindrical part of it in his hand. To the top right is an image of three men crouched in a different field, doing work on a small circular plot of dirt. To the bottom right is an image of two men and a woman in a flourescently lit room, surrounded by reels of tape that hold scientific data.
          Goddard scientist Compton Tucker’s work using remote sensing instruments to study vegetation involved field work in Iceland in 1976, left, graduate student research at Colorado State University in the early 1970s, top right, and analyzing satellite data stored on tape reels at Goddard.
          Courtesy Compton Tucker

          The National Academy of Sciences was proposed by Abraham Lincoln and established by Congress in 1863, charged with advising the United States on science and technology. Each year, up to 120 new members are elected “in recognition of their distinguished and continuing achievements in original research,” according to the organization.

          In addition his role as a visiting scientist at Goddard, Tucker is also an adjunct professor at the University of Maryland and a consulting scholar at the University of Pennsylvania’s University Museum. He was awarded the National Air and Space Collins Trophy for Current Achievement in 1993 and the Vega Medal by the Swedish Society of Anthropology and Geography in 2014. He is a fellow of the American Association for the Advancement of Science and the American Geophysical Union, and won the Senior Executive Service Presidential Rank Award for Meritorious Service in 2017, among other honors. 

          By Kate Ramsayer

          NASA’s Goddard Space Flight Center, Greenbelt, Md.

          Details

          Last Updated

          Jun 05, 2025

          Editor
          Erica McNamee
          Contact
          Kate D. Ramsayer
          Location
          NASA Goddard Space Flight Center

        • ICESat-2 Applications Team Hosts Satellite Bathymetry Workshop

          8 min read

          ICESat-2 Applications Team Hosts Satellite Bathymetry Workshop

          Introduction

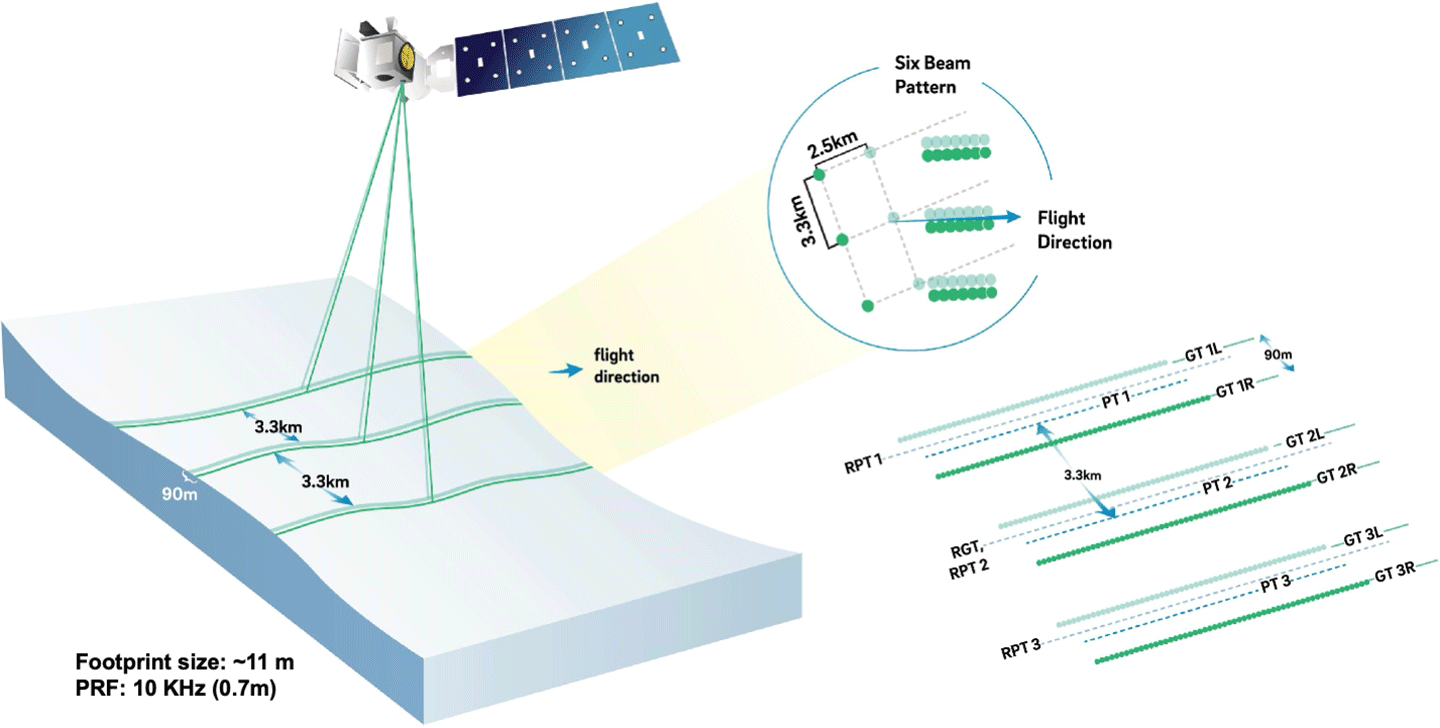
          On September 15, 2018, the NASA Ice, Cloud, and land Elevation Satellite-2 (ICESat-2) mission launched from Vandenberg Air Force Base and began its journey to provide spatially dense and fine-precision global measurements of Earth’s surface elevation. Now in Phase E of NASA’s project life cycle (where the mission is carried out, data is collected and analyzed, and the spacecraft is maintained) of the mission and with almost six years of data collection, the focus shifts to looking ahead to new applications and synergies that may be developed using data from ICESat-2’s one instrument: the Advanced Topographic Laster Altimetry System (ATLAS) – see Figure 1.

          ICESat-2 figure 1
          Figure 1. The ATLAS instrument onboard the ICESat-2 platform obtains data using green, photon-counting lidar that is split into six beams.
          Figure credit: ICESat-2 mission team

          Satellite-derived bathymetry (SDB) is the process of mapping the seafloor using satellite imagery. The system uses light penetration and reflection in the water to make measurements and estimate variations in ocean floor depths. SDB provides several advantages over other bathymetry techniques (e.g., cost-effectiveness, global coverage, and faster data acquisition). On the other hand, SDB can be limited by water clarity, spatial resolution of the remote sensing measurement, and accuracy, depending on the method and satellite platform/instrument. These limitations notwithstanding, SDB can be used in a wide variety of applications (e.g., coastal zone management, navigation and safety, marine habitat monitoring, and disaster response). ICESat-2 has become a major contributor to SDB, with over 2000 journal article references to this topic to date. Now is the time to think about the state-of-the-art and additional capabilities of SDB for the future.

          To help stimulate such thinking, the NASA ICESat-2 applications team hosted a one-day workshop on March 17, 2025. The workshop focused on the principles and methods for SDB. Held in conjunction with the annual US-Hydro meeting on March 17–20, 2025 at the Wilmington Convention Center in Wilmington, NC, the meeting was hosted by the Hydrographic Society of America. During the workshop the applications team brought together SDB end-users, algorithm developers, operators, and decision makers to discuss the current state and future needs of satellite bathymetry for the community. The objective of this workshop was to provide a space to foster collaboration and conceptualization of SDB applications not yet exploited and to allow for networking to foster synergies and collaborations between different sectors.

          Meeting Overview

          The workshop provided an opportunity for members from government, academia, and private sectors to share their SDB research, applications, and data fusion activities to support decision making and policy support across a wide range of activities. Presenters highlighted SDB principles, methods, and tools for SDB, an introduction of the new ICESat-2 bathymetric data product (ATL24), which is now available through the National Snow and Ice Data Center (NSIDC). During the workshop, the ICESat-2 team delivered a live demonstration of a web service for science data processing. Toward the end of the day, the applications team opened an opportunity for attendees to gather and discuss various topics related to SDB. This portion of the meeting was also available to online participation via Webex Webinars, which broadened the discussion.

          Meeting Goal

          The workshop offered a set of plenary presentations and discussions. During the plenary talks, participants provided an overview of Earth observation and SDB principles, existing methods and tools, an introduction to the newest ICESat-2 bathymetry product ATL24, a demonstration of the use of the webservice SlideRule Earth, and opportunities for open discission, asking questions and developing collaborations.

          Meeting and Summary Format

          The agenda of the SDB workshop was intended to bring together SDB end-users, including ICESat-2 application developers, satellite operators, and decision makers from both government and non-governmental entities to discuss the current state and future needs of the community. The workshop consisted of six sessions that covered various topics of SDB. This report is organized according to the topical focus of the plenary presentations with a brief narrative summary of each presentation included. The discussions that followed were not recorded and are not included in the report. The last section of this report consists of conclusions and future steps. The online meeting agenda includes links to slide decks for many of the presentations.

          Welcoming Remarks

          Aimee Neeley [NASA’s Goddard Space Flight Center (GSFC)/Science Systems and Applications Inc. (SSAI)—ICESat-2 Mission Applications Lead] organized the workshop and served as the host for the event. She opened the day with a brief overview of workshop goals, logistics, and the agenda.

          Overview of Principles of SDB
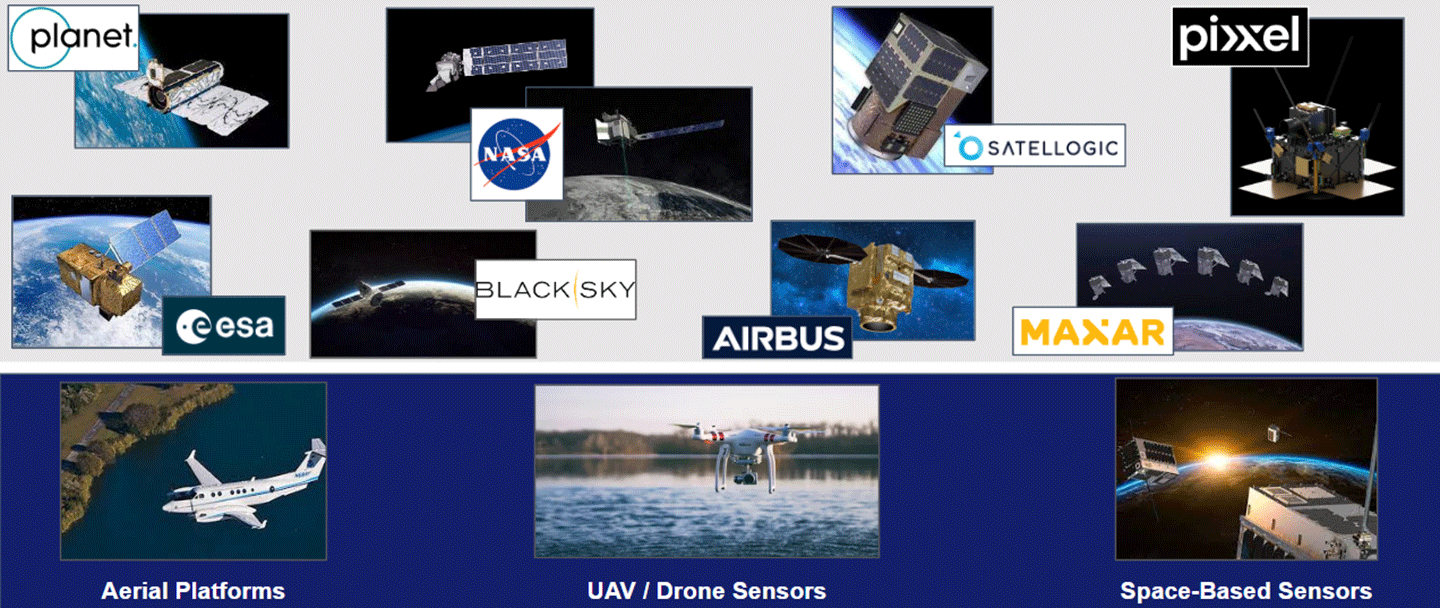
          Ross Smith [TCartaSenior Geospatial Scientist] provided an overview of the principles of space-based bathymetry, including the concepts, capabilities, limitations, and methods. Smith began by relaying the history of satellite-derived bathymetry, which began with a collaboration between NASA and Jacques Cousteau in 1975, in which Cousteau used Landsat 1 data, as well as in situ data, to calculate bathymetry to a depth of 22 m (72 ft) in the Bahamas. Smith then described the five broad methodologies and their basic concepts for deriving bathymetry from remote sensing: radar altimetry, bottom reflectance, wave kinematics, laser altimetry, and space-based photogrammetry – see Figure 2. He then introduced the broad methodologies, most commonly used satellite sensors, the capabilities and limitations of each sensor, and the role of ICESat-2 in satellite bathymetry.

          ICESat-2 figure 2
          Figure 2. Satellite platforms commonly used for SDB.
          Figure credit: Ross Smith

          Review of SDB Methods and Tools

          In this grouping of plenary presentations, representatives from different organizations presented their methods and tools for creating satellite bathymetry products.

          Gretchen Imahori [National Oceanic and Atmospheric Administration’s (NOAA) National Geodetic Survey, Remote Sensing Division] presented the NOAA SatBathy (beta v2.2.3) Tool Update. During this presentation, Imahori provided an overview of the NOAA SatBathy desktop tool, example imagery, updates to the latest version, and the implementation plan for ATL24. The next session included more details about ATL24.

          Minsu Kim [United States Geological Survey (USGS), Earth Resource and Observation Center (EROS)/ Kellogg, Brown & Root (KBR)—Chief Scientist] presented the talk Satellite Derived Bathymetry (SDB) Using OLI/MSI Based-On Physics-Based Algorithm. He provided an overview of an SDB method based on atmospheric and oceanic optical properties. Kim also shared examples of imagery from the SDB product – see Figure 3.

          Figure 3. Three-dimensional renderings of the ocean south of Key West, FL created by adding SDB Digital Elevation Model (physics-based) to a Landsat Operational Land Imager (OLI) scene [top] and a Sentinel-2 Multispectral Imager (MSI) scene [bottom].
          Figure credit: Minsu Kim

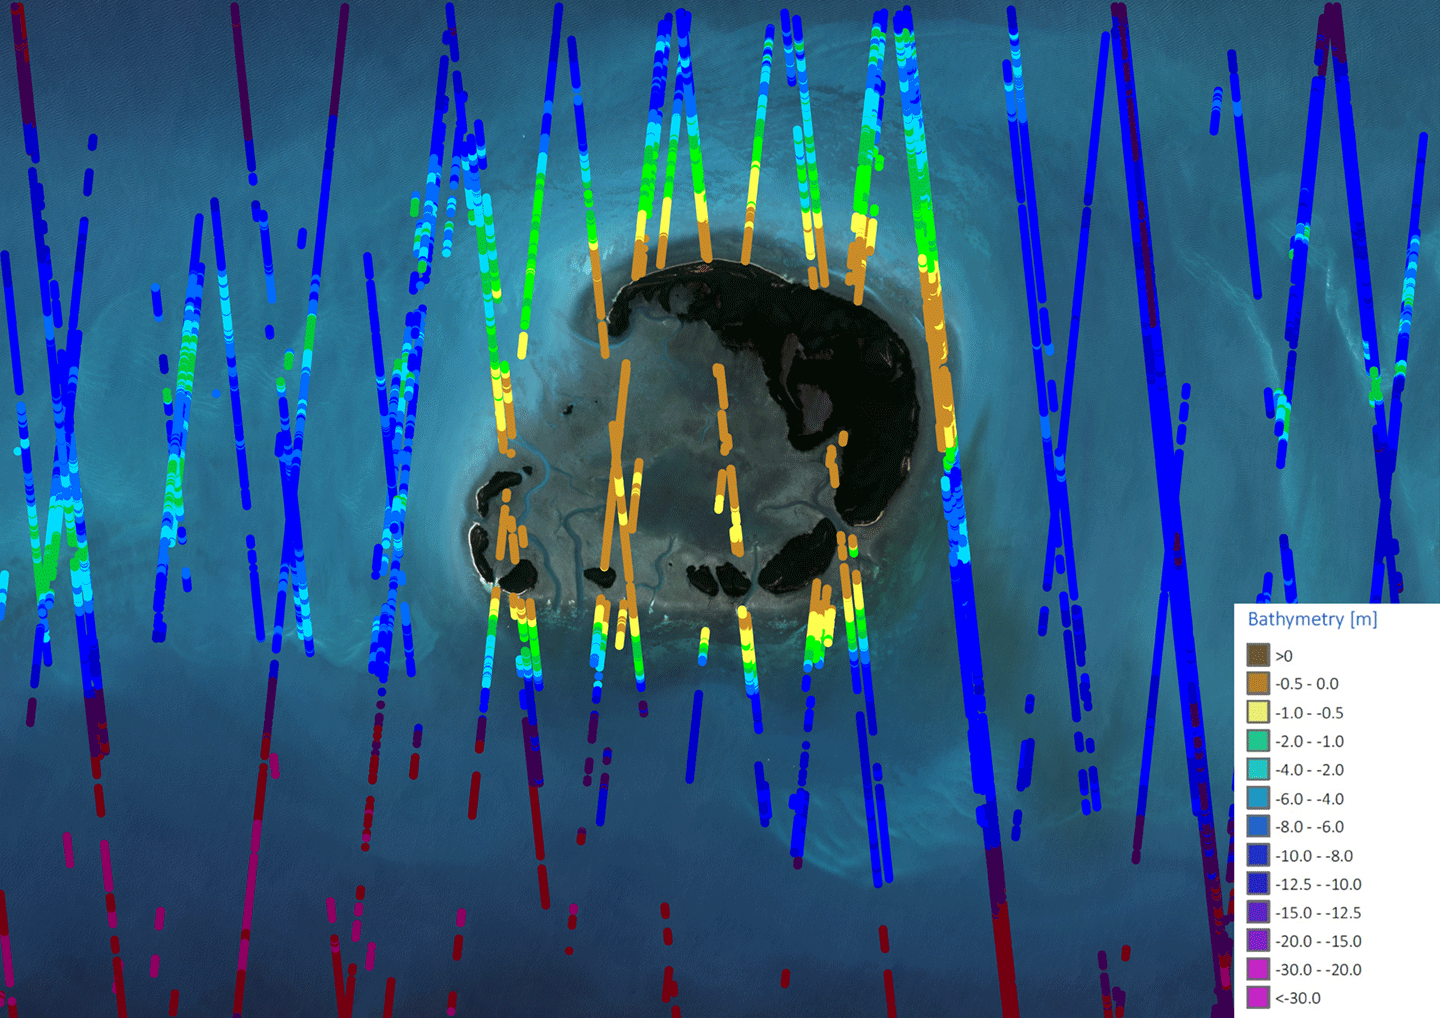
          Edward Albada [Earth Observation and Environmental Services GmbH (EOMAP)—Principal] presented the talk Satellite Lidar Bathymetry and EoappTM SLB-Online. The company EOMAP provides various services, including SDB, habitat mapping. For context, Albada provided an overview of EoappTM SDB-Online, a cloud-based software for creating SDB. (EoappTM SDB-online is one of several Eoapp apps and is based on the ICESat-2 photon data product (ATL03). Albada also provided example use cases from Eoapp – see Figure 4.

          ICESat-2 figure 4
          Figure 4.A display of the Marquesas Keys (part of the Florida Keys) using satellite lidar bathymetry data from the Eoapp SLB-Online tool from EOMAP.
          Figure credit: Edward Albada

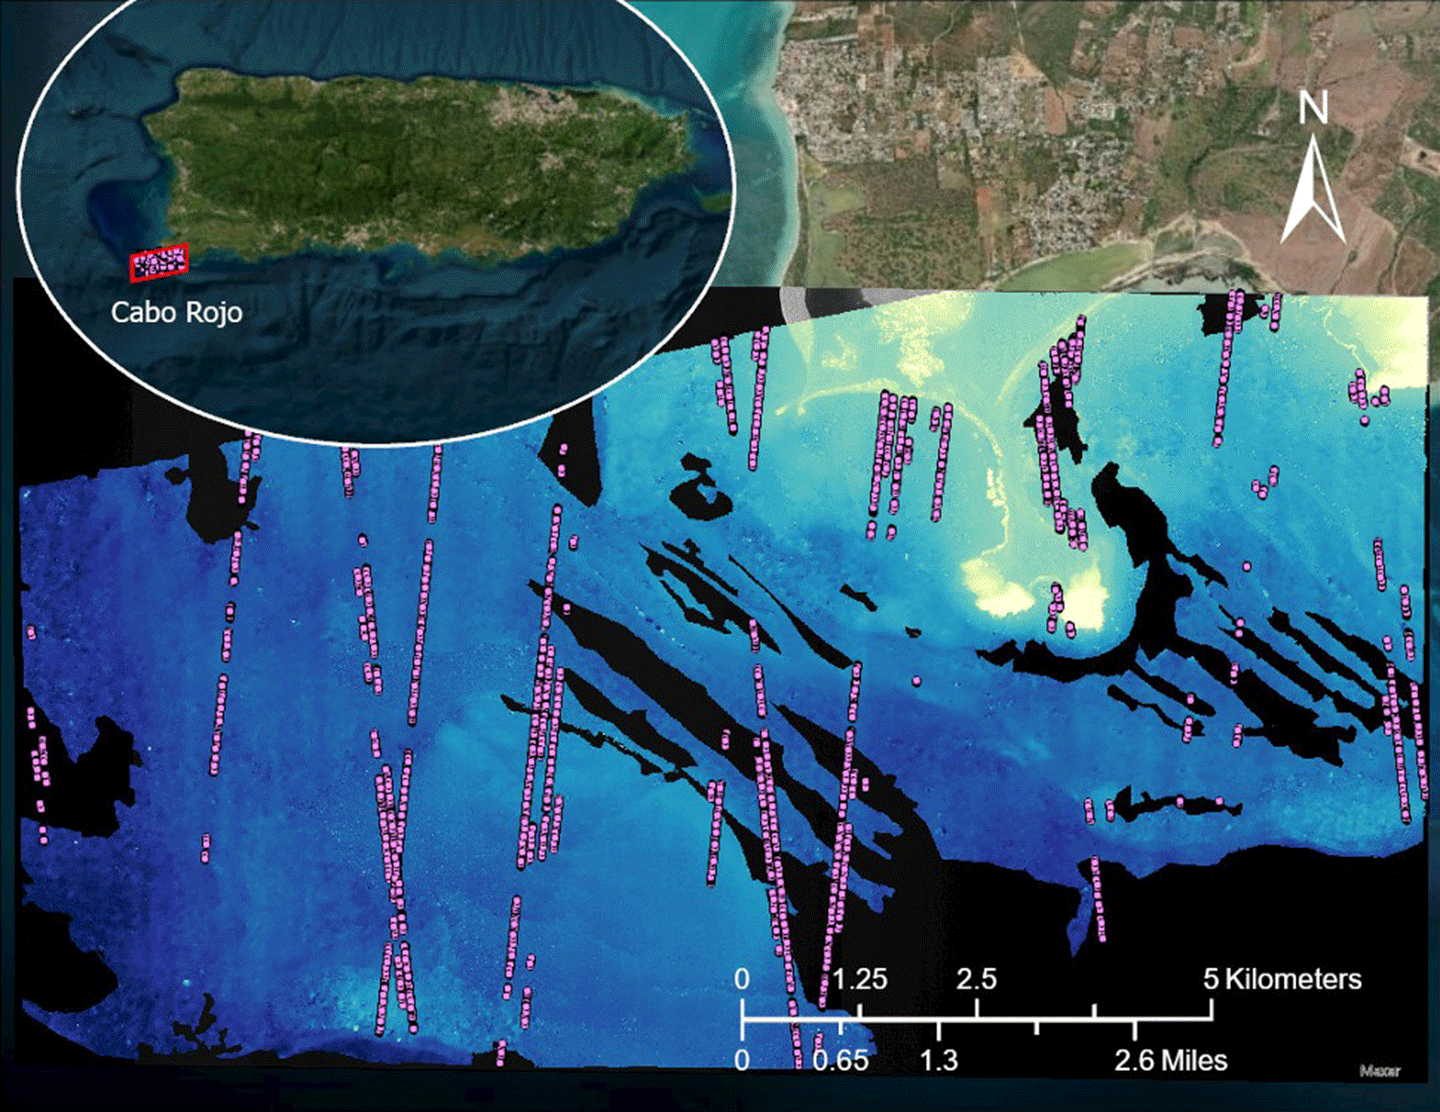
          Monica Palaseanu-Lovejoy [USGS GMEG—Research Geographer] presented on a Satellite Triangulated Sea Depth (SaTSeaD): Bathymetry Module for NASA Ames Stereo Pipeline (ASP). She provided an overview of the shallow water bathymetry SaTSeaD module, a photogrammetric method for mapping bathymetry. Palaseanu-Lovejoy presented error statistics and validation procedures. She also shared case study results from Key West, FL; Cocos Lagoon, Guam; and Cabo Rojo, Puerto Rico – see Figure 5.

          ICESat-2 figure 5
          Figure 5. Photogrammetric bathymetry map of Cabo Roja, Puerto Rico displayed using the SatSeaD Satellite Triangulated Sea Depth (SaTSeaD): Bathymetry Module for NASA Ames Stereo Pipeline (ASP) module.
          Figure credit: Monica Palaseanu-Lovejoy

          Ross Smith presented a presentation on TCarta’s Trident Tools: Approachable SDB|Familiar Environment. During this presentation, Smith provided an overview of the Trident Tools Geoprocessing Toolbox deployed in Esri’s ArcPro. Smith described several use cases for the toolbox in Abu Dhabi, United Arab Emirates; Lucayan Archipelago, Bahamas; and the Red Sea.

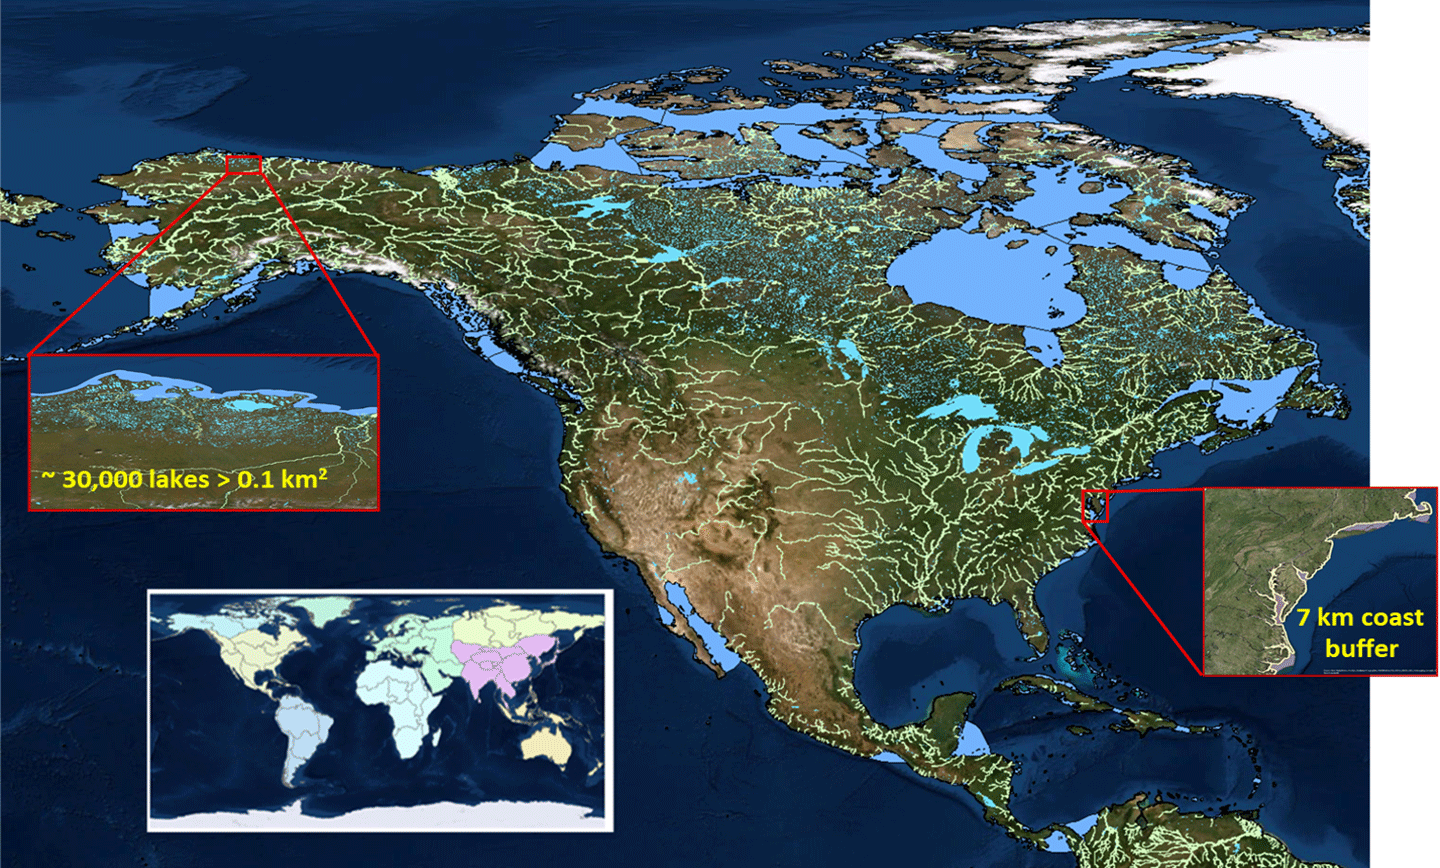
          Michael Jasinski [GSFC—Research Hydrologist] presented on The ICESat-2 Inland Water Along Track Algorithm (ATL13). He provided an overview of the ICESat-2 data product ATL13 an inland water product that is distributed by NSIDC. Jasinski described the functionality of the ATL13 semi-empirical algorithm and proceeded to provide examples of its applications with lakes and shallow coastal waters – see Figure 6.

          ICESat-2 figure 6
          Figure 6. A graphic of the network of lakes and rivers in North America that are measured by ICESat-2.
          Figure credit: Michael Jasinski

          ATL24 Data Product Update

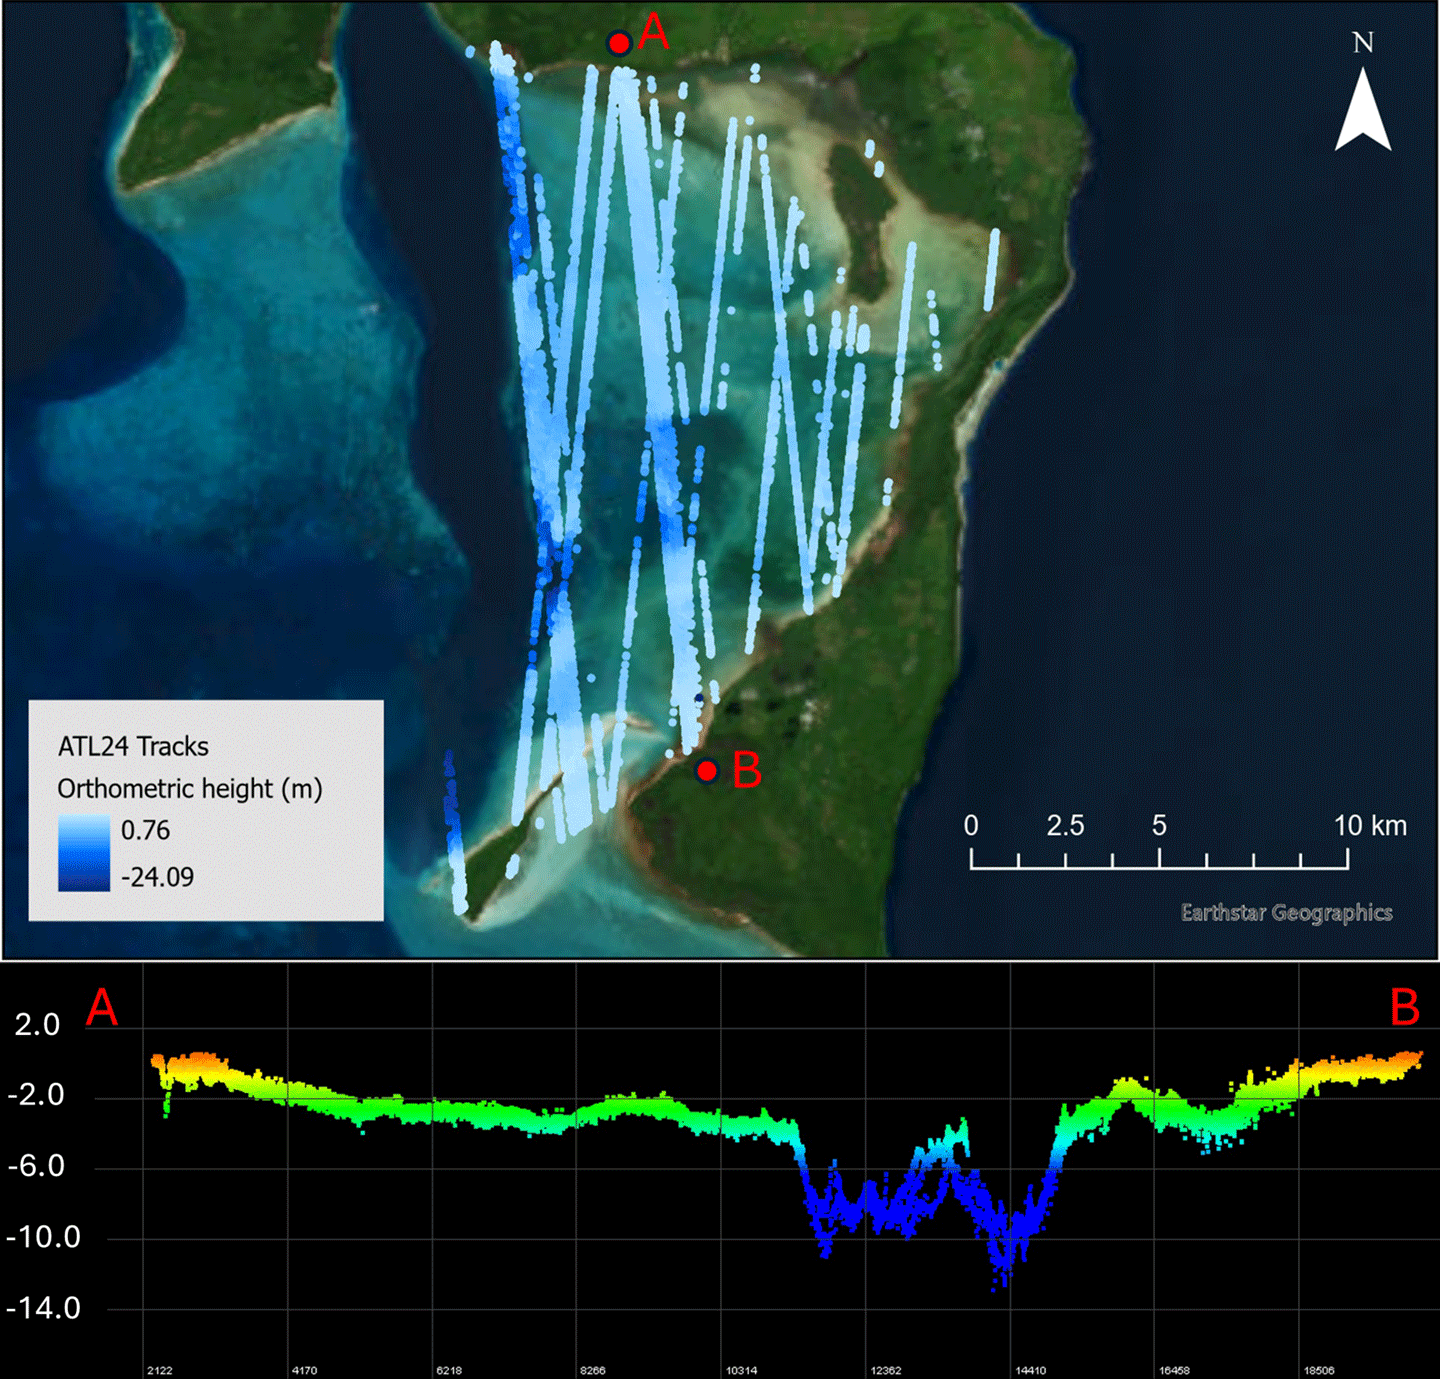
          Christopher Parrish [Oregon State University, School of Civil and Construction Engineering—Professor] presented on ATL24: A New Global ICESat-2 Bathymetric Data Product. Parrish provided an overview of the recently released ATL24 product and described the ATL24 workflow, uncertainty analysis, and applications in shallow coastal waters. Parrish included a case study where ATL24 data were used for bathymetric mapping of Kiriwina Island, Papua New Guinea – see Figure 7.

          ICESat-2 figure 7
          Figure 7. ATL24 data observed for Kiriwina Island, Papua New Guinea.
          Figure credit: Christopher Parrish

          SlideRule Demo

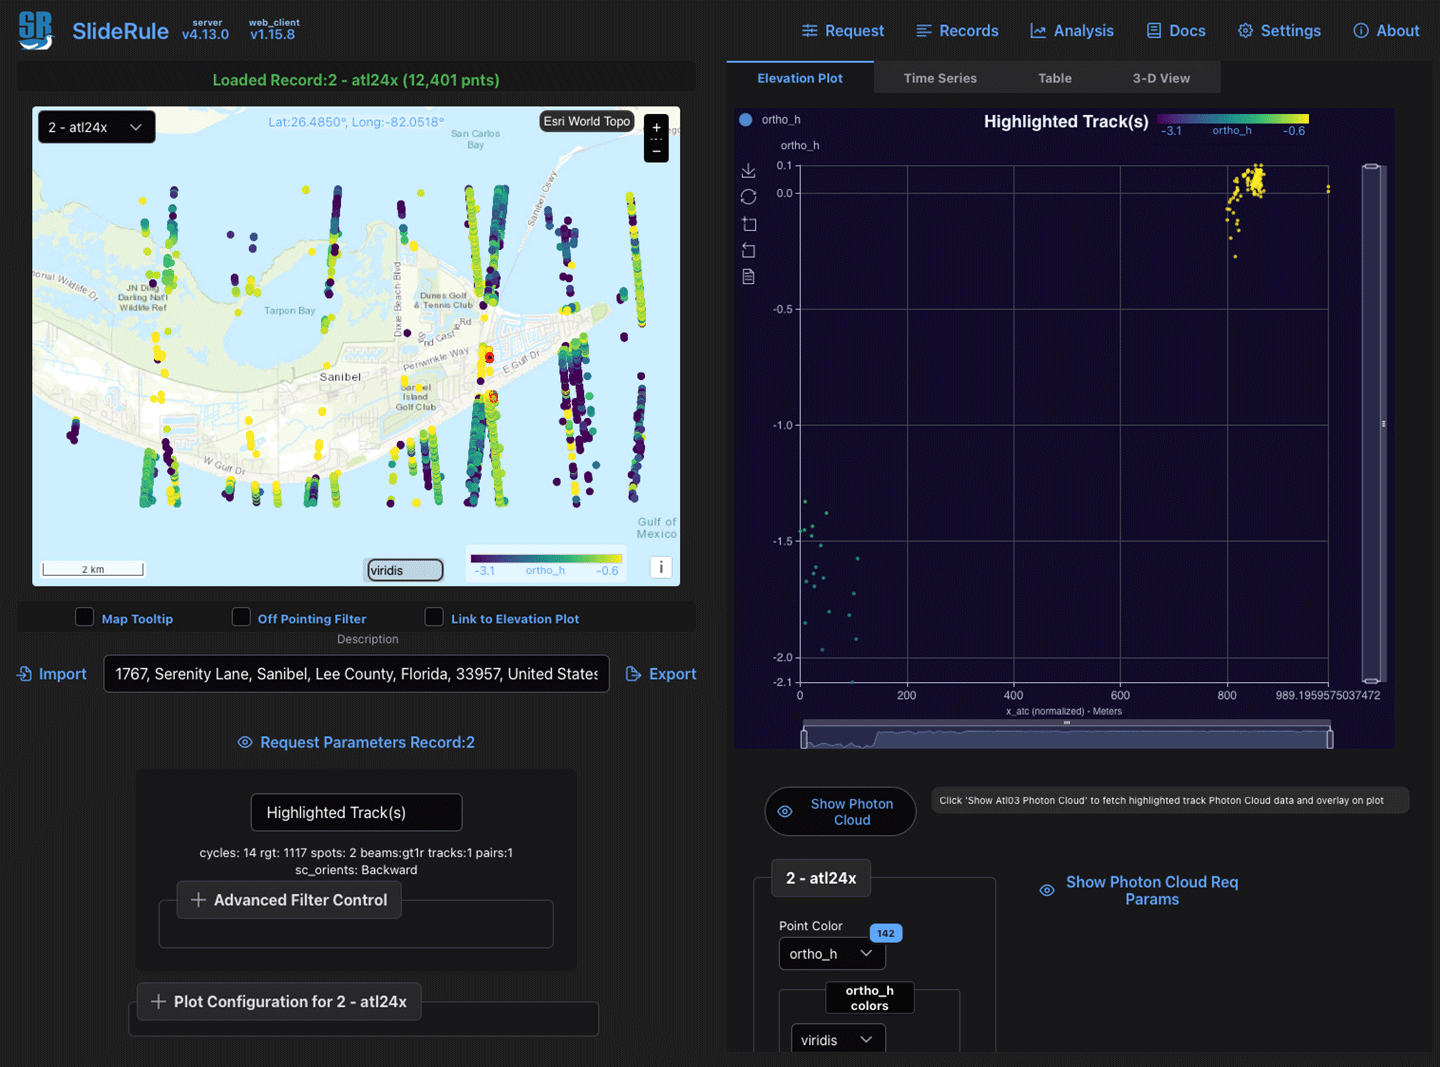
          J. P. Swinski [GSFC—Computer Engineer] presented SlideRule Earth: Enabling Rapid, Scalable, Open Science. Swinski explained that SlideRule Earth is a public web service that provides access to on-demand processing and visualization of ICESat-2 data. SlideRule can be used to process a subset of ICESat-2 data products, including ATL24 – see Figure 8.

          ICESat-2 figure 8
          Figure 8. ATL24 data observed for Sanibel, FL as viewed on the SlideRule Earth public web client.
          Figure credit: SlideRule Earth

          SDB Accuracy

          Kim Lowell [University of New Hampshire—Data Analytics Research Scientist and Affiliate Professor] presented on SDB Accuracy Assessment and Improvement Talking Points. During this presentation, Lowell provided examples of accuracy assessments and uncertainty through the comparison of ground measurement of coastal bathymetry to those modeled from satellite data.

          Conclusion

          The ICESat-2 Satellite Bathymetry workshop fostered discussion and collaboration around the topic of SDB methods. The plenary speakers presented the state-of-the-art methods used by different sectors and organizations, including government and private entities. With the release of ATL24, ICESat-2’s new bathymetry product, it was prudent to have a conversation about new and upcoming capabilities for all methods and measurements of satellite bathymetry. Both in-person and online participants were provided with the opportunity to learn, ask questions, and discuss potential applications in their own research. The ICESat-2 applications team hopes to host more events to ensure the growth of this field to maximize the capabilities of ICESat-2 and other Earth Observing systems.

          Details

          Last Updated

          Jun 05, 2025

          Related Terms

        • NASA’s IXPE Obtains First X-ray Polarization Measurement of Magnetar Outburst

          4 min read

          Preparations for Next Moonwalk Simulations Underway (and Underwater)

          What happens when the universe’s most magnetic object shines with the power of 1,000 Suns in a matter of seconds? Thanks to NASA’s IXPE (Imaging X-ray Polarimetry Explorer), a mission in collaboration with ASI (Italian Space Agency), scientists are one step closer to understanding this extreme event. 

          Magnetars are a type of young neutron star — a stellar remnant formed when a massive star reaches the end of its life and collapses in on itself, leaving behind a dense core roughly the mass of the Sun, but squashed down to the size of a city. Neutron stars display some of the most extreme physics in the observable universe and present unique opportunities to study conditions that would otherwise be impossible to replicate in a laboratory on Earth.

          Illustrated magnetar flyby sequence showing magnetic field lines. A magnetar is a type of isolated neutron star, the crushed, city-size remains of a star many times more massive than our Sun. Their magnetic fields can be 10 trillion times stronger than a refrigerator magnet’s and up to a thousand times stronger than a typical neutron star’s. This represents an enormous storehouse of energy that astronomers suspect powers magnetar outbursts.
          NASAs Goddard Space Flight Center/Chris Smith (USRA)

          The magnetar 1E 1841-045, located in the remnants of a supernova (SNR Kes 73) nearly 28,000 light-years from Earth, was observed to be in a state of outburst by NASA’s SwiftFermi, and NICER telescopes on August 21, 2024. 

          A few times a year, the IXPE team approves requests to interrupt the telescope’s scheduled observations to instead focus on unique and unexpected celestial events. When magnetar 1E 1841-045 entered this brighter, active state, scientists decided to redirect IXPE to obtain the first-ever polarization measurements of a flaring magnetar.

          Magnetars have magnetic fields several thousand times stronger than most neutron stars and host the strongest magnetic fields of any known object in the universe. Disturbances to their extreme magnetic fields can cause a magnetar to release up to a thousand times more X-ray energy than it normally would for several weeks. This enhanced state is called an outburst, but the mechanisms behind them are still not well understood. 

          Through IXPE’s X-ray polarization measurements, scientists may be able to get closer to uncovering the mysteries of these events. Polarization carries information about the orientation and alignment of the emitted X-ray light waves; the higher the degree of polarization, the more the X-ray waves are traveling in sync, akin to a tightly choreographed dance performance. Examining the polarization characteristics of magnetars reveals clues about the energetic processes producing the observed photons as well as the direction and geometry of the magnetar magnetic fields. 

          The IXPE results, aided by observations from NASA’s NuSTAR and NICER telescopes, show that the X-ray emissions from 1E 1841-045 become more polarized at higher energy levels while still maintaining the same direction of propagation. A significant contribution to this high polarization degree comes from the hard X-ray tail of 1E 1841-045, an energetic magnetospheric component dominating the highest photon energies observed by IXPE. “Hard X-rays” refer to X-rays with shorter wavelengths and higher energies than “soft X-rays.” Although prevalent in magnetars, the mechanics driving the production of these high energy X-ray photons are still largely unknown. Several theories have been proposed to explain this emission, but now the high polarization associated with these hard X-rays provide further clues into their origin.

          This illustration depicts IXPE’s measurements of X-ray polarization emitting from magnetar 1E 1841-045 located within the Supernova Remnant Kes 73. At the time of observation, the magnetar was in a state of outburst and emitting the luminosity equivalent to 1000 suns. By studying the X-ray polarization of magnetars experiencing an outburst scientists may be able to get closer to uncovering the mysteries of these events.
          Michela Rigoselli/Italian National Institute of Astrophysics

          The results are presented in two papers published in The Astrophysical Journal Letters, one led by Rachael Stewart, a PhD student at George Washington University, and the other by Michela Rigoselli of the Italian National Institute of Astrophysics.  The papers represent the collective effort of large international teams across several countries.

          “This unique observation will help advance the existing models aiming to explain magnetar hard X-ray emission by requiring them to account for this very high level of synchronization we see among these hard X-ray photons,” said Stewart. “This really showcases the power of polarization measurements in constraining physics in the extreme environments of magnetars.”

          Rigoselli, lead author of the companion paper, added, “It will be interesting to observe 1E 1841-045 once it has returned to its quiescent, baseline state to follow the evolution of its polarimetric properties.”

          IXPE is a space observatory built to discover the secrets of some of the most extreme objects in the universe. Launched in December 2021 from NASA’s Kennedy Space Center on a Falcon 9 rocket, the IXPE mission is part of NASA’s Small Explorer series. 

          IXPE, which continues to provide unprecedented data enabling groundbreaking discoveries about celestial objects across the universe, is a joint NASA and Italian Space Agency mission with partners and science collaborators in 12 countries. IXPE is led by NASA’s Marshall Space Flight Center in Huntsville, Alabama. BAE Systems, headquartered in Falls Church, Virginia, manages spacecraft operations together with the University of Colorado’s Laboratory for Atmospheric and Space Physics in Boulder.

          Learn more about IXPE’s ongoing mission here:

          https://www.nasa.gov/ixpe

          Media Contact

          Elizabeth Landau
          NASA Headquarters
          elizabeth.r.landau@nasa.gov
          202-358-0845

          Lane Figueroa
          Marshall Space Flight Center, Huntsville, Ala.
          lane.e.figueroa@nasa.gov
          256.544.0034 

          About the Author

          Beth Ridgeway

          Beth Ridgeway

        • NASA’s PACE Mission Reveals a Year of Terrestrial Data on Plant Health

          4 min read

          Preparations for Next Moonwalk Simulations Underway (and Underwater)

          A lot can change in a year for Earth’s forests and vegetation, as springtime and rainy seasons can bring new growth, while cooling temperatures and dry weather can bring a dieback of those green colors. And now, a novel type of NASA visualization illustrates those changes in a full complement of colors as seen from space.

          Researchers have now gathered a complete year of PACE data to tell a story about the health of land vegetation by detecting slight variations in leaf colors. Previous missions allowed scientists to observe broad changes in chlorophyll, the pigment that gives plants their green color and also allows them to perform photosynthesis. But PACE now allows scientists to see three different pigments in vegetation: chlorophyll, anthocyanins, and carotenoids. The combination of these three pigments helps scientists pinpoint even more information about plant health. Credit: NASA’s Goddard Space Flight Center

          NASA’s Plankton, Aerosol, Cloud, ocean Ecosystem (PACE) satellite is designed to view Earth’s microscopic ocean plants in a new lens, but researchers have proved its hyperspectral use over land, as well.

          Previous missions measured broad changes in chlorophyll, the pigment that gives plants their green color and also allows them to perform photosynthesis. Now, for the first time, PACE measurements have allowed NASA scientists and visualizers to show a complete year of global vegetation data using three pigments: chlorophyll, anthocyanins, and carotenoids. That multicolor imagery tells a clearer story about the health of land vegetation by detecting the smallest of variations in leaf colors.

          “Earth is amazing. It’s humbling, being able to see life pulsing in colors across the whole globe,” said Morgaine McKibben, PACE applications lead at NASA’s Goddard Space Flight Center in Greenbelt, Maryland. “It’s like the overview effect that astronauts describe when they look down at Earth, except we are looking through our technology and data.”

          A visualization of North America where the land is overlayed with colors representing data. The east side of the land swirls with blues, greens, and pinks, while the west side is primarily gray.
          Anthocyanins, carotenoids, and chlorophyll data light up North America, highlighting vegetation and its health. For the full visualization, visit: https://svs.gsfc.nasa.gov/5548/
          Credit: NASA’s Scientific Visualization Studio

          Anthocyanins are the red pigments in leaves, while carotenoids are the yellow pigments – both of which we see when autumn changes the colors of trees. Plants use these pigments to protect themselves from fluctuations in the weather, adapting to the environment through chemical changes in their leaves. For example, leaves can turn more yellow when they have too much sunlight but not enough of the other necessities, like water and nutrients. If they didn’t adjust their color, it would damage the mechanisms they have to perform photosynthesis.

          In the visualization, the data is highlighted in bright colors: magenta represents anthocyanins, green represents chlorophyll, and cyan represents carotenoids. The brighter the colors are, the more leaves there are in that area. The movement of these colors across the land areas show the seasonal changes over time.

          In areas like the evergreen forests of the Pacific Northwest, plants undergo less seasonal change. The data highlights this, showing comparatively steadier colors as the year progresses.

          The combination of these three pigments helps scientists pinpoint even more information about plant health.

          “Shifts in these pigments, as detected by PACE, give novel information that may better describe vegetation growth, or when vegetation changes from flourishing to stressed,” said McKibben. “It’s just one of many ways the mission will drive increased understanding of our home planet and enable innovative, practical solutions that serve society.”

          The Ocean Color Instrument on PACE collects hyperspectral data, which means it observes the planet in 100 different wavelengths of visible and near infrared light. It is the only instrument – in space or elsewhere – that provides hyperspectral coverage around the globe every one to two days. The PACE mission builds on the legacy of earlier missions, such as Landsat, which gathers higher resolution data but observes a fraction of those wavelengths.

          In a paper recently published in Remote Sensing Letters, scientists introduced the mission’s first terrestrial data products.

          “This PACE data provides a new view of Earth that will improve our understanding of ecosystem dynamics and function,” said Fred Huemmrich, research professor at the University of Maryland, Baltimore County, member of the PACE science and applications team, and first author of the paper. “With the PACE data, it’s like we’re looking at a whole new world of color. It allows us to describe pigment characteristics at the leaf level that we weren’t able to do before.”

          As scientists continue to work with these new data, available on the PACE website, they’ll be able to incorporate it into future science applications, which may include forest monitoring or early detection of drought effects.

          By Erica McNamee

          NASA’s Goddard Space Flight Center, Greenbelt, Md.

          Details

          Last Updated

          Jun 05, 2025

          Editor
          Kate D. Ramsayer
          Contact
          Kate D. Ramsayer

        • NASA Astronaut Jeanette Epps Retires

          A black woman in a red shirt poses in the International Space Station cupola with the Earth pictured behind her.
          Expedition 71 Flight Engineer and NASA astronaut Jeanette Epps poses for a portrait inside the seven-window cupola, the International Space Station’s “window to the world,” while orbiting 259 miles above Greece.
          NASA

          NASA astronaut Jeanette Epps retired May 30, after nearly 16 years of service with the agency. Epps most recently served as a mission specialist during NASA’s SpaceX Crew-8 mission, spending 235 days in space, including 232 days aboard the International Space Station, working on hundreds of scientific experiments during Expedition 71/72.

          “I have had the distinct pleasure of following Jeanette’s journey here at NASA from the very beginning,” said Steve Koerner, acting director of NASA’s Johnson Space Center in Houston. “Jeanette’s tenacity and dedication to mission excellence is admirable. Her contributions to the advancement of human space exploration will continue to benefit humanity and inspire the next generation of explorers for several years to come.”

          Epps was selected in 2009 as a member of NASA’s 20th astronaut class. In addition to her spaceflight, she served as a lead capsule communicator, or capcom, in NASA’s Mission Control Center and as a crew support astronaut for two space station expeditions.

          “Ever since Jeanette joined the astronaut corps, she has met every challenge with resilience and determination,” said Joe Acaba, NASA’s chief astronaut. “We will miss her greatly, but I know she’s going to continue to do great things.”

          Epps also participated in NEEMO (NASA Extreme Environment Mission Operation) off the coast of Florida, conducted geologic studies in Hawaii, and served as a representative to the Generic Joint Operations Panel, which addressed crew efficiency aboard the space station.

          The Syracuse, New York, native holds a bachelor’s degree in physics from Le Moyne College in Syracuse. She also earned master’s and doctorate degrees in aerospace engineering from the University of Maryland in College Park. During her graduate studies, she became a NASA Fellow, authoring several journal and conference articles about her research. Epps also received a provisional patent and a U.S. patent prior to her role at NASA.

          Learn more about International Space Station research and operations at: 

          https://www.nasa.gov/station

          -end-

          Chelsey Ballarte

          Johnson Space Center, Houston

          281-483-5111

          chelsey.n.ballarte@nasa.gov

        • Jack Kaye Retires After a Storied Career at NASA

          Jack Kaye [NASA HQ—Associate Director for Research, Earth Science Division (ESD)] has decided to retire on April 30, 2025, following 42 years of service to NASA – see Photo 1. Most recently, Kaye served as associate director for research of the Earth Science Division (ESD) within NASA’s Science Mission Directorate (SMD). In this position, he was responsible for the research and data analysis programs for Earth System Science that addressed the broad spectrum of scientific disciplines from the stratopause to the poles to the oceans.

          EC Supplemental image
          Photo 1. Jack Kaye [NASA HQ—Associate Director for Research, Earth Science Division (ESD)] retired from NASA on April 30, 2025, after a 42-year career.
          Photo credit: Public Domain

          A New York native, Kaye’s interest in space was piqued as a child watching early NASA manned space launches on television. He would often write to NASA to get pictures of the astronauts. In high school, he started an after school astronomy club. Despite a youthful interest in Earth science, as he explained in a 2014 “Maniac Talk” at NASA’s Goddard Space Flight Center, Kaye pursued a slightly different academic path. He obtained a Bachelor’s of Science in chemistry from Adelphi University in 1976 and a Ph.D. in theoretical physical chemistry at the California Institute of Technology in 1982. For his graduate studies, he focused on the quantum mechanics of chemical reactions with an aim toward being able to understand and calculate the activity.

          Following graduate school, Kaye secured a post-doctoral position at the U.S. Naval Research Laboratory, where he studied the chemistry of Earth’s atmosphere with a focus on stratospheric ozone. It was while working in a group of meteorologists at NASA’s Goddard Space Flight Center that Kaye returned to his roots and refocused his scientific energy on studying Earth.

          “NASA had a mandate to study stratospheric ozone,” Kaye said in an interview in 2009. “I got involved in looking at satellite observations and especially trying to interpret satellite observations of stratospheric composition and building models to simulate things, to look both ways, to use the models and use the data.”

          Kaye has held numerous science and leadership positions at NASA. He began his career at GSFC as a researcher for the Stratospheric General Circulation and Chemistry Modeling Project (SGCCP) from 1983–1990 working on stratospheric modeling.  In this role, he also worked on an Earth Observing System Interdisciplinary proposal.  His first role at NASA HQ was managing  as program scientist for the Atmospheric Chemistry Modeling and Analysis Program (ACMAP), as well as numerous other missions. In this role, he was a project scientist for the Atmospheric Laboratory for Applications and Science (ATLAS) series of Shuttle missions. While managing ATLAS, Kaye oversaw the science carried out by a dozen instruments from several different countries. He also managed several other Earth Science missions during this time. See the link to Kaye’s “Maniac Talk.”

          Kaye entered the Senior Executive Service in 1999, where he continued to contribute to the agency by managing NASA’s Earth Science Research Program. In addition, Kaye has held temporary acting positions as deputy director of ESD and deputy chief scientist for Earth Science within SMD. Throughout his career he has focused on helping early-career investigators secure their first awards to establish their career path—see Photo 2.

          Jack Kaye photo 3
          Photo 2. Throughout his career, Jack Kaye has been an advocate for young scientists, helping them get established in their careers. Here, Kaye speaks with the Climate Change Research Initiative cohort at the Mary W. Jackson NASA Headquarters building in Washington, DC on August 7, 2024. The Earth Science Division’s Early Career Research Program’s Climate Change Research Initiative is a year-long STEM engagement and experiential learning opportunity for educators and students from high school to graduate level.
          Photo Credit: NASA/Joel Kowsky

          On numerous occasions, Kaye spoke to different groups emphasizing the agency’s unique role in both developing and utilizing cutting-edge technology, especially remote observations of Earth with different satellite platforms – see Photo 3. With the launch of five new NASA Earth science campaigns in 2020, Kaye stated, “These innovative investigations tackle difficult scientific questions that require detailed, targeted field observations combined with data collected by our fleet of Earth-observing satellites.”

          Jack Kaye photo 3
          Photo 3. Jack Kaye hands out eclipse posters and other outreach materials to attendees at Eclipse Fest 2024.

          Kaye has also represented NASA in interagency and international activities and has been an active participant in the U.S. Global Change Research Program (USGCRP), where he has served for many years as NASA principal of the Subcommittee on Global Change Research. He served as NASA’s representative to the Subcommittee on Ocean Science and Technology and chaired the World Meteorological Organization Expert Team on Satellite Systems. Kaye was named an honorary member of the Asia Oceania Geoscience Society in 2015. He previously completed a six-year term as a member of the Steering Committee for the Global Climate Observing System and currently serves an ex officio member of the National Research Council’s Roundtable on Science and Technology for Sustainability and the Chemical Sciences Roundtable, as well as a member of the Roundtable on Global Science Diplomacy.

          NASA has honored Kaye with numerous awards, including the Distinguished Service Medal in 2022 and the Meritorious Executive in the Senior Executive Service in 2004, 2010, and 2021. In 2024 he was awarded the NASA-USGS Pecora Individual Award honoring excellence in Earth Observation. He was named a Fellow by the American Meteorological Society in 2010 and by the American Association of the Advancement of Science (AAAS) in 2014. Kaye was elected to serve as an office of the Atmospheric and Hydrospheric Science section of the AAAS (2015–2018). AGU has recognized him on two occasions with a Citation for Excellence in Refereeing.

          Over the course of his career Kaye has published more than 50 papers, contributed to numerous reports, books, and encyclopedias, and edited the book Isotope Effects in Gas-Phase Chemistry for the American Chemical Society. In addition, he has attended the Leadership for Democratic Society program at the Federal Executive Institute and the Harvard Senior Managers in Government Program at the John F. Kennedy School of Government at Harvard University.

          “The vantage point of space provides a way to look at the Earth globally, with the ability to observe Earth’s interacting components of air, water, land and ice, and both naturally occurring and human-induced processes,” Kaye said in a November 2024 article published by Penn State University. “It lets us look at variability on a broad range of spatial and temporal scales and given the decades of accomplishments, has allowed us to characterize and document Earth system variability on time scales from minutes to decades.”

        • In Memoriam: Dr. Stanley Sander

          In Memoriam Banner

          3 min read

          In Memoriam: Dr. Stanley Sander

          In Memoriam – Sander

          Dr. Stanley Sander dedicated more than five decades to atmospheric science at the Jet Propulsion Laboratory, beginning his JPL career as a graduate research assistant in 1971. A leading figure in atmospheric chemistry, Stan made foundational contributions to our understanding of stratospheric ozone depletion, tropospheric air pollution, and climate science related to greenhouse gases.

          His pioneering work in laboratory measurements—particularly of reaction rate constants, spectroscopy, and photochemistry—was designed to forge consensus among often disparate measurements.  His steadfast application of the scientific method was essential for furthering scientific research, as well as for providing sound advice for use in air quality management and environmental policies. His expertise extended beyond Earth’s atmosphere, with studies of methane chemistry on Mars, halogens on Venus, and hydrocarbons in Titan’s atmosphere.

          Stan’s scientific output was vast. He authored over 180 peer-reviewed publications, beginning with his 1976 paper on sulfur dioxide oxidation. His work spans major aspects of atmospheric chemistry—from chlorine, bromine, and nitrogen oxides to sulfur compounds and peroxides. The rate constants, cross-sections, and photochemical data produced in his lab form the cornerstone of atmospheric modeling crucial to the scientific foundation of the Montreal Protocol on Substances that Deplete the Ozone Layer.  He played a central role in the widely used JPL Chemical Kinetics and Photochemical Data for Use in Atmospheric Studies reports, which have collectively garnered over 10,000 citations. His spectroscopic research, which included development of novel spectrometers and polarimeters, resulted in insightful data from sites at JPL, the Table Mountain Facility as well as the California Laboratory for Remote sensing (CLARS). These activities have contributed significantly to the calibration and validation of satellite missions like TES, OCO, OMI, and SAGE, helped advance remote sensing technologies, and informed local air quality metrics.

          Stan was not only a brilliant scientist but a deeply respected mentor and leader. He guided 40 postdocs at JPL, 14 graduate students at Caltech, and 14 undergraduate researchers. At JPL, he held key leadership roles including Supervisor of the Laboratory Studies and Modeling Group, Chief Engineer and Acting Chief Technologist in the Science Division, and Senior Research Scientist.  Those of us lucky enough to be fostered by Stan in this capacity will always remember his kindness first approach and steadfast resolve in the face of challenges.

          Stan’s contributions were recognized with numerous honors, including two NASA Exceptional Achievement Medals, a NASA Exceptional Service Medal, and elected as a fellow for both the American Geophysical Union (2021) and the American Association for the Advancement of Science (2024). Although the announcement of his AAAS Fellowship came posthumously, he was informed of this honor before his passing.

          Stan was a rare combination of scientific brilliance, humility, and kindness. He was not only a leader in his field, but also a generous collaborator and cherished mentor. His loss is profoundly felt by the scientific community and by all who had the privilege of working with him. His legacy, however, will endure in those he mentored and the substantial contributions he made to scientific knowledge.