NASA named astronaut Scott Tingle as chief of the Astronaut Office at the agency’s Johnson Space Center in Houston, effective Nov. 10. A decorated spaceflight veteran and former captain in the United States Navy, Tingle has logged more than 4,500 flight hours in 51 different aircraft and served as a flight engineer aboard the International Space Station.
As chief astronaut, Tingle is responsible for managing astronaut resources and operations. He also will help develop astronaut flight crew operations and make crew assignments for future human spaceflight missions, including Artemis missions to the Moon.
“Our Johnson Space Center team congratulates Scott on his selection as chief of the Astronaut Office. We wish him well as he takes on this new and exciting leadership role,” said Johnson Space Center Director Vanessa Wyche. “I extend my sincerest thanks to Joe Acaba, for his dedicated service to the Astronaut Office, as he completed the tremendous task of preparing our astronaut corps for daring missions to and from the International Space Station and integrated their expertise and space knowledge to develop and test future technologies, software, and procedures making space travel safer and more attainable for our nation’s explorers.”
A native of Randolph, Massachusetts, Tingle was selected as a NASA astronaut in 2009. He holds a bachelor’s degree in mechanical engineering from Southeastern Massachusetts University and a master’s degree in mechanical engineering from Purdue University in West Lafayette, Indiana.
Tingle most recently served as a flight engineer aboard the space station, spending more than six months in orbit during Expedition 54/55. He was the flight engineer and United States Operational Segment lead for the mission, which launched from the Baikonur Cosmodrome aboard a Soyuz spacecraft on Dec. 17, 2017, and concluded with landing on June 3, 2018. Since returning to Earth, he has supported the Astronaut Office in various roles, including mission support, technical leadership, and crew readiness activities.
Before coming to NASA, Tingle worked for The Aerospace Corporation in El Segundo, California, where he served as a technical staff member supporting the company’s propulsion department. He was commissioned as a naval officer in 1991 and went on to complete a distinguished career, earning the rank of captain before retiring. Follow Tingle on X.
Tingle succeeds NASA astronaut Joe Acaba, who had served as chief of the Astronaut Office since February 2023. Acaba has transitioned to the center director’s staff, where he provides technical advice on mission planning and strategy at NASA Johnson. In this new role, he leads the center’s alignment with NASA’s strategic plan and human spaceflight priorities, supports the agency’s STEM workforce goals, and advances collaboration with commercial space, academia, and other government partners as NASA continues its exploration beyond low Earth orbit.
October marked the fifth anniversary of NASA and the original founders signing the Artemis Accords, as well as the recognition of Hungary, Malaysia and the Philippines joining the expanding coalition dedicated to the peaceful exploration of space. The number of countries involved now totals 59.
“NASA welcomes the newest signatories, whose participation strengthens the global commitment to responsible exploration,” said acting NASA Administrator Sean Duffy. “Their decision to sign the Artemis Accords affirms a shared commitment to safe, transparent, and peaceful exploration — at a time when others seek to weaponize the final frontier. Together we are building the foundation for the Golden Age of space exploration.”
Both Malaysia and the Philippines signed the Artemis Accords as part of President Trump’s visit to Kuala Lumpur for the annual Association of Southeast Asian Nations Summit. The separate signings were announced by the White House on Oct. 26.
Foreign Minister Péter Szijjártó of Hungary signed the Artemis Accords on Oct. 22 while in Washington during an official visit, in the lead up to President Trump’s meeting with Prime Minister Viktor Orbán.
Hungary’s signing came three months after Hungarian to Orbit (HUNOR) astronaut Tibor Kapu launched to space in a mission aboard a SpaceX Dragon spacecraft to the International Space Station. The private astronauts, part of the NASA-supported Axiom Mission 4 crew, spent about two weeks conducting science, outreach, and commercial activities, alongside NASA astronauts.
Five years of progress
On Oct. 13, 2020, during the first Trump Administration, the United States, led by NASA and the U.S. Department of State, joined with seven other founding nations to establish the Artemis Accords, responding to the growing interest in lunar activities by both governments and private companies.
Since then, the Artemis Accords have grown into an international coalition. What began with a handful of founding nations has multiplied with seven countries signing in 2025 alone. The surge in participation highlights an increased global commitment to shaping a safe, peaceful, and prosperous future in space.
In September, NASA co-chaired the Artemis Accords Principals’ Meeting in Sydney alongside the space agencies of Australia and the United Arab Emirates. The gathering brought together dozens of signatory nations to deepen dialogue and strengthen shared commitments to the sustainable and responsible use of space. Global space leaders discussed the following topics:
Non-interference in each other’s space activities, including transparency on expected launch dates, general nature of activities, and landing location
Orbital debris mitigation
Interoperability of systems for safer and more efficient operations
Release of scientific data
At the meeting, NASA committed to hosting an Artemis Accords workshop in 2026 for signatories focused on transparency and the sharing of data. The agency has taken additional steps since the accords were established to release more information about lunar missions, promoting openness and preventing harmful interference.
The progress made by signatories, and their continued commitment to implementing the accords’ principles, is essential to advancing sustainable exploration of the Moon under the Artemis campaign, Mars, and beyond. Following a call to Artemis Accords signatories, four CubeSats from South Korea, Saudi Arabia, Argentina, and Germany, will fly on Artemis II.
More nations are expected to sign the accords in the months and years ahead, as NASA and its partners continue to advance the principles of the accords.
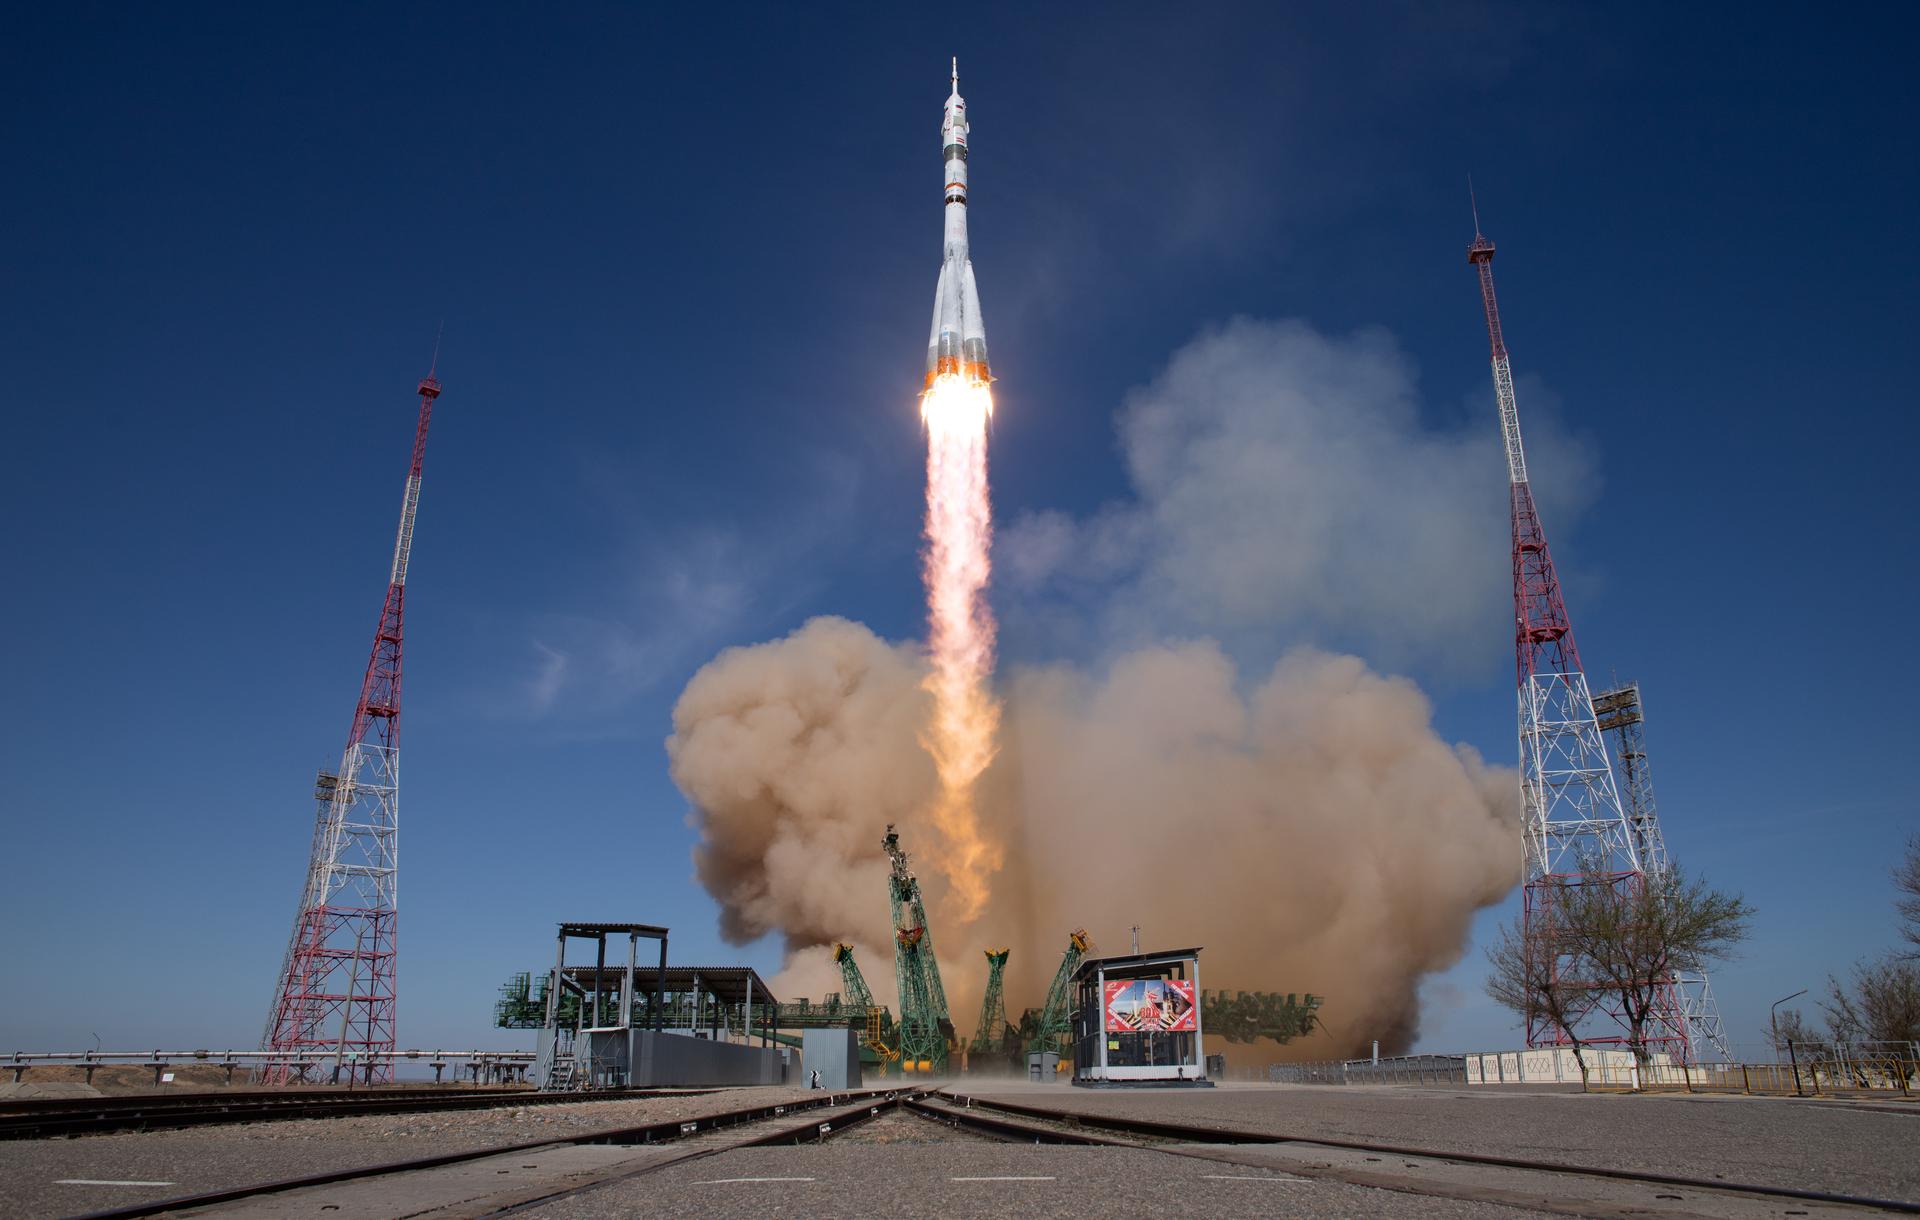
A Soyuz rocket launches to the International Space Station with Expedition 73 crew members aboard, Tuesday, April 8, 2025, at the Baikonur Cosmodrome in Kazakhstan.
NASA/Joel Kowsky
NASA astronaut Chris Williams will launch aboard the Roscosmos Soyuz MS-28 spacecraft to the International Space Station on Thursday, Nov. 27, accompanied by cosmonauts Sergey Kud-Sverchkov and Sergei Mikaev, where they will join the Expedition 73 crew advancing scientific research.
Williams, Kud-Sverchkov, and Mikaev will lift off at 4:27 a.m. EST (2:27 p.m. Baikonur time) from the Baikonur Cosmodrome in Kazakhstan. Live launch and docking coverage will be available on NASA+, Amazon Prime, and the agency’s YouTube channel. Learn how to watch NASA content through a variety of platforms, including social media.
After a two-orbit, three-hour trip to the orbital complex, the spacecraft will automatically dock to the station’s Rassvet module at approximately 7:38 a.m. Shortly after, hatches will open between Soyuz and the space station.
Once aboard, the trio will join NASA astronauts Mike Fincke, Zena Cardman, and Jonny Kim, JAXA (Japan Aerospace Exploration Agency) astronaut Kimiya Yui, and Roscosmos cosmonauts Sergei Ryzhikov, Alexey Zubritsky, and Oleg Platonov.
NASA’s coverage is as follows (all times Eastern and subject to change based on real-time operations):
9:50 a.m. – Hatch opening and welcome remarks coverage begins on NASA+, Amazon Prime, and YouTube.
10:10 a.m. – Hatch opening
Williams, Kud-Sverchkov, and Mikaev will spend approximately eight months aboard the space station as Expedition 73/74 crew members, before returning to Earth in summer 2026. This will be the first spaceflight for Williams and Mikaev, and the second for Kud-Sverchkov.
During his stay aboard station, Williams will conduct scientific research and technology demonstrations aimed at advancing human space exploration and benefiting life on Earth. He will help install and test a new modular workout system for long-duration missions, support experiments to improve cryogenic fuel efficiency and grow semiconductor crystals in space, and assist NASA in designing new re-entry safety protocols to protect crews during future missions.
For more than 25 years, people have lived and worked continuously aboard the International Space Station, advancing scientific knowledge and making research breakthroughs that are not possible on Earth. The station is a critical testbed for NASA to understand and overcome the challenges of long-duration spaceflight and to expand commercial opportunities in low Earth orbit. As commercial companies concentrate on providing human space transportation services and destinations as part of a robust low Earth orbit economy, NASA is focusing its resources on deep space missions to the Moon as part of the Artemis campaign in preparation for future human missions to Mars.
Learn more about International Space Station research and operations at:
Mars and Mercury cozy up, the Leonids sparkle, and Saturn’s rings are…disappearing?
Mars and Mercury get close for a conjunction, the Leonid meteor shower delights, and Saturn’s rings are…disappearing?
Skywatching Highlights
Nov. 12: A conjunction between Mars and Mercury
Nov. 16-18: Leonid meteor shower peak viewing
Nov. 23: Saturn’s rings disappear
Transcript
Mars and Mercury have a cozy conjunction, the Leonid meteor shower delights, and Saturn’s rings are…disappearing?
That’s What’s Up for November.
Conjunction:
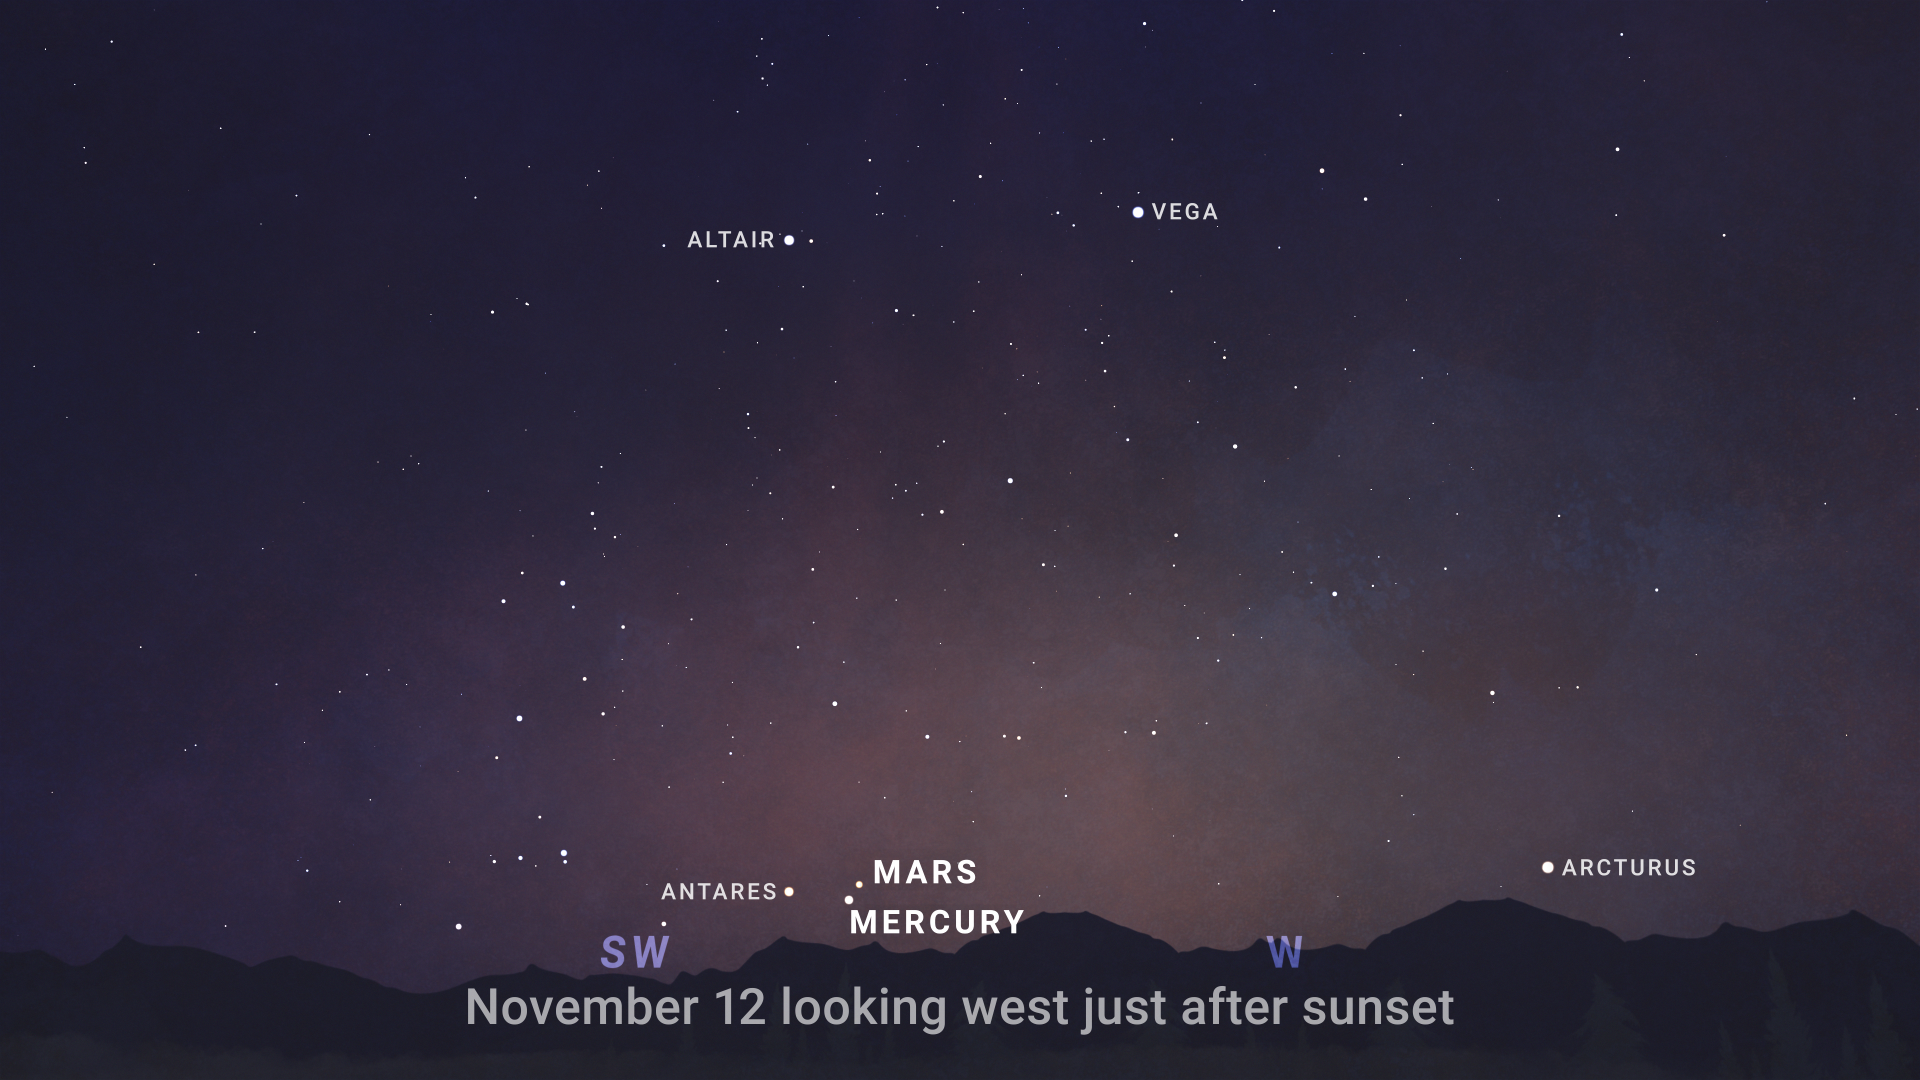
Mars and Mercury will cozy up together in the night sky just after sunset on November 12th.
The planets will experience what is known as a conjunction, meaning they appear close together in the sky from our view (even though in real life, Mars and Mercury are well over 100 million miles apart).
But you can see these two long distance pals close together if you look slightly southwest just after sunset in the early evening sky on November 12th.
NASA/JPL-Caltech
Mars will be just to the right above Mercury, and you’ll know it’s Mars by its distinctive reddish-orange color.
Leonid Meteor Shower:
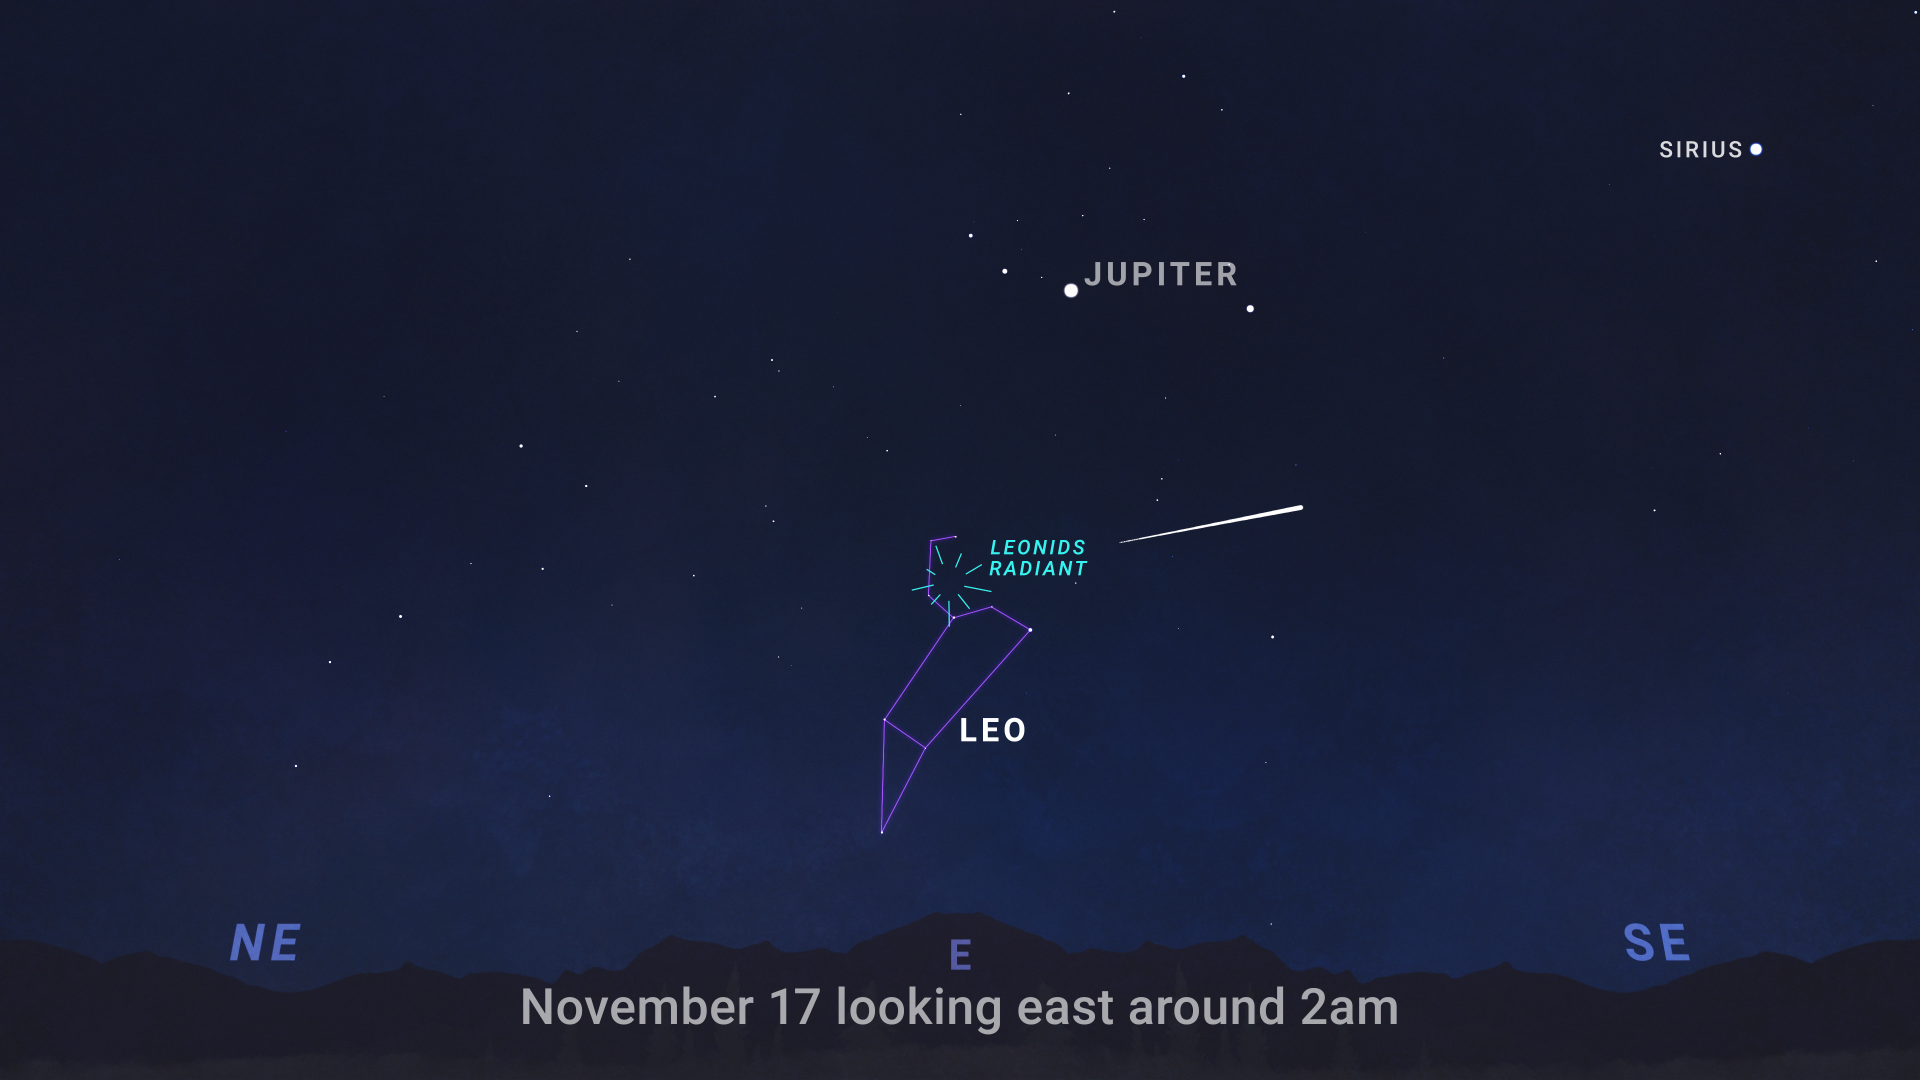
The Leonid meteor shower will sparkle across the skies this month, peaking on November 17th.
NASA/JPL-Caltech
While the meteor shower stretches from November 3rd through December 2nd, it will be at its most visible late on the night of November 16th into the dawn of November 17th, even into the early morning of November 18th.
Look for meteors coming from the shower’s radiant point within the constellation Leo in the eastern sky.
With dark skies, you might see 10-15 meteors per hour with this shower which happens when we travel through the debris trailing the comet 55P/Tempel-Tuttle.
Saturn’s rings disappear
Saturn’s rings will disappear from view this November!
Saturn orbits the sun leaning at an angle of 26.7 degrees. This means that from our view, its rings shift up and down over time.
On November 23, Saturn will be angled in such a way that its rings face us, and since they are so thin they’ll just disappear from view.
Alan Friedman/avertedimagination.com
But don’t worry, the rings aren’t gone from view forever. As the planet continues to orbit, its rings will gradually become more visible again.
Conclusion + Moon Phases
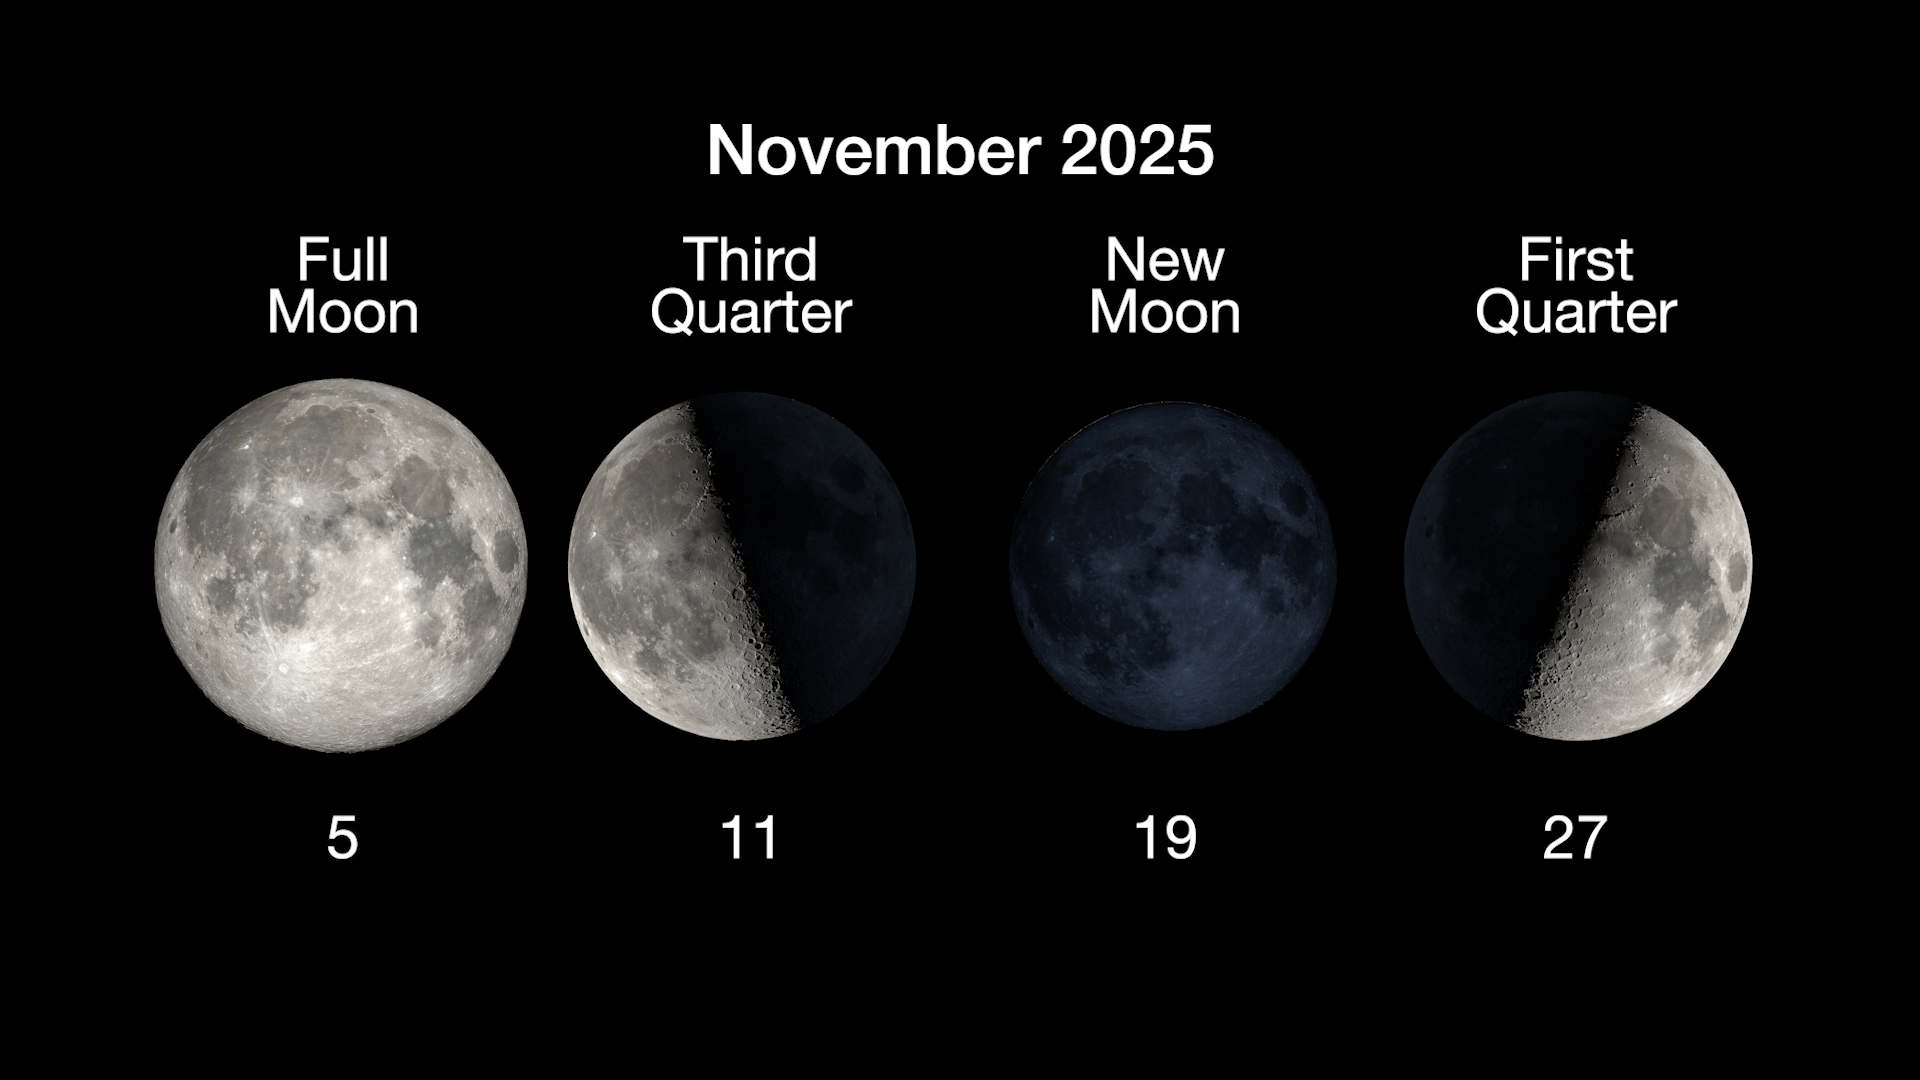
Here are the phases of the Moon for November.
NASA/JPL-Caltech
You can stay up to date on all of NASA’s missions exploring the solar system and beyond at science.nasa.gov.
I’m Chelsea Gohd from NASA’s Jet Propulsion Laboratory, and that’s What’s Up for this month.
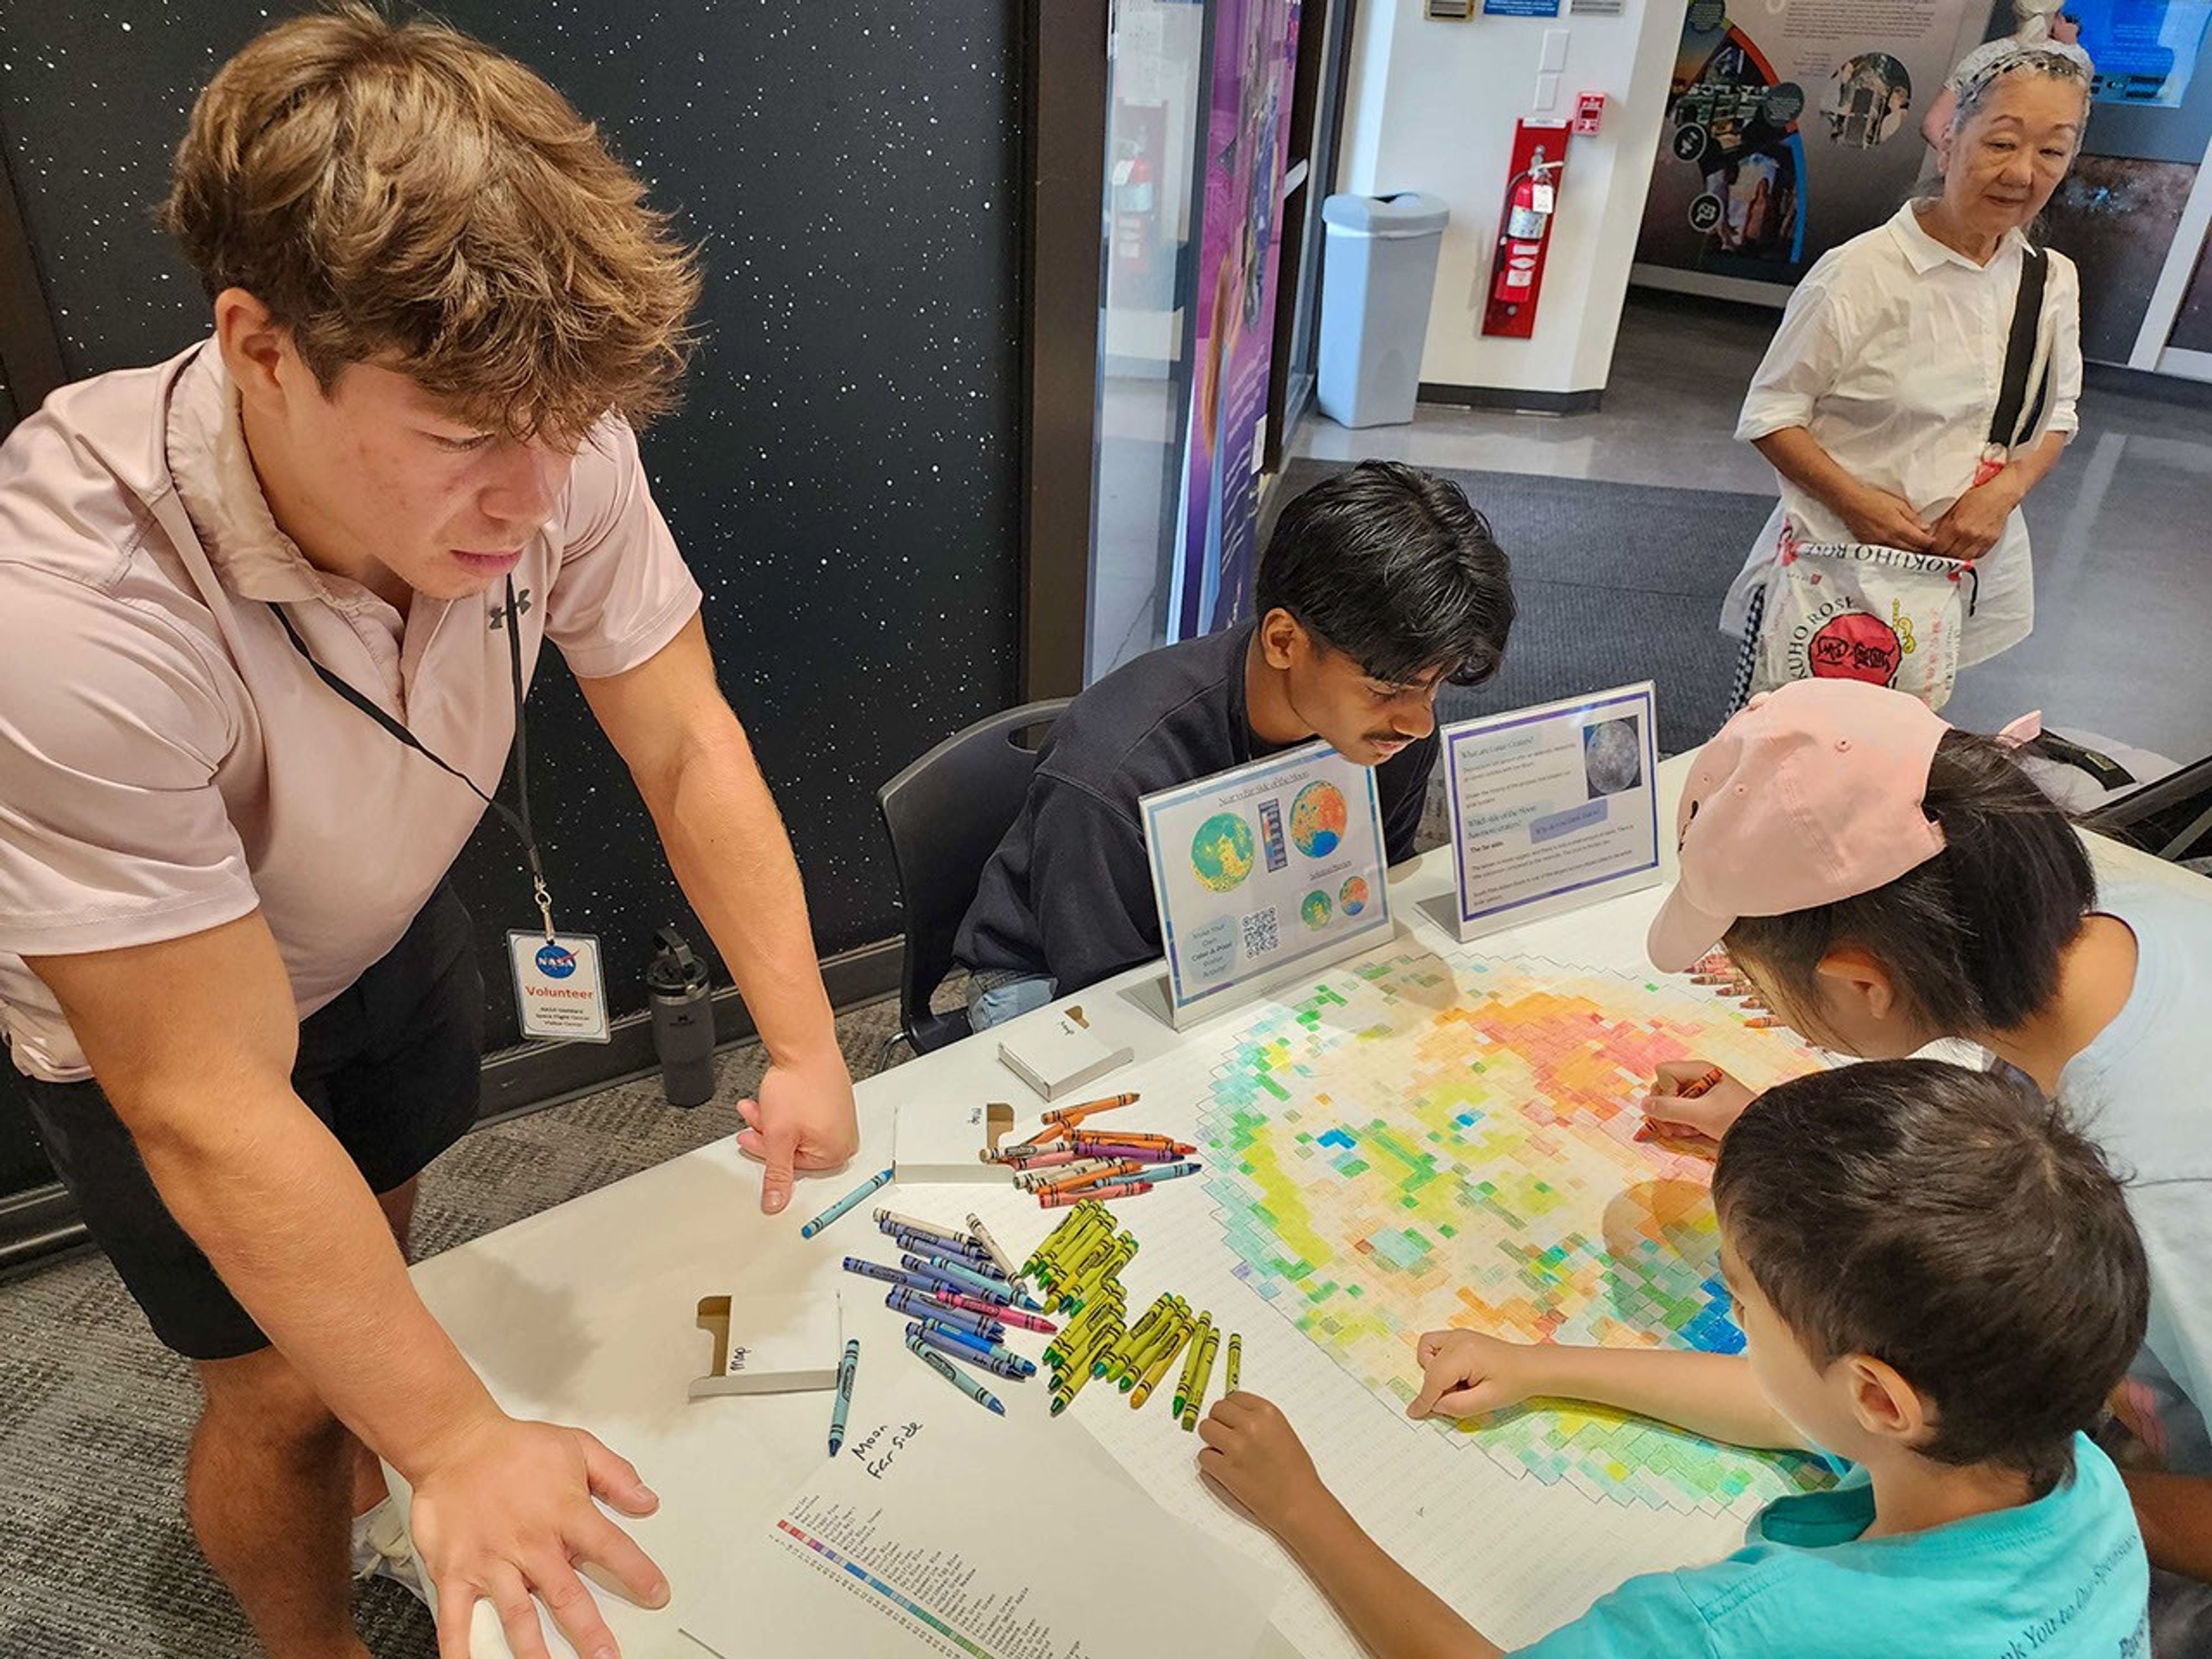
NASA Fuels Discovery from Earth to Sky: One Crayon at a Time
Student interns help kids color in data to learn more about the far side of the Moon while visiting the Goddard Space Flight Center Visitor Center.
Photo Credit: NASA Earth to Sky
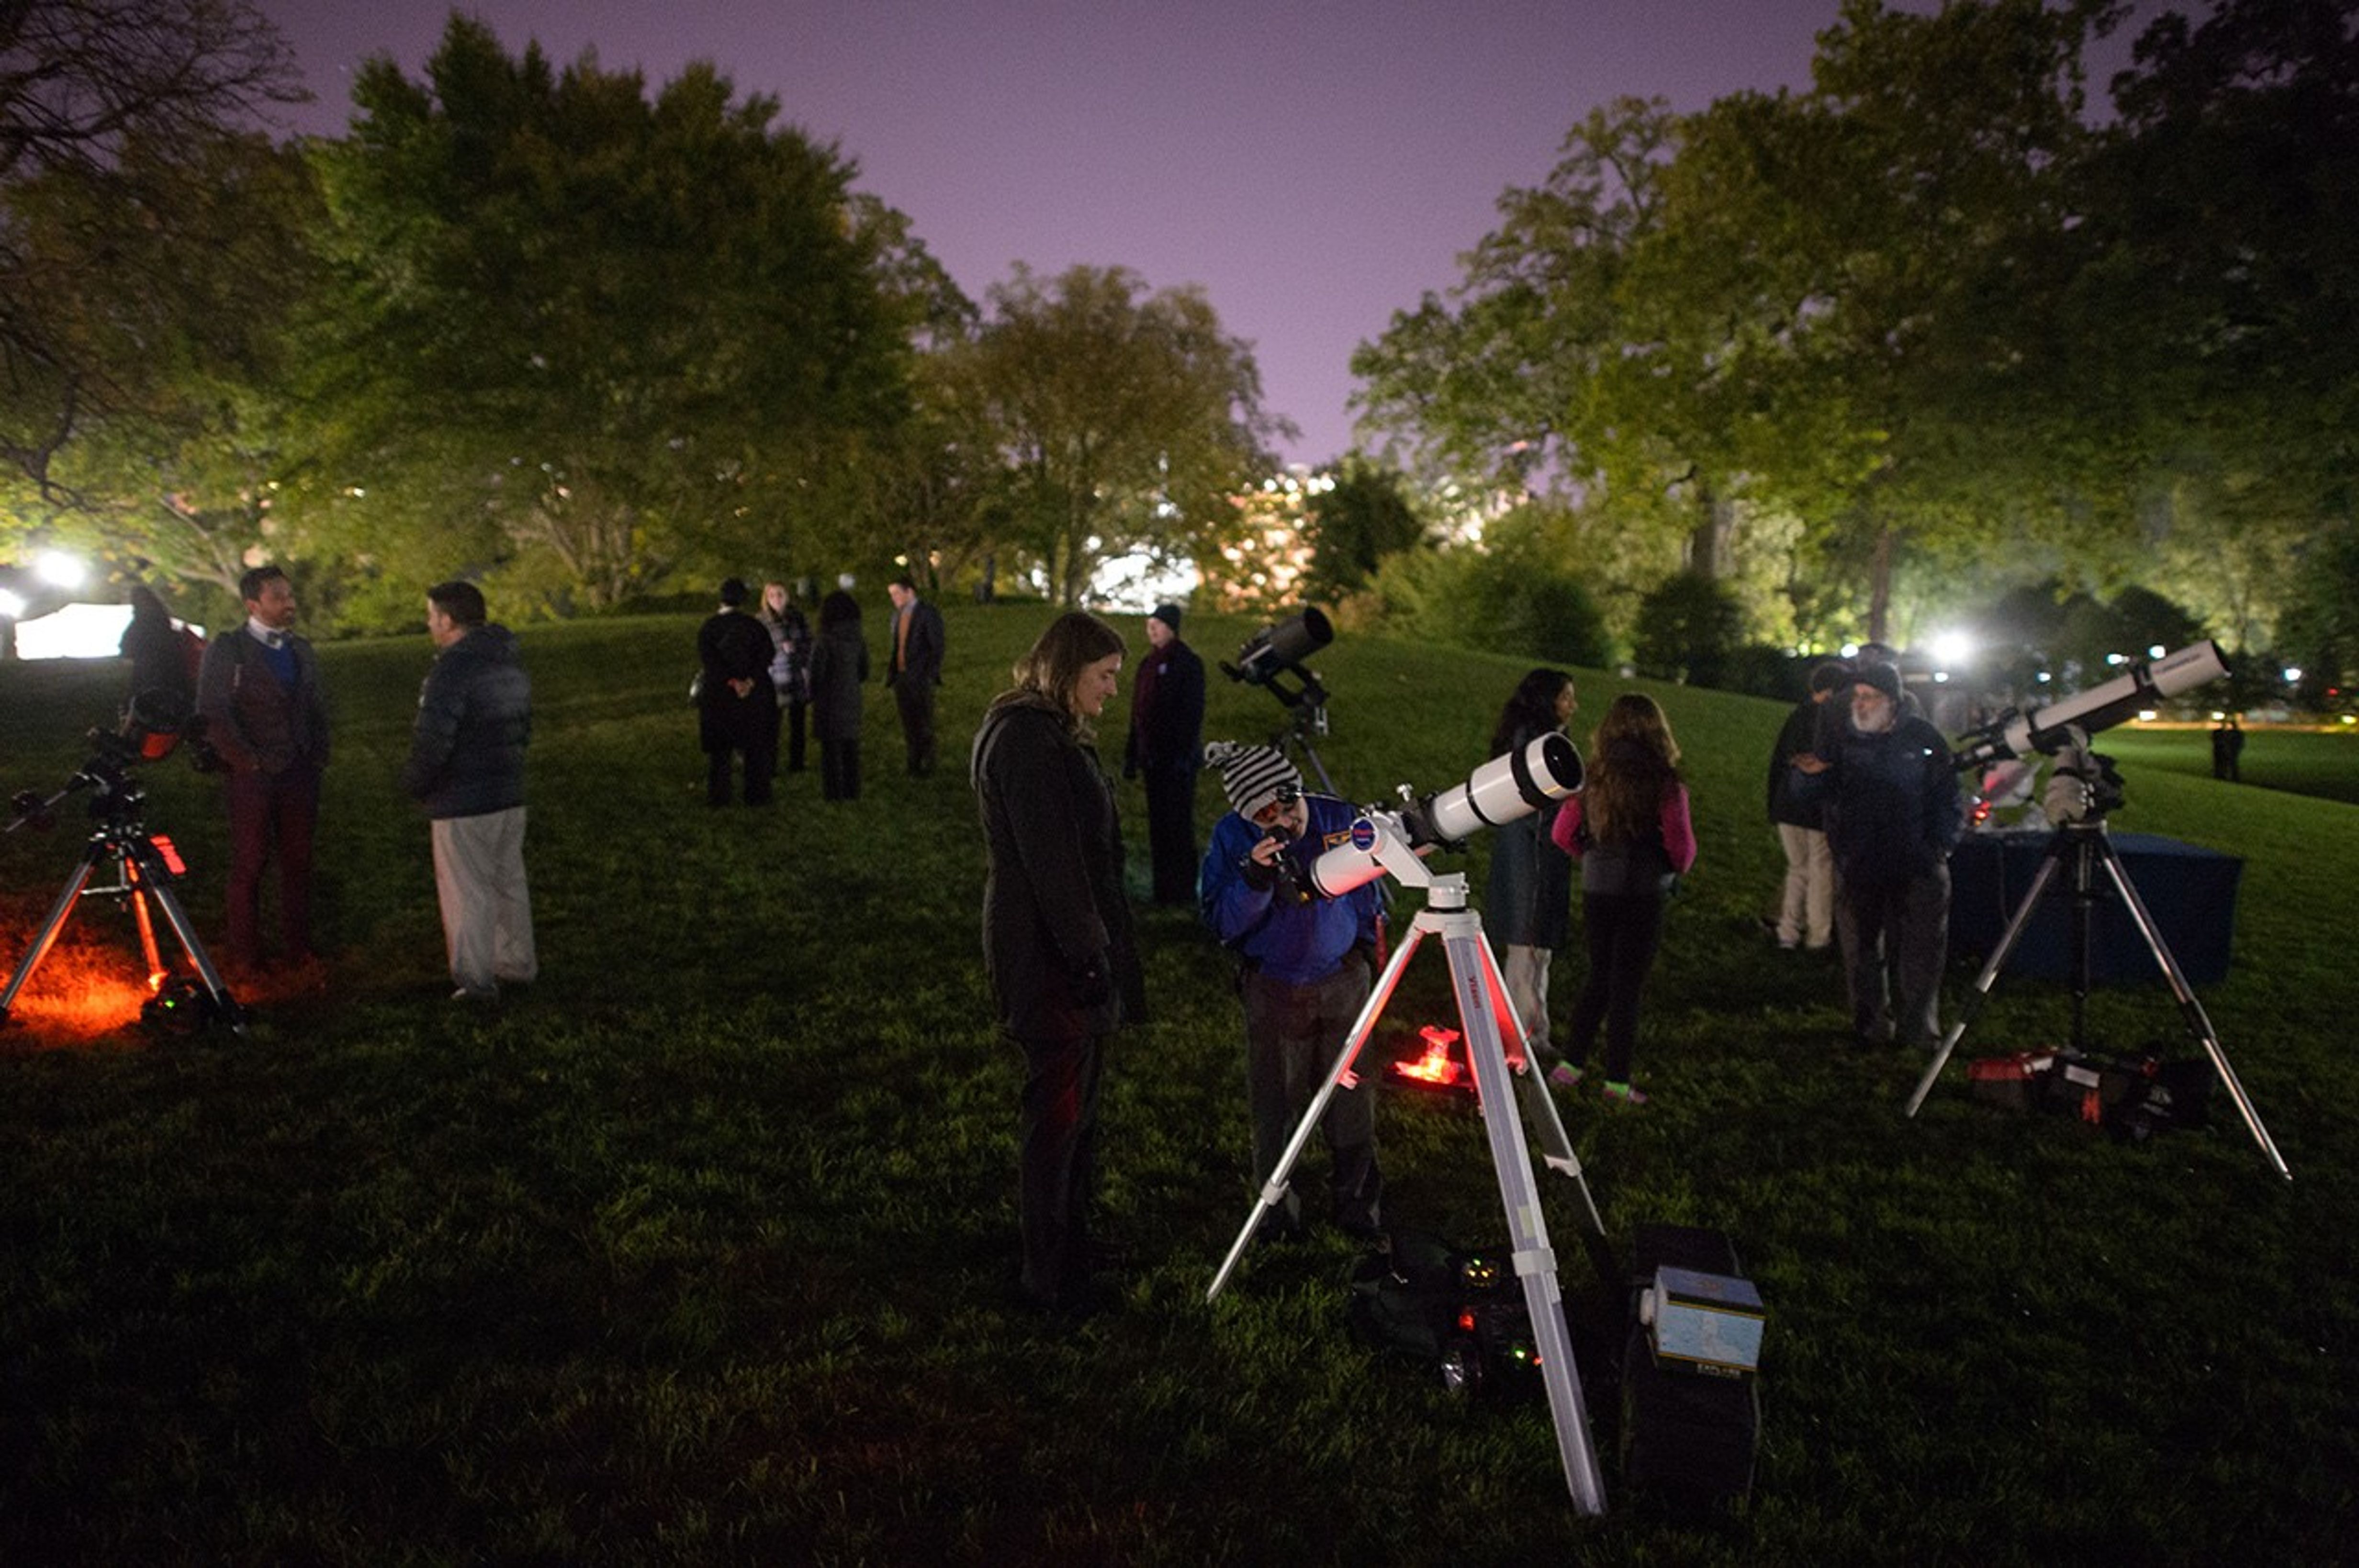
A collaboration between the NASA Earth Science Education Collaborative (NESEC) and Earth to Sky (ETS) – an exciting, growing partnership between NASA, the National Park Service, and other federal, state, and local organizations – is facilitating the implementation of a simple, yet incredibly effective activity that will help millions of national park visitors connect with NASA Earth and space science.
The Color-a-Pixel activity, developed by NESEC, transforms complex satellite imagery into accessible, collaborative art projects. Incorporating this simple technique into ETS science communication training programs demonstrates to park interpreters and outdoor educators how NASA’s view from space can enhance millions of visitor experiences at parks, refuges, and nature centers.
“This low-tech activity is powerful because of its simplicity,” explains ETS Space Science Coordinator Brandi Stewart, “All you have to do is pick up a crayon, follow the easy number guides, and discover the stories that NASA satellites are telling us about our world and beyond.”
The Color-a-Pixel activity begins with selecting satellite imagery from NASA missions like Landsat, the Mars Reconnaissance Orbiter (MRO), or the Lunar Reconnaissance Orbiter (LRO). Using technology developed by NESEC’s lead organization, the Institute for Global Environmental Strategies, these images are converted into a 3’ by 2’ poster of numbered squares, each corresponding to one of 120 standard Crayola crayon colors.
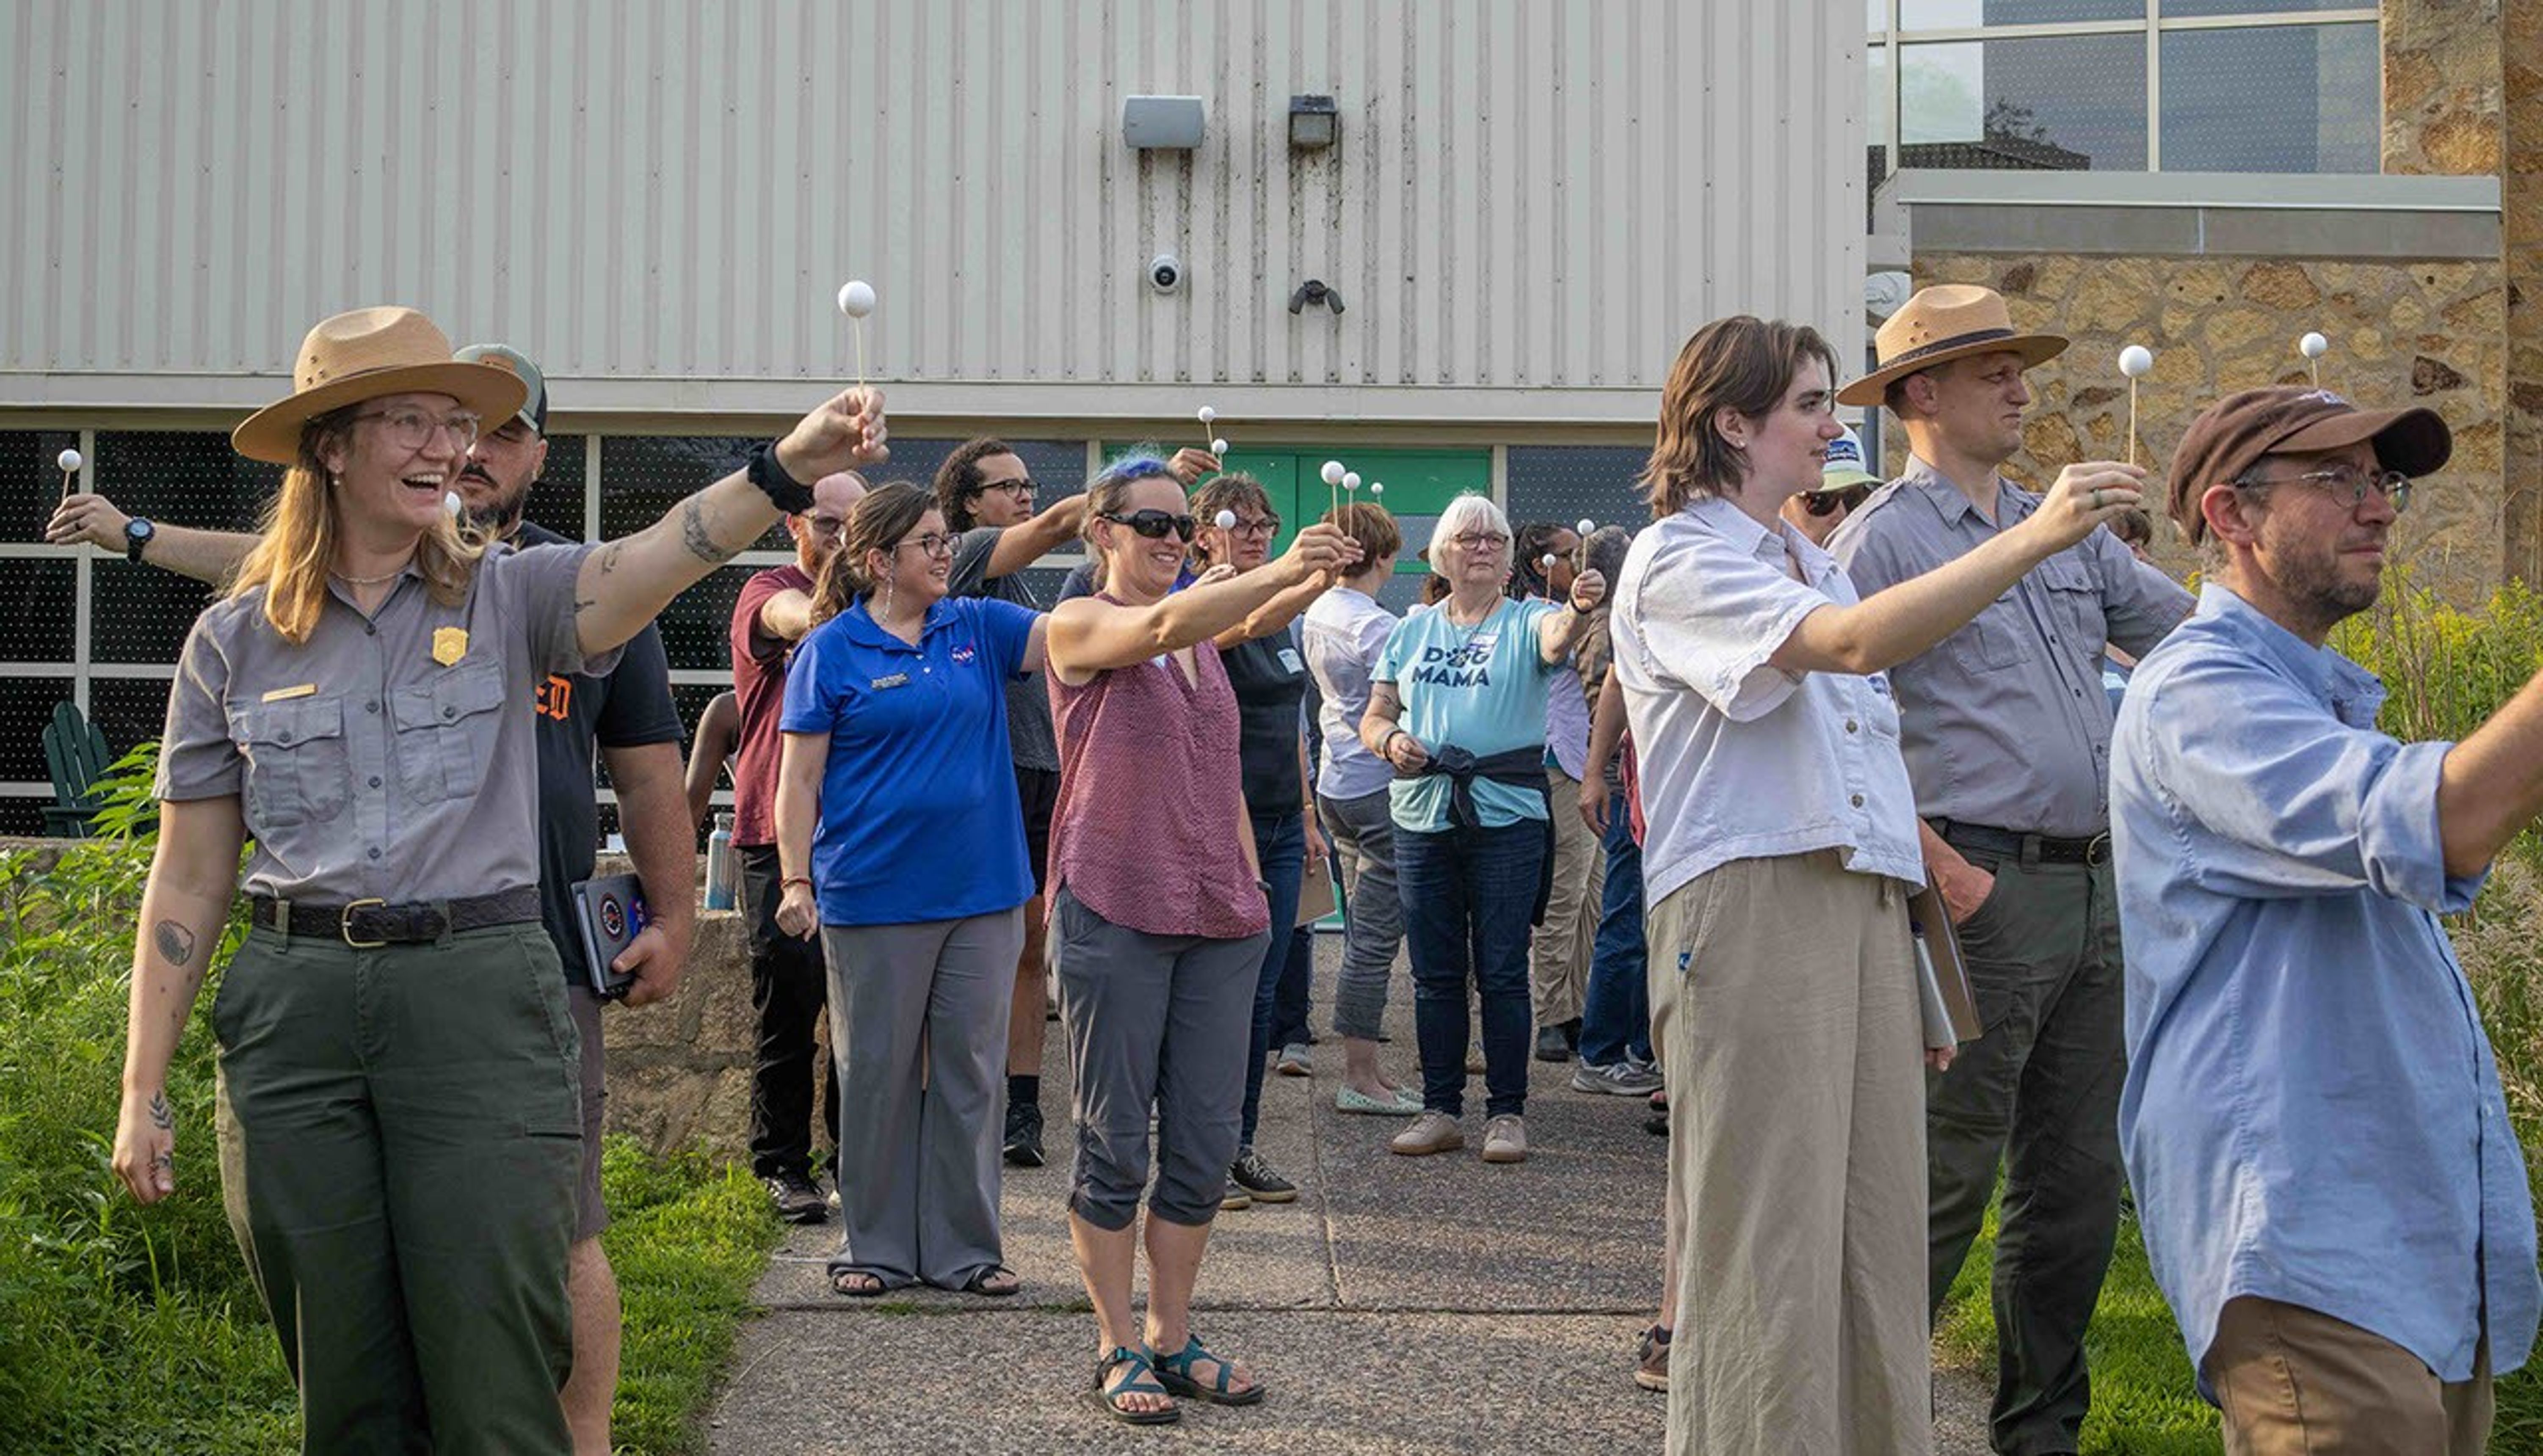
Earth to Sky demonstrates the magnetic appeal of this activity by setting it up for the rangers and educators during workshops. With a bit of explanation, participants immediately jump in, eager to reveal the imagery and data shown through the pixels.
“It becomes a group mission that, by the end of the training, the image will be fully colored in and complete. It’s been a great teambuilding and stress-relieving activity for our participants,” states Geneviève de Messières, Earth to Sky Program Lead.
When applied to public lands communication efforts, this activity becomes a tool for interpretive messaging. While visitors work on completing the image, park rangers can weave in scientific concepts, environmental change stories, and space exploration connections. This activity also drives home that satellite imagery is more than just a pretty picture – each pixel is also data that scientists use to better understand Earth and other worlds throughout our solar system.
Bringing Space Down to Earth
Some ways that Earth to Sky has implemented the activity at special events on public lands include:
Death Valley Dark Sky Festival, California: Visitors were invited to color Landsat imagery of Earth’s Badwater Basin and MRO imagery of Mars’ Belva Crater. As they colored, Earth to Sky outreach specialists made connections between finding signs of water on the dry landscapes in both locations.
Park After Dark, Minnesota: During this urban event hosted by Mississippi River & National Recreation Area in Minneapolis St. Paul, attendees worked together to color topographical maps of both the Moon’s familiar near side and its mysterious far side, using data from NASA’s Lunar Reconnaissance Orbiter. The striking differences that emerged through their coloring sparked questions about why the Moon’s two hemispheres appear so dramatically different, leading to rich discussions about lunar formation and geological change.
Patuxent Wildlife Refuge Open House, Maryland: Just miles from the urban centers of Baltimore and Washington DC, the Color-a-Pixel activity helped local community members visualize something they could feel but not easily see: the refuge’s role as a “cool island” in an urban heat landscape. Visitors colored Landsat imagery of the refuge and surrounding neighborhoods while examining heat maps showing temperature differences between developed areas and the protected green space. The activity helped residents understand the refuge’s importance beyond wildlife habitat.
The collaboration between NESEC and Earth to Sky brings complex scientific concepts to diverse audiences in engaging and relevant ways. Earth to Sky’s community of practice –now including more than 2,000 interpreters and environmental educators – reaches millions of visitors annually across the country’s parks, refuges, and nature centers.
Theresa Schwerin, who leads NESEC, noted that Color-a-Pixel originally started as a simple idea for a tabletop activity to use at conferences and public events. “I wanted something hands-on that could draw people in and start conversations as simple as ‘these beautiful NASA images from space are data’ and talk about different NASA missions and how they are relevant to people’s lives. There’s also an opportunity to invite the public to contribute to NASA science by participating in citizen science projects … [some of which] can fill in the details of the pixels with information that complements NASA’s view from space.”
Andrew Clark, a data scientist and engineer at IGES, created the Color-a-Pixel poster generator, which has gone through several iterations to make it more effective. Schwerin noted, “I’ve used this at several public events. Kids will jump right in, with parents watching over their shoulders. Soon enough, the entire family is coloring together and asking questions about the image and NASA. I am thrilled about our collaboration with Earth to Sky that is taking this even further.”
As environmental challenges increasingly affect public lands, this collaboration helps visitors understand these issues through NASA’s unique perspective from above. The activity also introduces learners of all ages to the broader value of NASA’s Earth science missions alongside its more well-known space exploration endeavors.
Continuing to Color Outside the Lines
Looking ahead, the Earth to Sky partnership plans to continue using this activity in each new place they host a training. Most recently, Earth to Sky shared the activity with 417 visitors to the Goddard Space Flight Center Visitor Center, where local families colored in topographical Moon maps to prepare for International Observe the Moon Night. Additionally, a recording of a recent Color-a-Pixel webinar with NESEC’s Theresa Schwerin is available on the Earth to Sky website for interpreters and informal educators interested in implementing this place-based activity. Free registration is required to access this (and dozens of other) webinar recordings.
The success of this collaboration demonstrates how seemingly simple activities – enhanced with NASA science – can create meaningful learning experiences that resonate with visitors long after they leave a park or refuge.
For interpreters, educators, or NASA enthusiasts interested in bringing the Color-a-Pixel activity to their own sites or events, pre-generated activities are available in the gallery at: https://strategies.org/color-a-pixel-pregenerated.
NASA science is helping humanity discover new perspectives on both our home planet and the universe beyond, one crayon at a time. Learn more about how Science Activation connects NASA science experts, real content, and experiences with community leaders to do science in ways that activate minds and promote deeper understanding of our world and beyond: https://science.nasa.gov/learn/about-science-activation/.
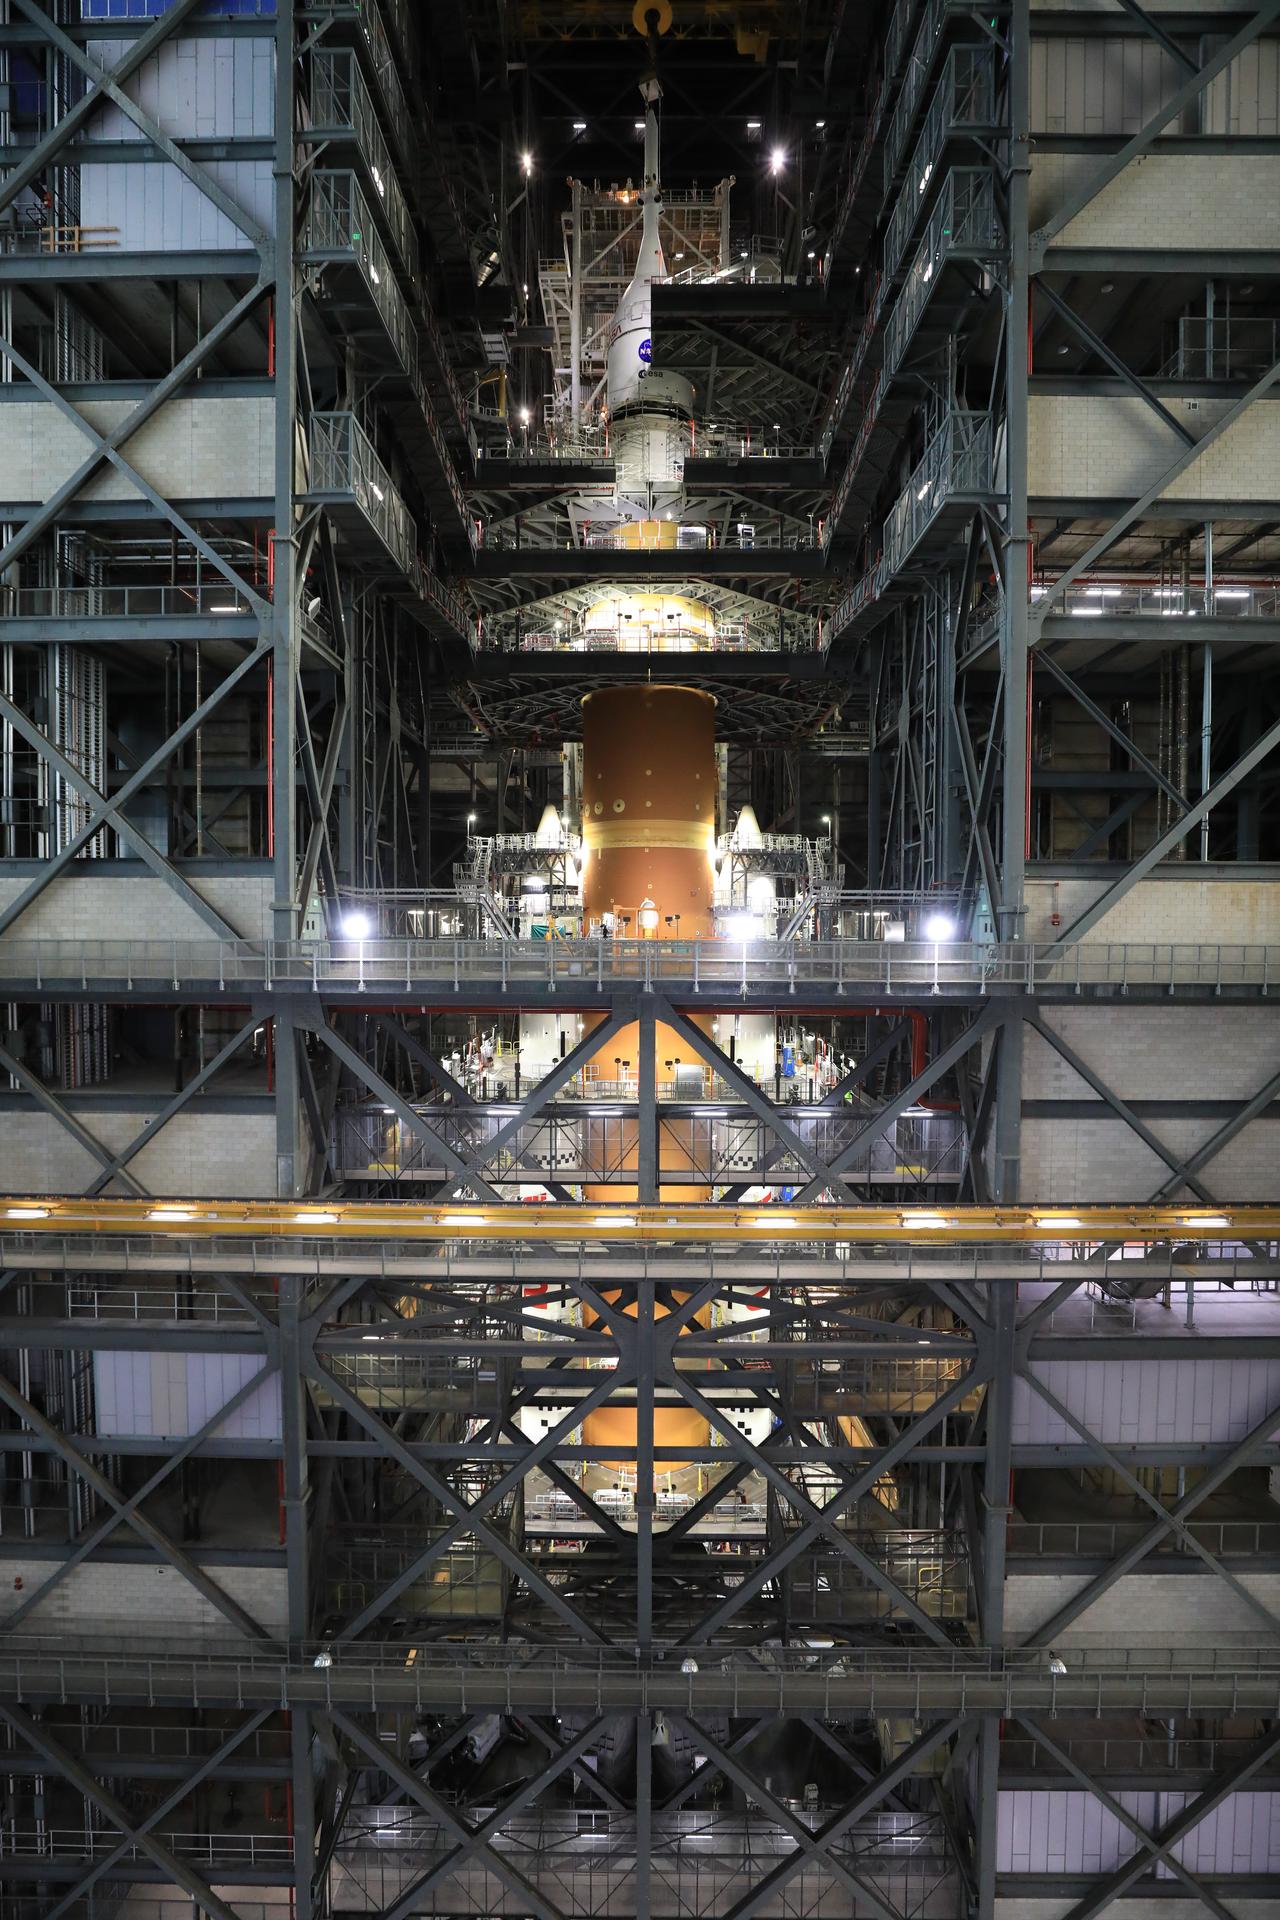
Technicians with NASA’s Exploration Ground Systems team use a crane to lift and secure NASA’s Orion spacecraft on top of the SLS (Space Launch System) rocket in High Bay 3 of the Vehicle Assembly Building at NASA’s Kennedy Space Center in Florida on Saturday, Oct. 18, 2025, for the agency’s Artemis II mission. Set to launch in 2026, the spacecraft will carry NASA astronauts Reid Wiseman, Victor Glover, Christina Koch, and CSA (Canadian Space Agency) astronaut Jeremy Hansen on a 10-day mission around the Moon and back. Once stacked, teams will begin conducting a series of verification tests ahead of rolling out to Launch Complex 39B for the wet dress rehearsal at NASA Kennedy.
NASA/Kim Shiflett
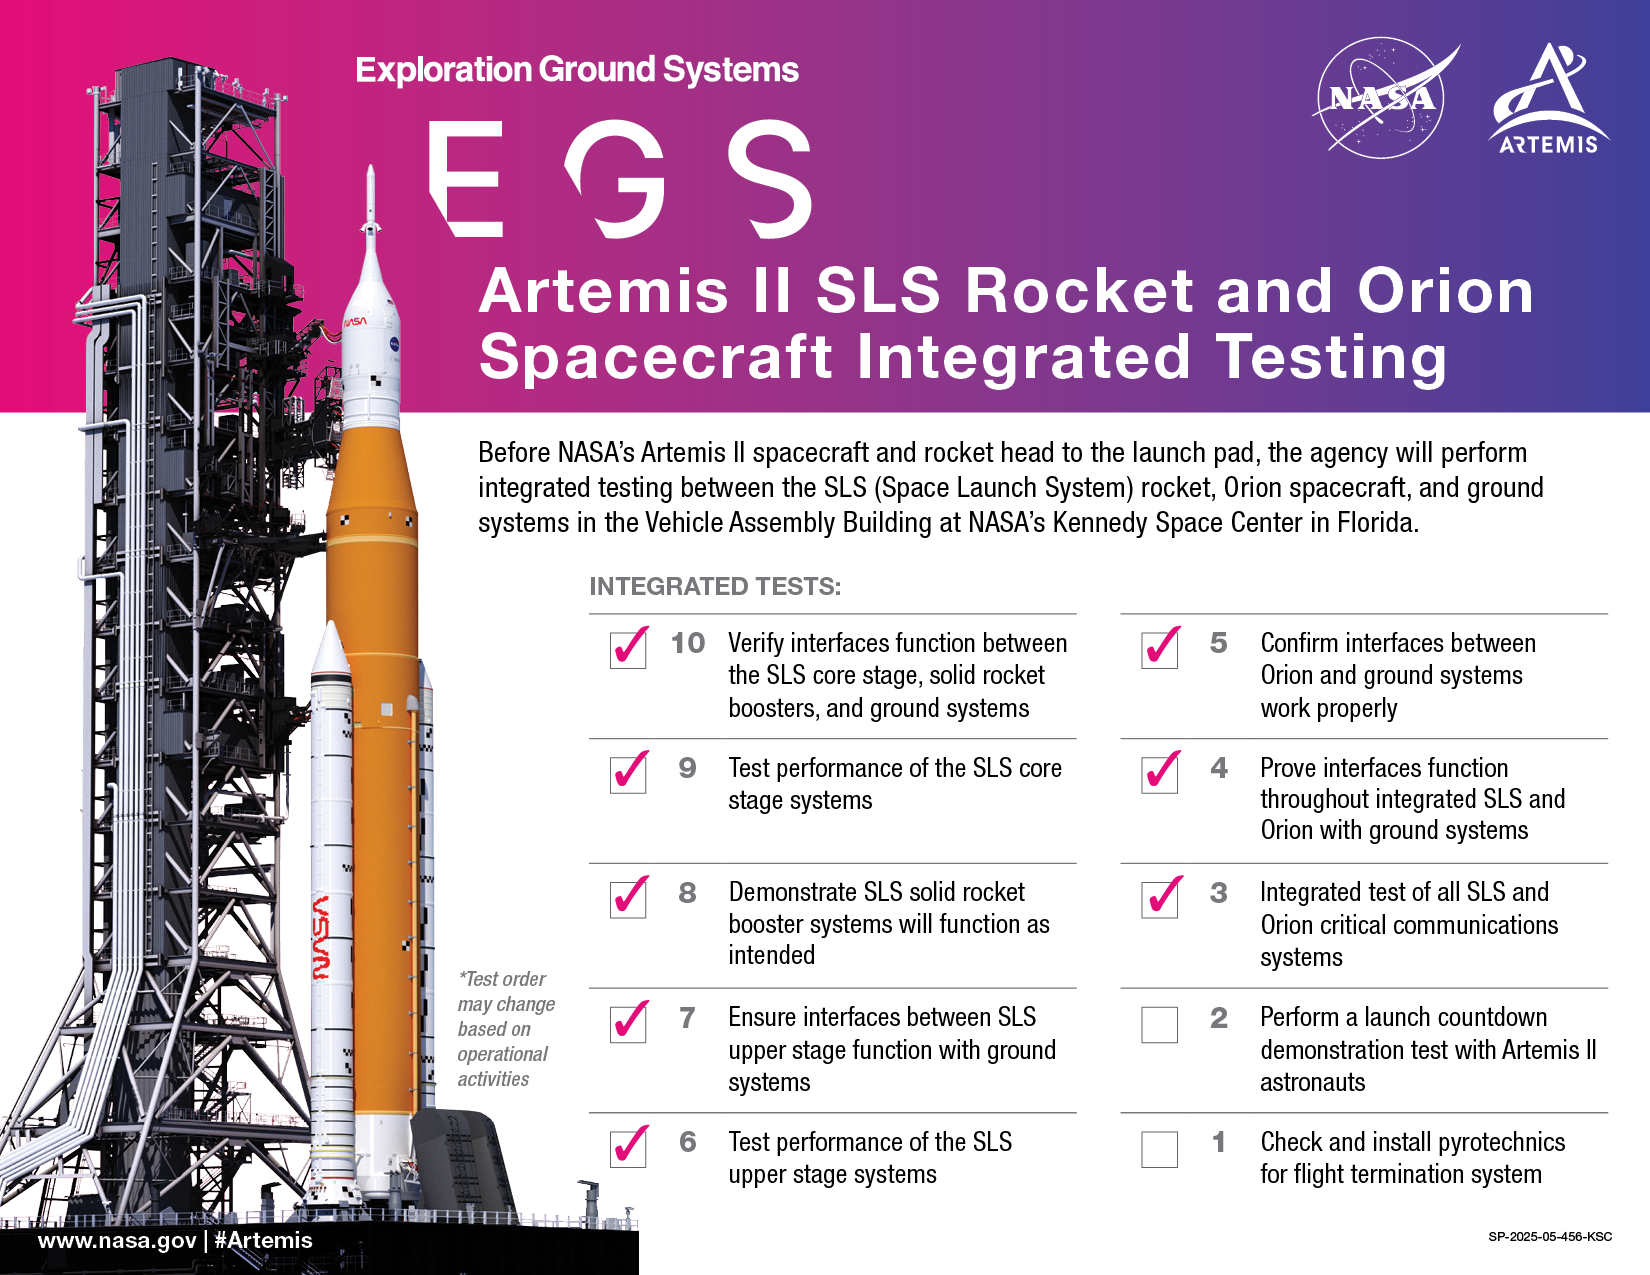
As 2026 nears, NASA continues moving forward to launching and flying Artemis II, the first crewed mission under the Artemis campaign, no later than April next year.
NASA’s Orion spacecraft, complete with its launch abort system escape tower, is now integrated with the SLS (Space Launch System) rocket in the Vehicle Assembly Building (VAB) at the agency’s Kennedy Space Center in Florida. Following Orion stacking, teams completed testing critical communications systems between SLS and Orion, and confirmed the interfaces function properly between the rocket, Orion, and the ground systems, including end-to-end testing with the Near Space Network and Deep Space Network, which aid in communications and navigation.
“NASA remains focused on getting ready to safely fly four astronauts around the Moon and back,” said acting NASA Administrator Sean Duffy. “Our mission will lay the groundwork for future missions to the lunar surface and to Mars.”
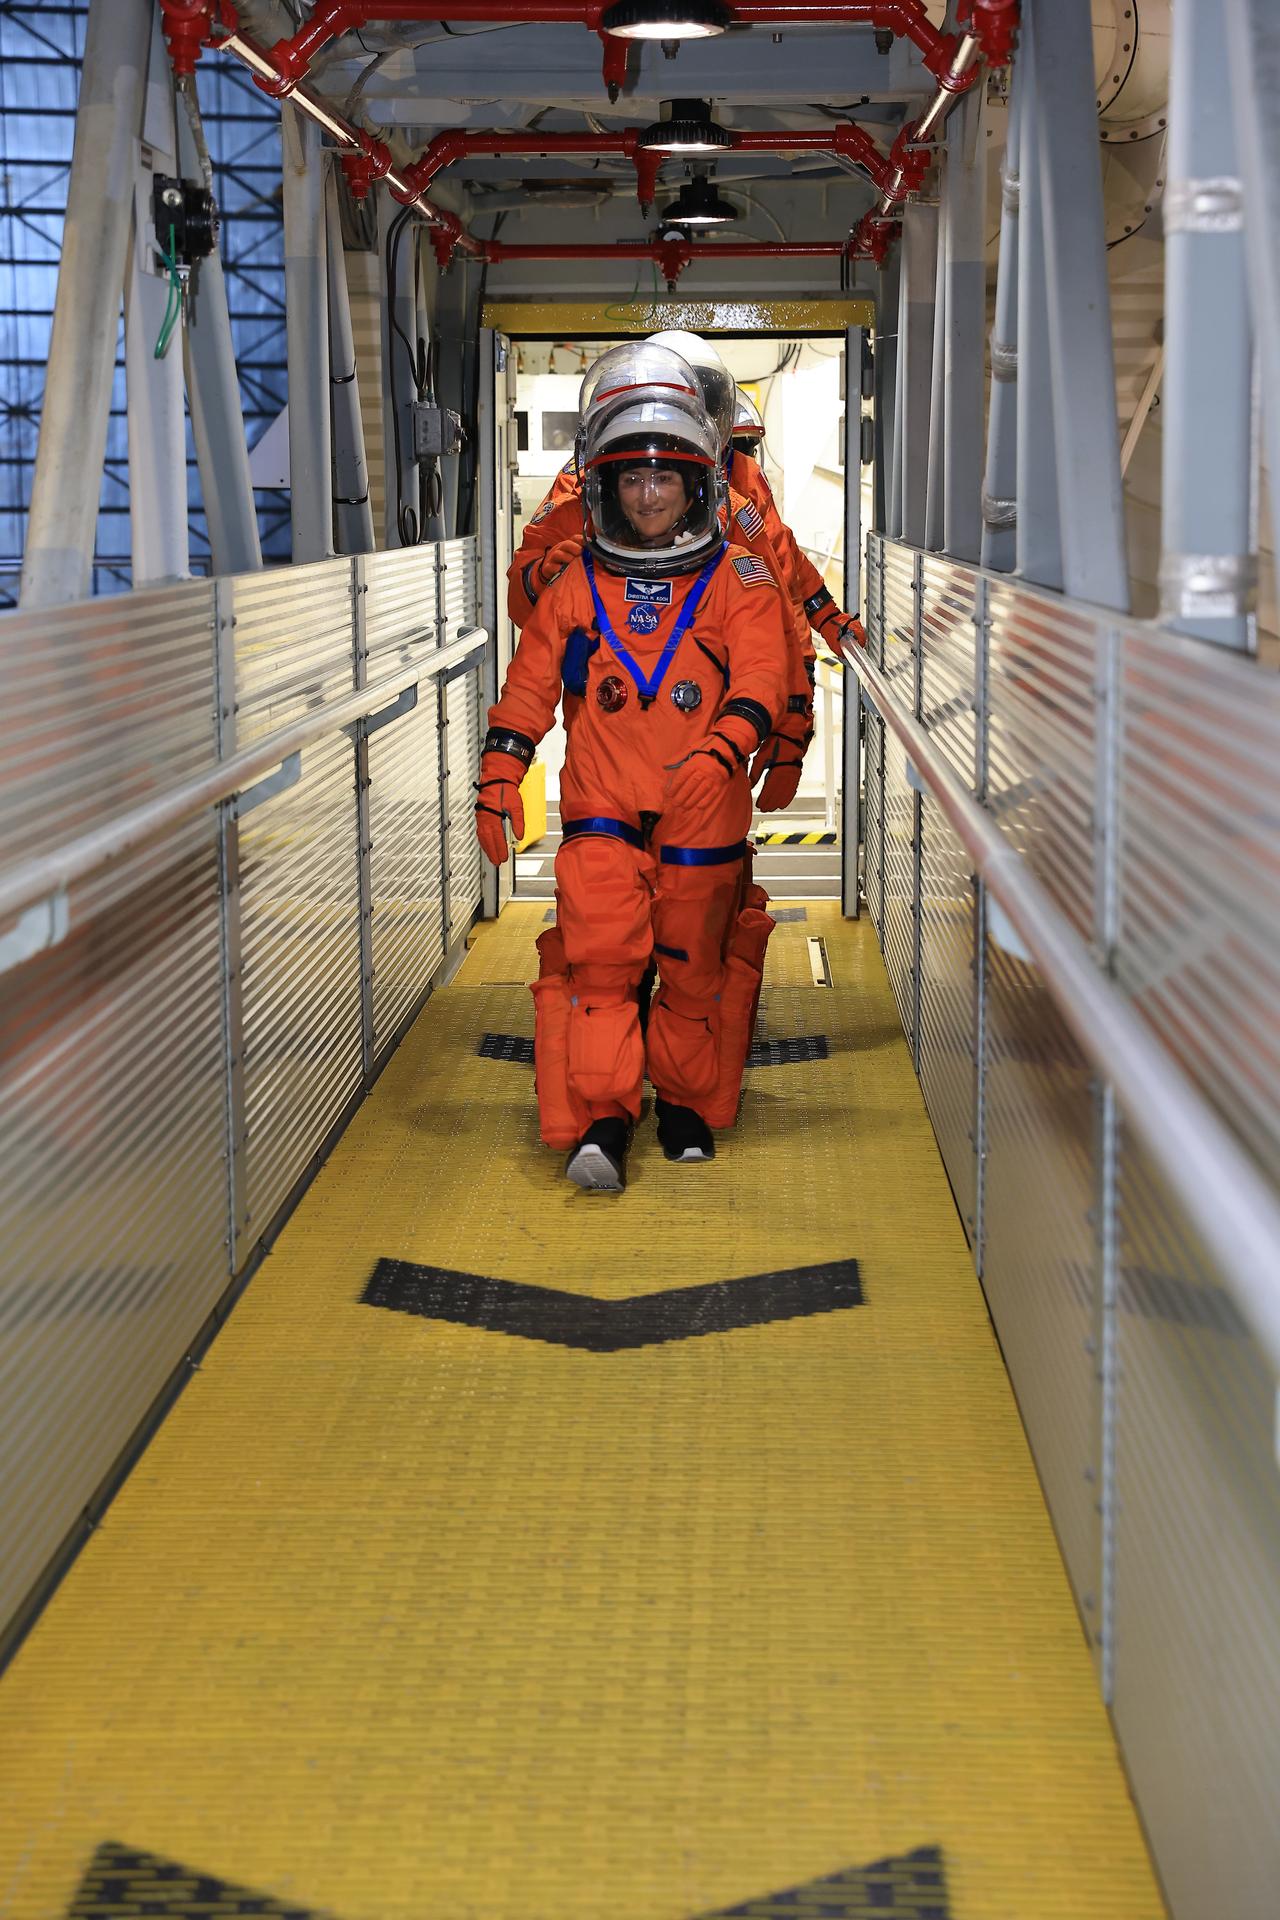
In the coming weeks, engineers and the Artemis II crew will conduct the first part of a Countdown Demonstration Test at Kennedy, a dress rehearsal for launch day. The crew will don their Orion crew survival system spacesuits and venture to their rocket before being secured inside Orion, which the crew recently named Integrity, simulating the final moments of the countdown. Because the rocket and spacecraft are not yet at the launch pad, the crew will board Orion inside the VAB. The test will serve as a final verification of the timeline for the crew and supporting teams on the ground. A second part of the test, preparing for an emergency at the launch pad, will occur after the rocket and spacecraft roll out to Launch Pad 39B.
NASA astronaut Christina Koch, Artemis II mission specialist, and the remaining Artemis II crew members walk on the crew access arm of the mobile launcher in the Vehicle Assembly Building at NASA’s Kennedy Space Center in Florida on Tuesday, Aug. 12, 2025.
NASA/Kim Shiflett
The Artemis II crew and ground personnel responsible for launching and flying the mission are preparing to conduct additional integrated simulations across teams and facilities to prepare for any scenario that could arise as the crew of four launches from Florida and flies their approximately 10-day mission.
NASA astronauts Reid Wiseman, Victor Glover, and Christina Koch, and CSA (Canadian Space Agency) astronaut Jeremy Hansen, have a busy schedule over the next several months reviewing procedures for all phases of flight until their preparations are second nature, practicing for different mission scenarios, and maintaining their familiarity with every element of their spacecraft.
Through Artemis, NASA will send astronauts to explore the Moon for scientific discovery, economic benefits, and build the foundation for the first crewed missions to Mars.
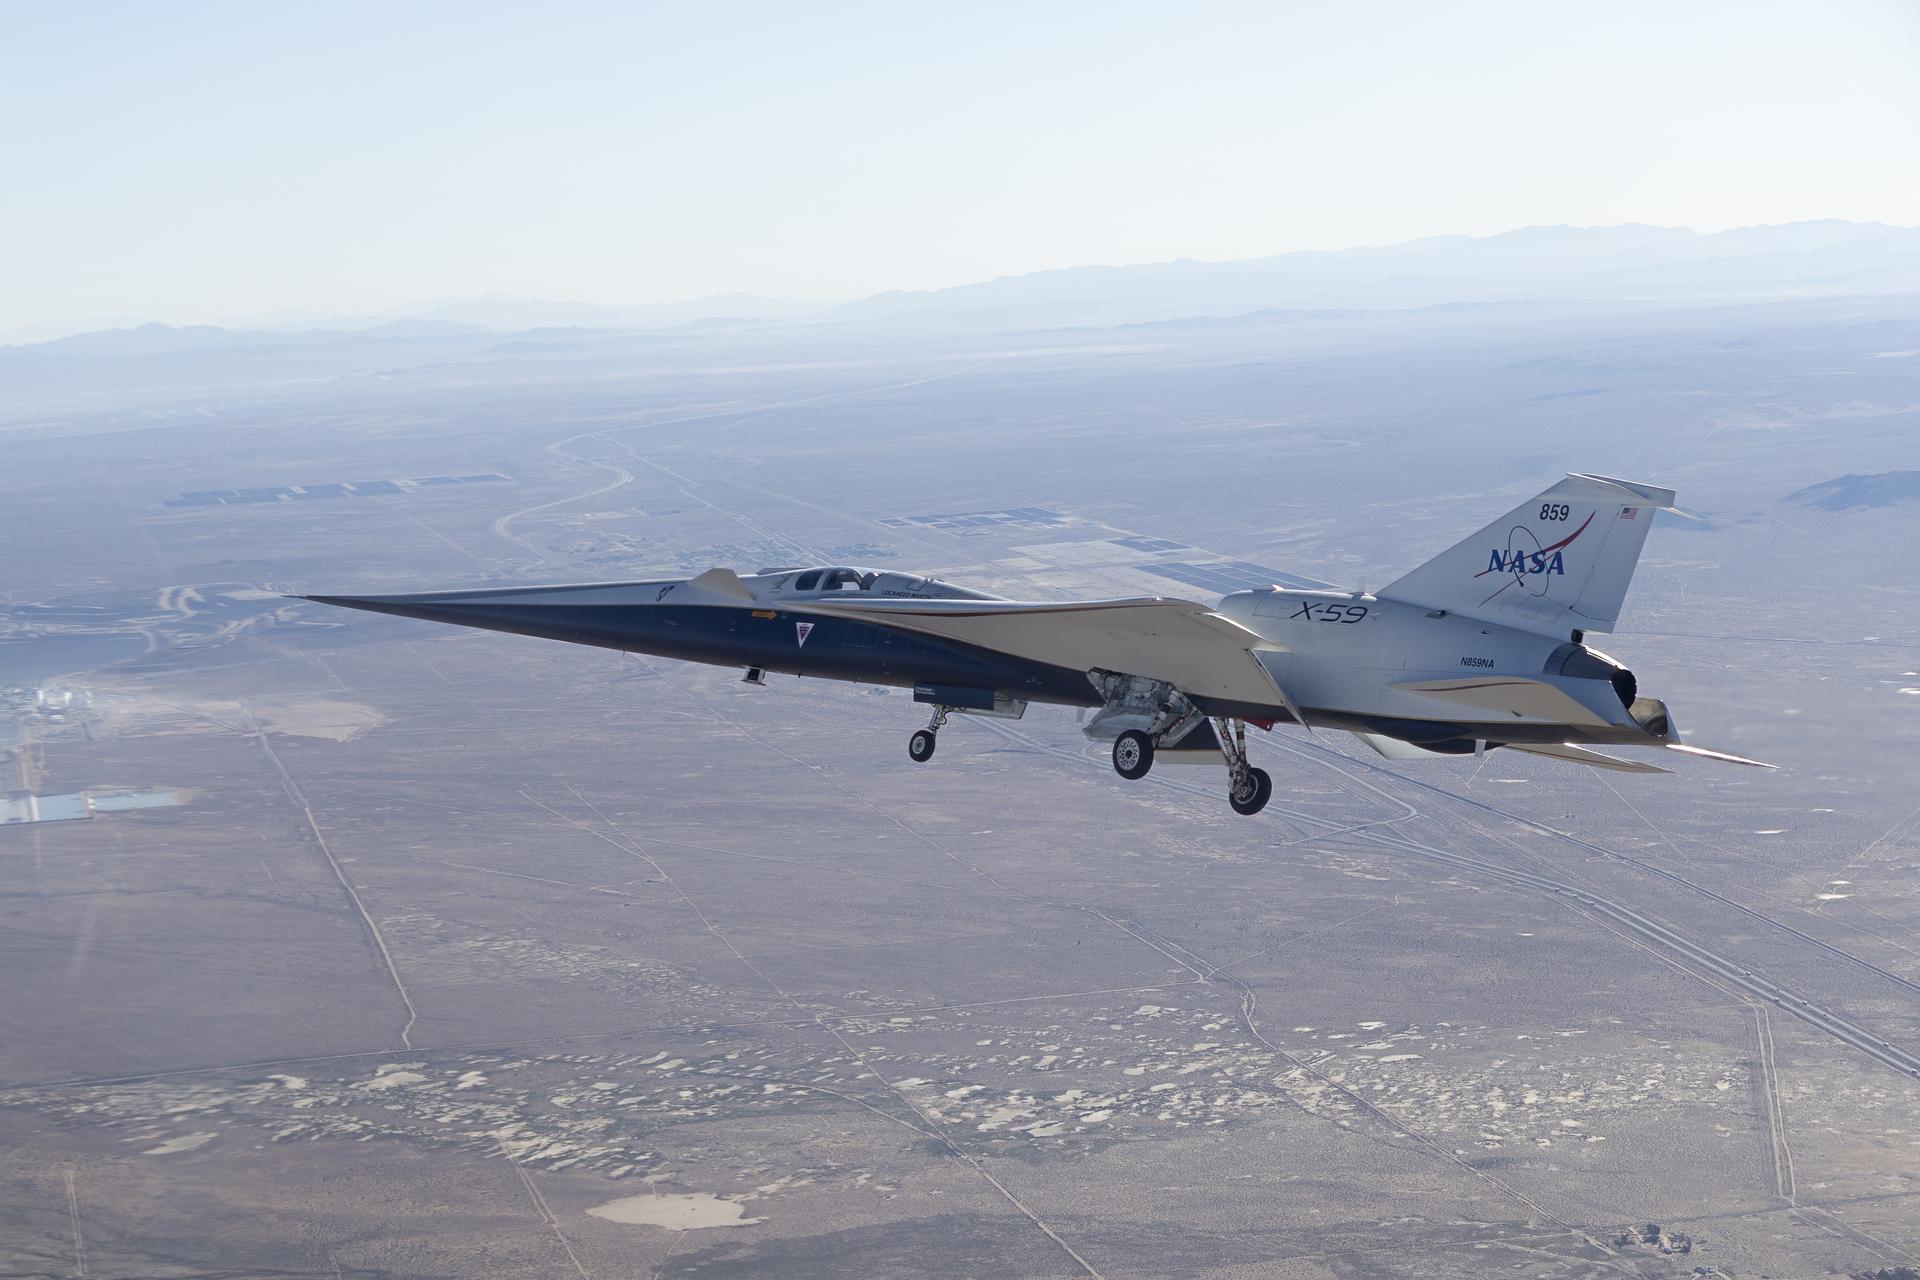
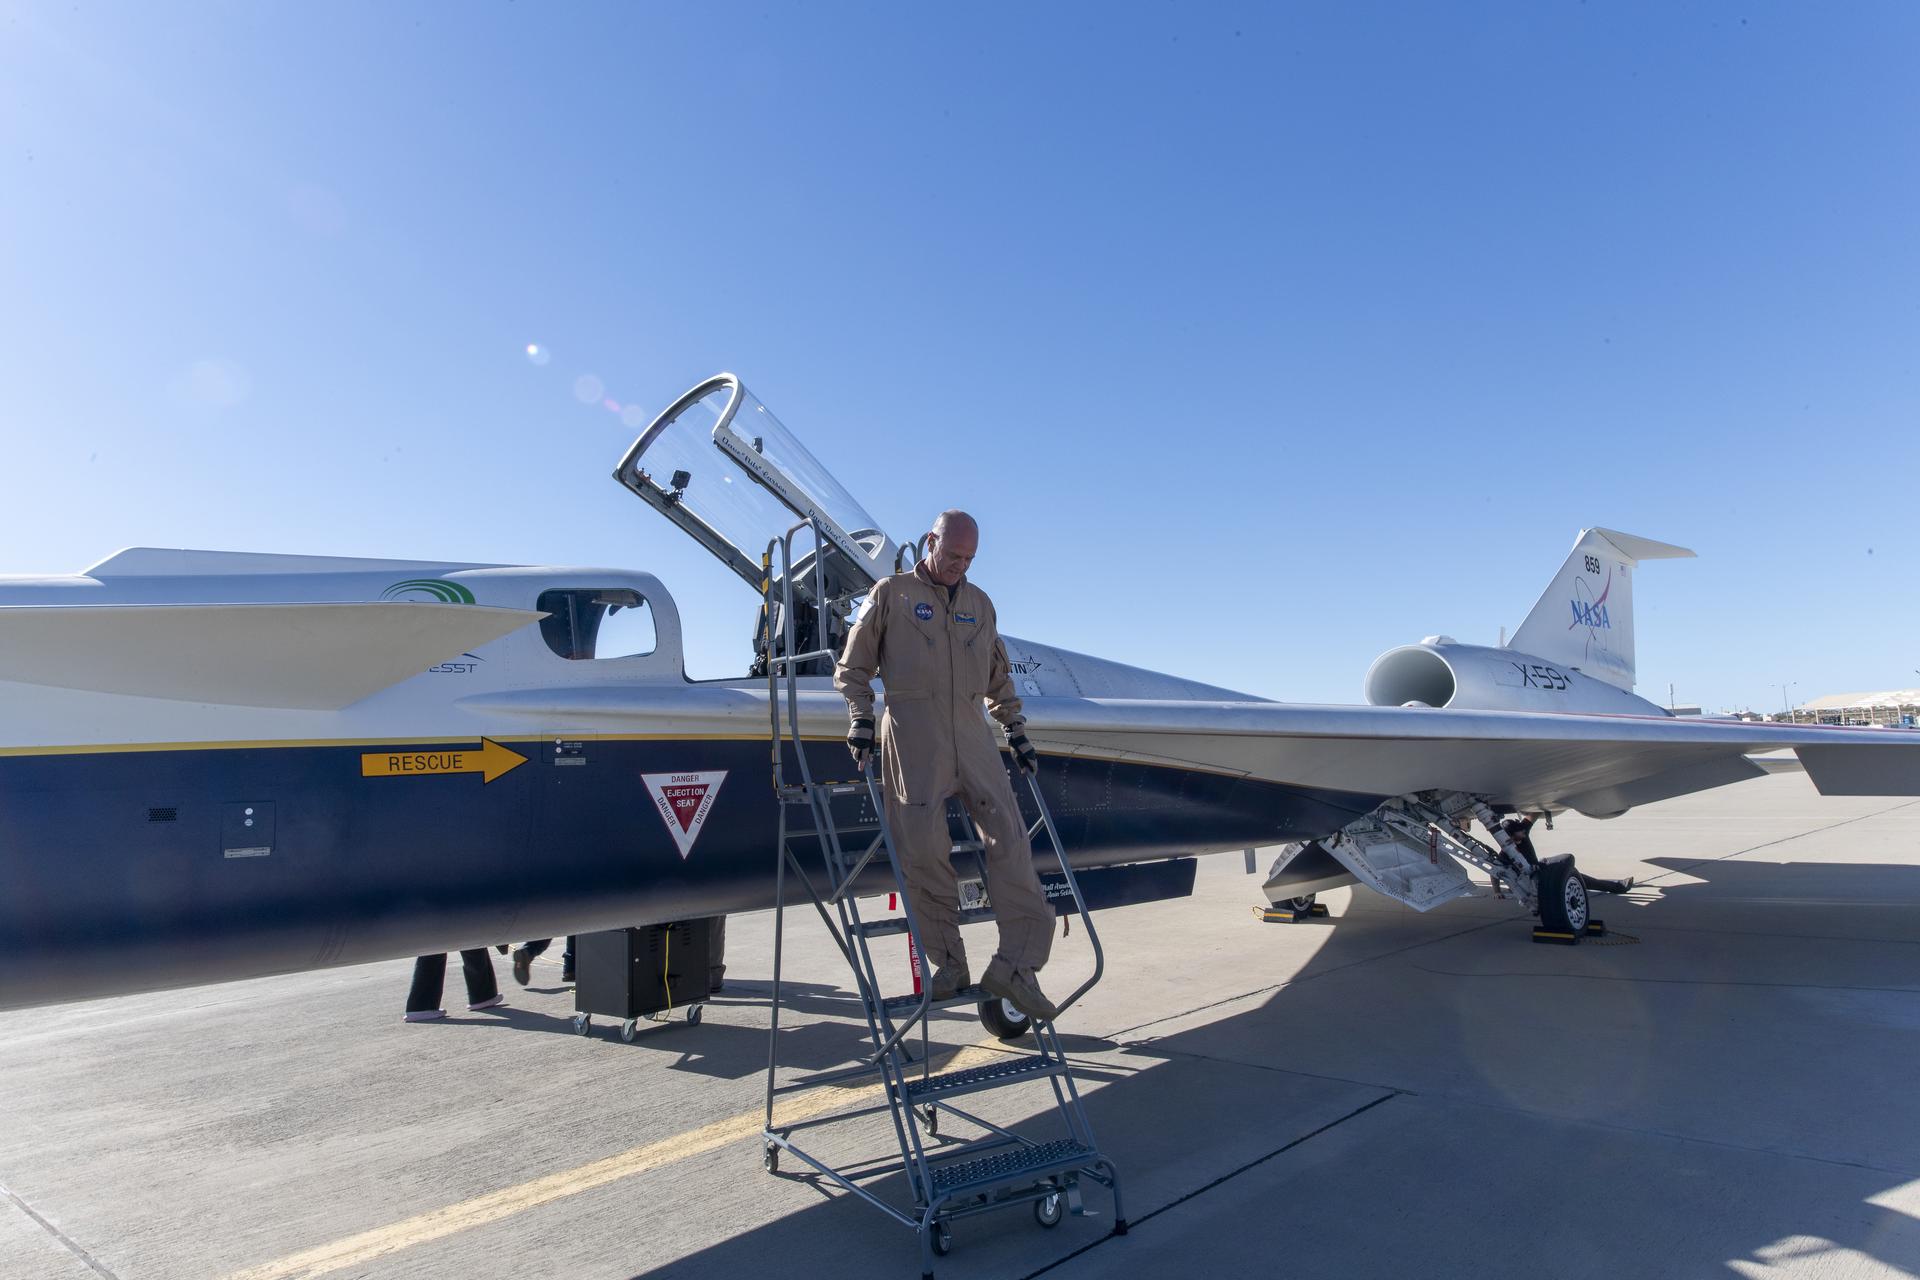
The X-59 is shown during its historic first flight flown by NASA test pilot Nils Larson.
NASA/Lori Losey
NASA’s X-59 quiet supersonic research aircraft took off for its historic first flight on Oct. 28 at 11:14 a.m. EDT from Lockheed Martin Skunk Works in Palmdale, California. The one-of-a-kind aircraft flew for 67 minutes before landing and taxiing to NASA’s Armstrong Flight Research Center in Edwards, California.
NASA test pilot Nils Larson flew the X-59 up to an altitude of about 12,000 feet and an approximate top speed of 230 mph, precisely as planned. The plane’s landing gear remained down during the entire flight, a common practice for experimental aircraft flying for the first time.
Now that the X-59’s first flight is in the books, the team is focused on preparing for a series of test flights where the aircraft will operate at higher altitudes and supersonic speeds. This test flight phase of NASA’s Quesst mission will ensure the X-59 meets performance and safety expectations.
Through the Quesst mission, NASA aims to usher in a new age of quiet supersonic flight, achieved through the unique design and technology of the X-59 in future supersonic transport aircraft.
Preparations for Next Moonwalk Simulations Underway (and Underwater)
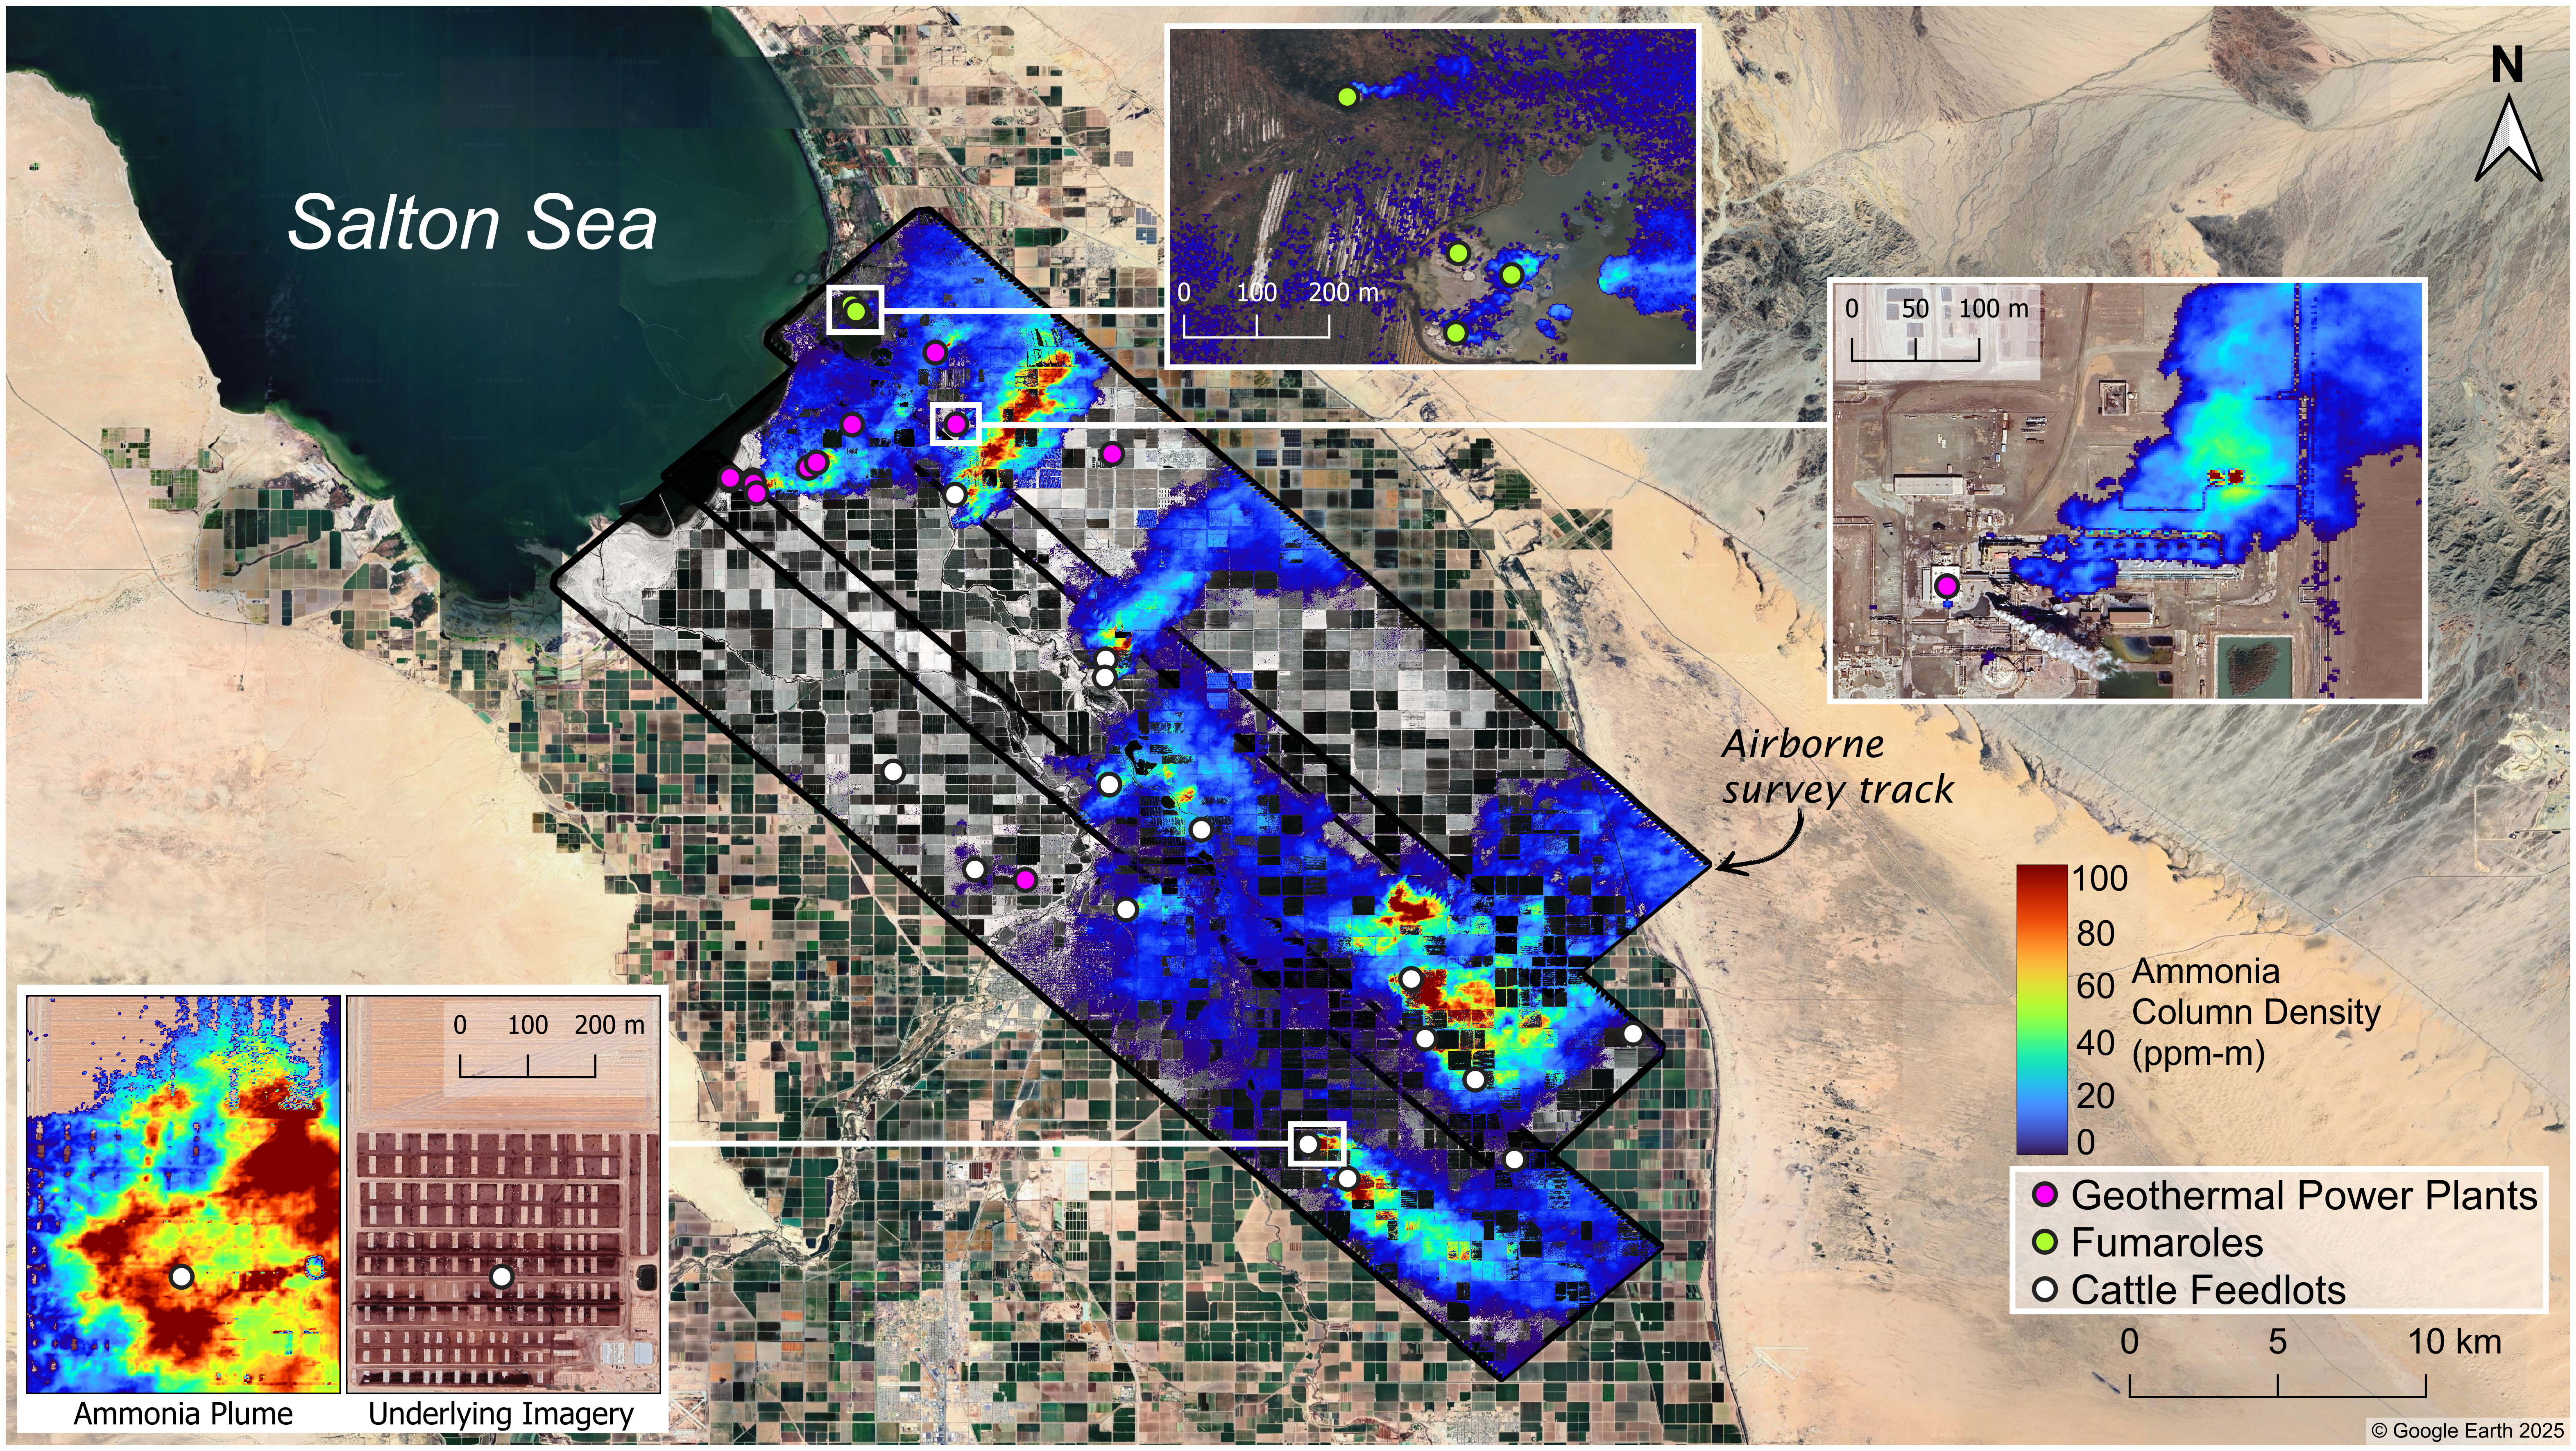
Researchers used data taken in March 2023 by an airborne imaging spectrometer to map ammonia emissions in the Imperial Valley. Produced by agricultural activities as well as geothermal processes, ammonia is a precursor to particulate matter, which can cause adverse health outcomes when inhaled.
NASA/JPL-Caltech
The pungent gas contributes to fine airborne particulate pollution, which endangers human health when inhaled and absorbed in the bloodstream.
A recent study led by scientists at NASA’s Jet Propulsion Laboratory in Southern California and the nonprofit Aerospace Corporation shows how high-resolution maps of ground-level ammonia plumes can be generated with airborne sensors, highlighting a way to better track the gas. A key chemical ingredient of fine particulate matter — tiny particles in the air known to be harmful when inhaled — ammonia can be released through agricultural activities such as livestock farming and geothermal power generation as well as natural geothermal processes. Because it’s not systematically monitored, many sources of the pungent gas go undetected.
Published in Atmospheric Chemistry and Physics in October, the study focuses on a series of 2023 research flights that covered the Imperial Valley to the southeast of the Salton Sea in inland Southern California, as well as the Eastern Coachella Valley to its northwest. Prior satellite-based research has identified the Imperial Valley as a prolific source of gaseous ammonia. In the study, scientists employed an airborne sensor capable of resolving ammonia plumes with enough detail to track their origins: Aerospace Corporation’s Mako instrument is an imaging spectrometer that observes long-wave infrared light emitted by areas of Earth’s surface and atmosphere 6 feet (2 meters) across.
Using the instrument, which can detect ammonia’s chemical signature by the infrared light it absorbs, the authors found elevated levels of the gas near several sources, including agricultural fields, livestock feedlots, geothermal plants, and geothermal vents. Measurements in parts of the Imperial Valley were 2½ to eight times higher than in Coachella Valley’s Mecca community, which had ammonia concentrations closer to background levels.
Though not toxic on its own in low concentrations, ammonia is a precursor to particulate matter, also known as aerosol or particle pollution. It reacts with other gases to form solid ammonium salt particles small enough to penetrate the bloodstream from the lungs. Particles under 2.5 micrometers in diameter — also known as PM2.5 — are associated with elevated rates of asthma, lung cancer, and cardiovascular disease, among other negative health outcomes.
“Historically, more attention has focused on primary sources of PM2.5, such as auto emissions. But with significant reductions in those emissions and increasingly stringent air quality standards, there is growing interest in understanding secondary sources that form particles in the air from precursor gases,” said Sina Hasheminassab, lead author of the paper and a research scientist at JPL. “As an important precursor to PM2.5, ammonia plays a key role, but its emissions are poorly characterized and undermonitored.”
Rising ammonia
Previous satellite-based studies have shown rising levels of atmospheric ammonia, both globally and in the continental United States. That research revealed broad trends, but with spatial resolution on the order of tens of miles, the measurements were only sufficient to identify variation over areas of hundreds of square miles or more.
The chemical behavior of ammonia also poses a particular monitoring challenge: Once emitted, it only stays in the atmosphere for hours before reacting with other compounds. In contrast, carbon dioxide can remain in the air for centuries.
Planes and satellites can provide an overview of sources and the geographic distribution of emissions at a given moment. Although satellites offer wider and more recurrent coverage, airborne instruments, being closer to the source, produce higher-resolution data and can focus on specific locations at designated times.
Those proved to be the right capabilities for the recent study. Researchers flew Mako over the Imperial and Eastern Coachella valleys on the mornings and afternoons of March 28 and Sept. 25, 2023, and took concurrent measurements on the ground with both a fixed monitoring station in Mecca operated by the South Coast Air Quality Management District (AQMD) and a mobile spectrometer developed at the University of California, Riverside.
“The goal was to show that this technique was capable of delivering data with the required accuracy that aerosol scientists and potentially even air quality regulatory bodies could use to improve the air quality in those regions,” said David Tratt, a senior scientist at Aerospace Corporation and coauthor of the paper. “We ended up with maps that identify multiple sources of ammonia, and we were able to track the plumes from their sources and observe them coalescing into larger clouds.”
Distinct plumes
During the flights, the team collected data over the southeastern coast of the Salton Sea, which straddles Riverside and Imperial counties. There, Mako revealed small plumes coming from geothermal fumaroles venting superheated water and steam that react with nitrogen-bearing compounds in the soil, releasing ammonia.
Farther to the southeast, the results showed several geothermal power plants emitting ammonia, primarily from their cooling towers, as part of their normal operations.
Farther southeast still, the researchers spotted ammonia emissions, a byproduct of animal waste, from cattle farms in the Imperial Valley. During the March 28 flight, a plume from the largest facility in the study area measured up to 1.7 miles (2.8 kilometers) wide and extended up to 4.8 miles (7.7 kilometers) downwind of the source.
‘Very large puzzle’
As part of the study, AQMD’s Mecca monitoring station recorded seasonal changes in ammonia concentrations. Given the few sources in the area, the researchers surmised that winds during certain months tend to blow the gas from Imperial Valley to the Coachella Valley.
The study underscores the benefits of detailed spatial information about ammonia emissions, and it partly informed the agency’s decision in July to expand its ammonia-monitoring network and extend the life of the Mecca station.
As a precursor to PM2.5, ammonia is “one piece of a very large puzzle” that, for Coachella Valley residents, includes vehicle emissions, desert dust, and agricultural activities, said Payam Pakbin, manager of the Advanced Monitoring Technologies Unit at AQMD and a paper coauthor.
“These communities want to know the contributions of these sources to the air quality they’re experiencing,” he added. “Findings like these help our agency better prioritize which sources require the most attention and ultimately guide our focus toward those that are the highest priority for achieving emission reductions in this community.”
NASA astronaut Jonny Kim poses for a portrait with the American flag inside the International Space Station’s “window to the world,” the cupola.
NASA
In 2025, NASA and its international partners celebrate 25 years of continuous human presence aboard the International Space Station. Since November 2, 2000, more than 290 people from 26 countries have lived and worked aboard the orbiting laboratory, conducting thousands of experiments that have advanced science and technology on Earth and paved the way for Artemis missions to the Moon and future journeys to Mars.
Beyond its role as a science platform, the station has been a bridge—connecting cultures, sparking creativity, and inspiring generations. The memories of Johnson Space Center employees reflect how the orbiting laboratory is not only an engineering marvel but also a deeply human endeavor.
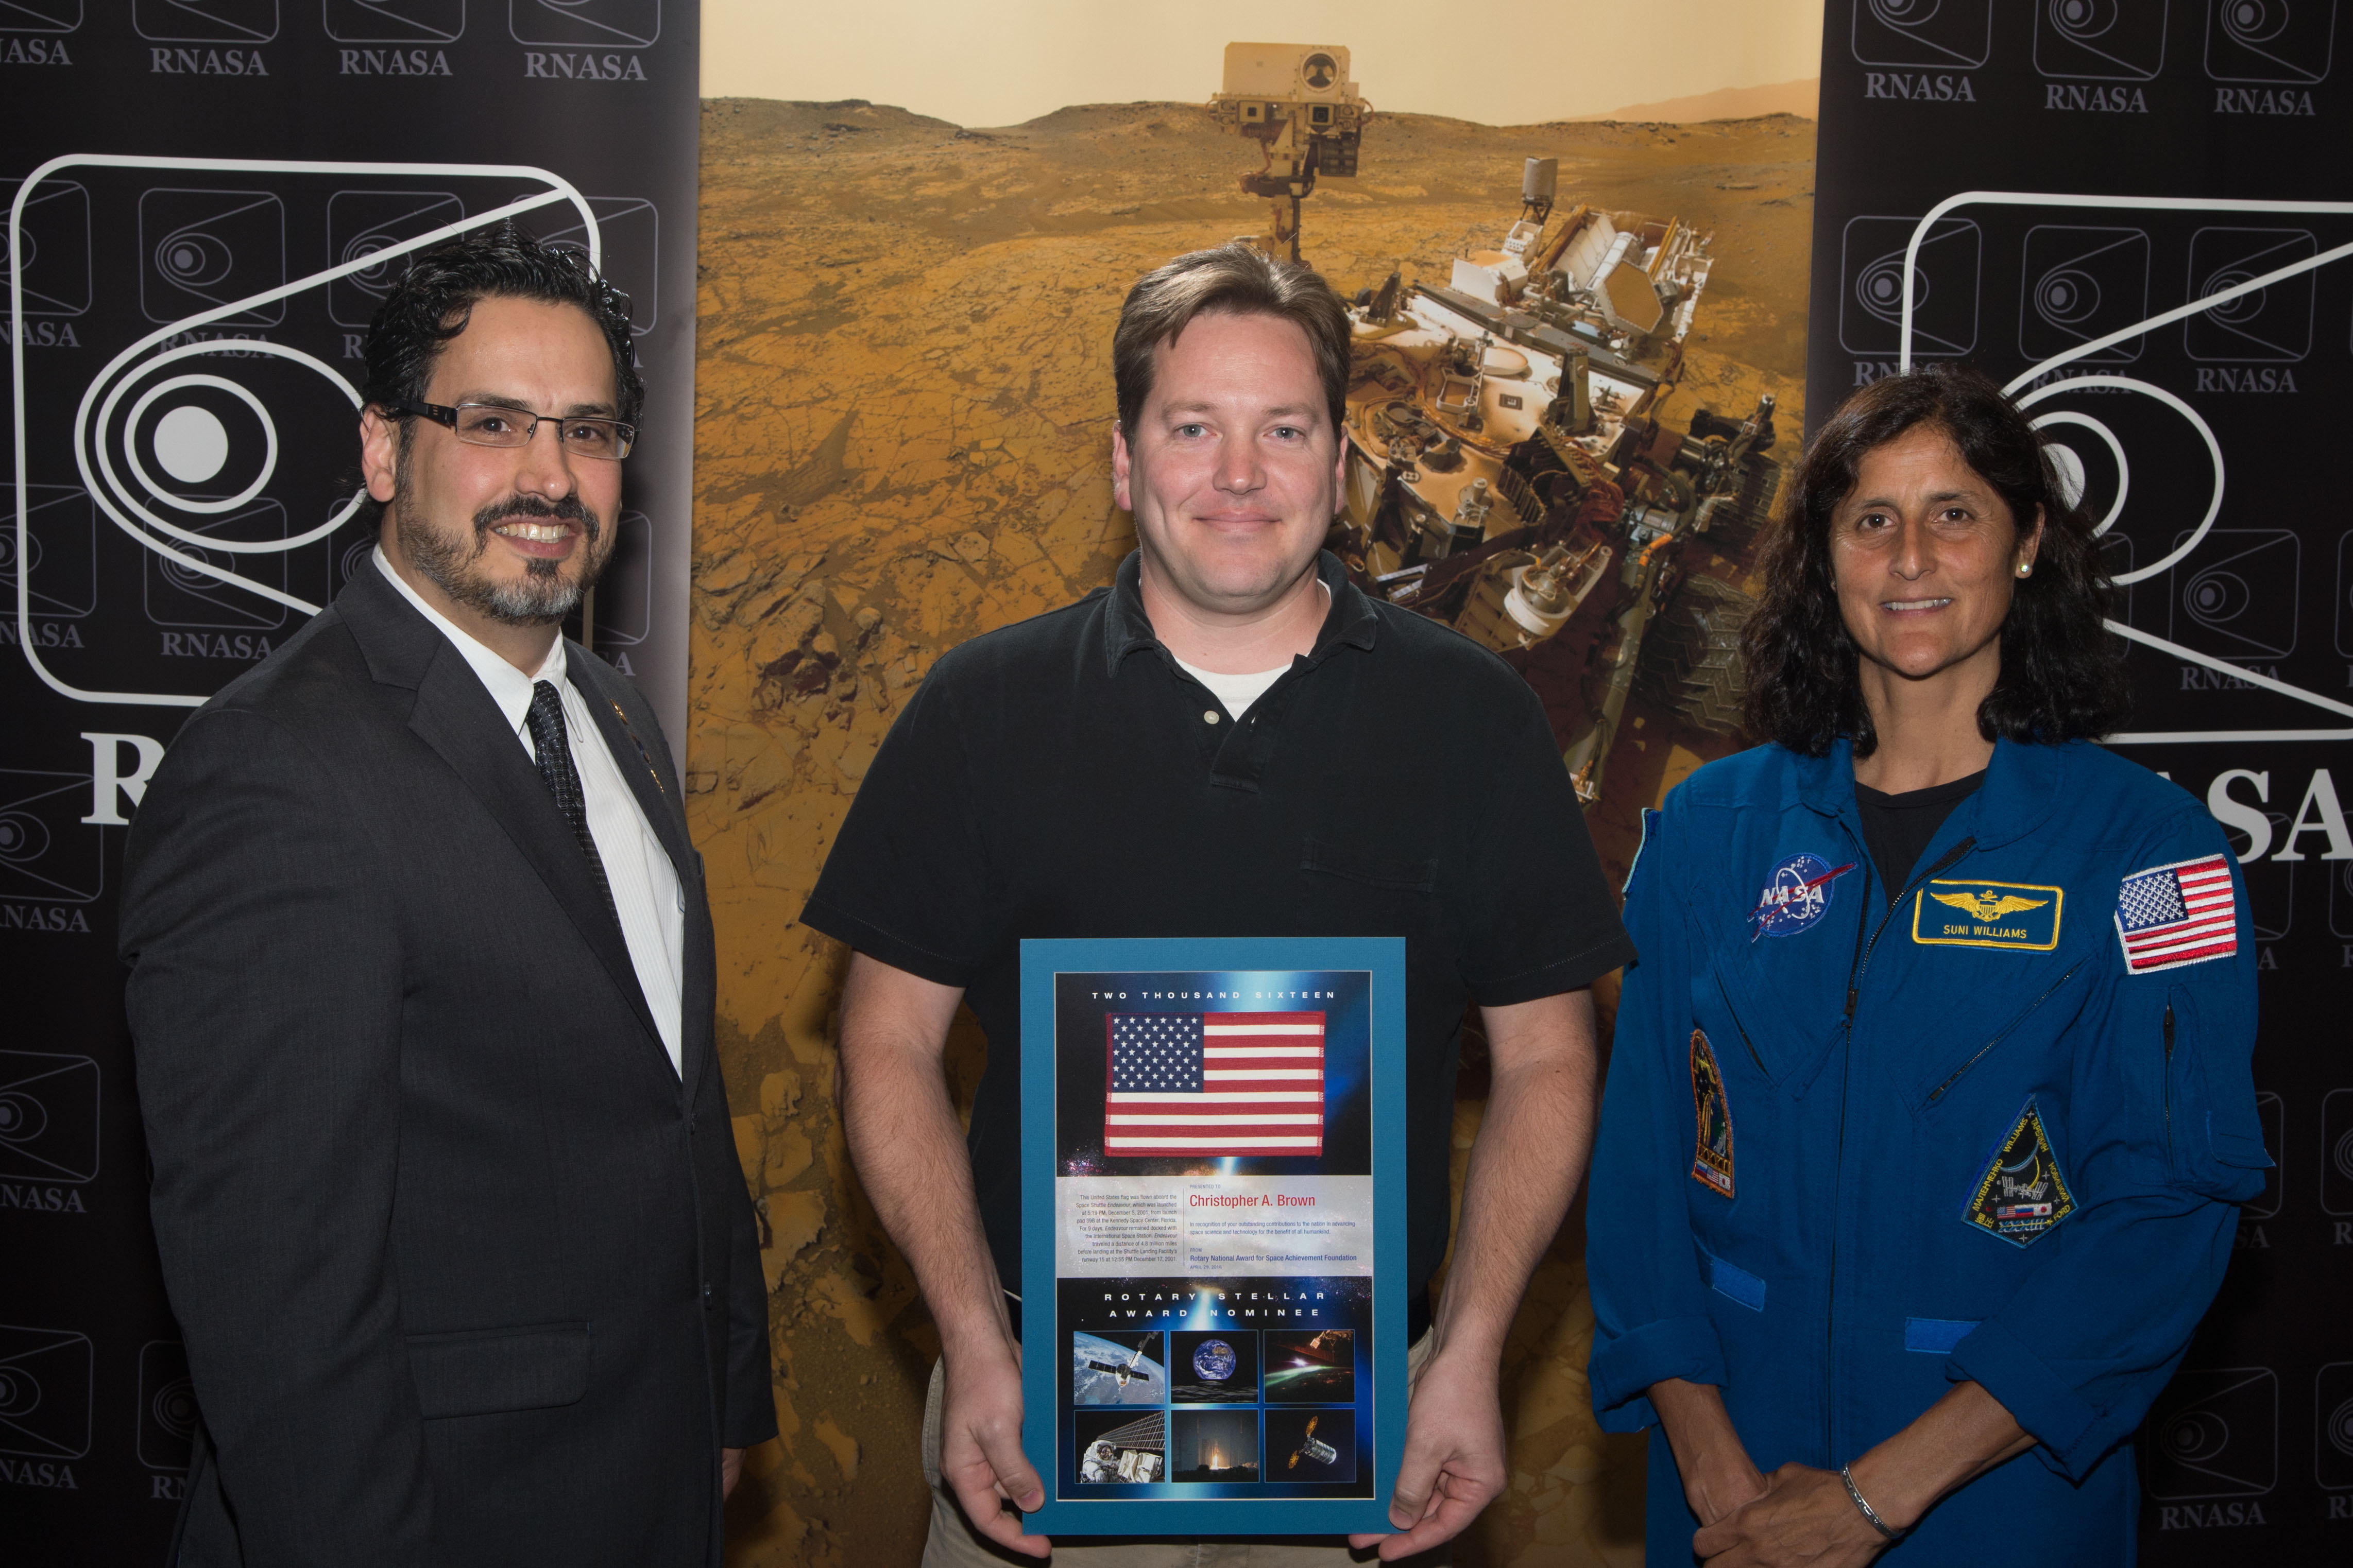
Christopher Brown – Advancing Life Support Systems for Future Exploration
Christopher Brown (center) receives the Rotary National Award for Space Achievement alongside NASA astronaut Sunita Williams.
NASA/James Blair
As a space station Environmental Control and Life Support System (ECLSS) integrator, Christopher Brown’s role has been ensuring astronauts have clean air and water. ECLSS removes carbon dioxide from the air, supplies oxygen for breathing, and recycles wastewater—turning yesterday’s coffee into tomorrow’s coffee. Today, these systems can recover nearly 98% of the water brought to the station.
His proudest memory was commissioning regenerative life support systems and raising a symbolic toast with the crew while on console in mission control. He also helped activate the Water Storage System, saving crew time and improving operations on station. For Brown, these milestones were vital steps toward future long-duration missions beyond Earth.
Stephanie Sipila – The Heart of Microgravity Research
NASA astronaut Kate Rubins works on the Cardinal Heart study, which seeks to help scientists understand the aging and weakening of heart muscles in the search for new treatments for astronauts and people on Earth.
NASA/Mike Hopkins
Stephanie Sipila, now integration manager for NASA’s Extravehicular Activity and Human Surface Mobility Program, began her career as a mechanical and robotic systems instructor for the orbital outpost. Her favorite experiment, Engineered Heart Tissues, studies microgravity’s effect on the human heart to help develop new treatments for cardiovascular disease. She recalls NASA astronaut Sunita Williams running the Boston Marathon on a treadmill aboard station, becoming the first person to complete the race in space and showing how astronauts stay connected to Earth while living on orbit.
Sipila also highlights the Spacesuit Art Project, an initiative that turned artwork from children with cancer into spacesuits flown to and worn aboard the orbital outpost during live downlinks, connecting science, art, and hope — and raising awareness of cancer research conducted aboard the orbital outpost.
Liz Warren – Where Exploration Meets Humanity
NASA astronaut Jack Fischer wearing the Unity spacesuit painted by patients at MD Anderson Cancer Center in Houston.
NASA/Randy Bresnik
Space station Associate Chief Scientist Liz Warren has seen firsthand how the Spacesuit Art Project uplifted children on Earth. During Expedition 52, she watched astronaut Jack Fischer wear a suit covered in artwork created by young cancer patients, including his own daughter, a survivor. “It was incredibly touching to note the power of art and inspiration. Human spaceflight requires fortitude, resilience, and teamwork—so does fighting childhood cancer,” Warren said.
Her memories also extend to her time as an operations lead for NASA’s Human Research Program, which uses research to develop methods to protect the health and performance of astronauts in space to prepare for long-duration missions. While out for a weekend run, Warren received a call from the Payload Operations and Integration Center in Huntsville, Alabama. An astronaut on station, following a prescribed diet for a research study, wanted to swap out a food item. Warren coordinated with her support team and relayed the decision back to orbit—all while continuing her run. The moment, she recalls, underscored the constant, real-time connection between astronauts in space and teams on the ground.
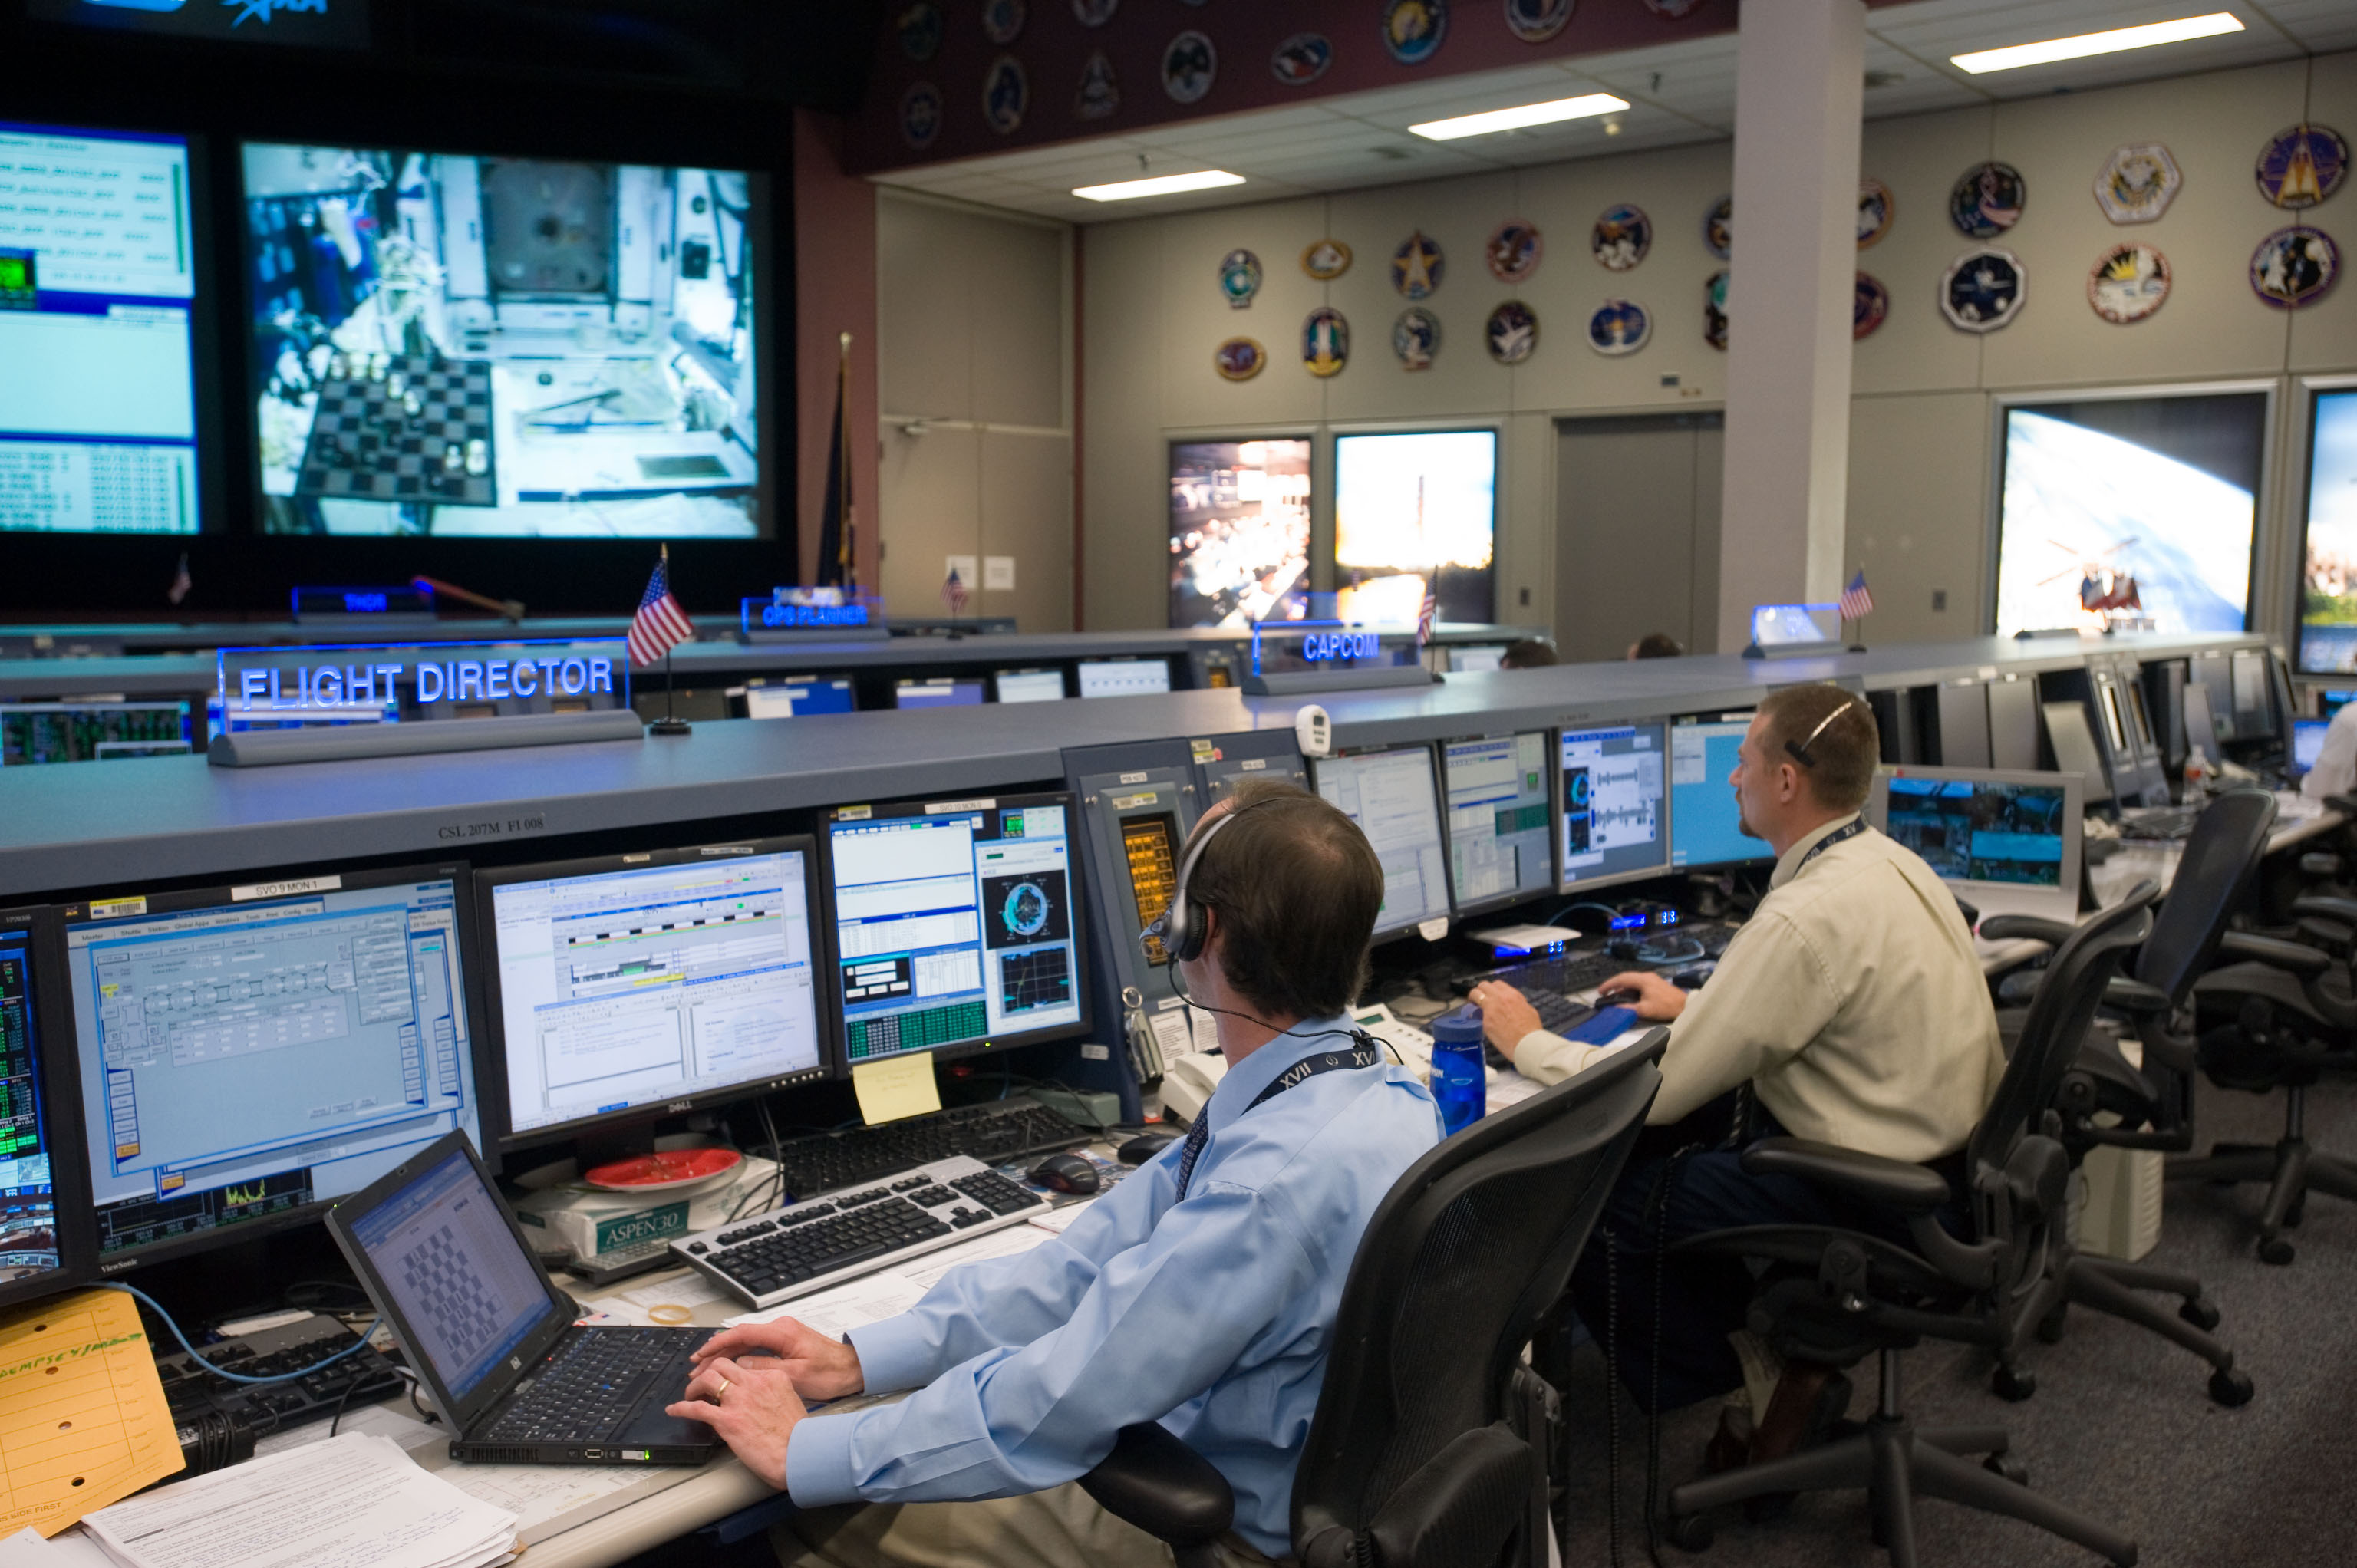
Adam Baker – Checkmate: Space Debris Cleanup
Flight Director Chris Edelen, left, and capsule communicator Jay Marschke discuss their next chess move during a match with NASA astronaut Greg Chamitoff, Expedition 17 flight engineer aboard the space station.
NASA/Robert Markowitz
As an aerospace engineer, Adam Baker helped track experiments and spacecraft operations from mission control. Baker remembers when mission control played a live chess match with astronaut Greg Chamitoff during Expedition 17, a moment that showed the unique ways the station connects crews in orbit with people on Earth. His favorite technical project, though, was the RemoveDebris small satellite, deployed from the station in 2018 to test technologies for cleaning up space junk. “Knowing these experiments could one day help keep the orbital environment safe made it even more meaningful,” he said.
Michael McFarlane – Training for Success
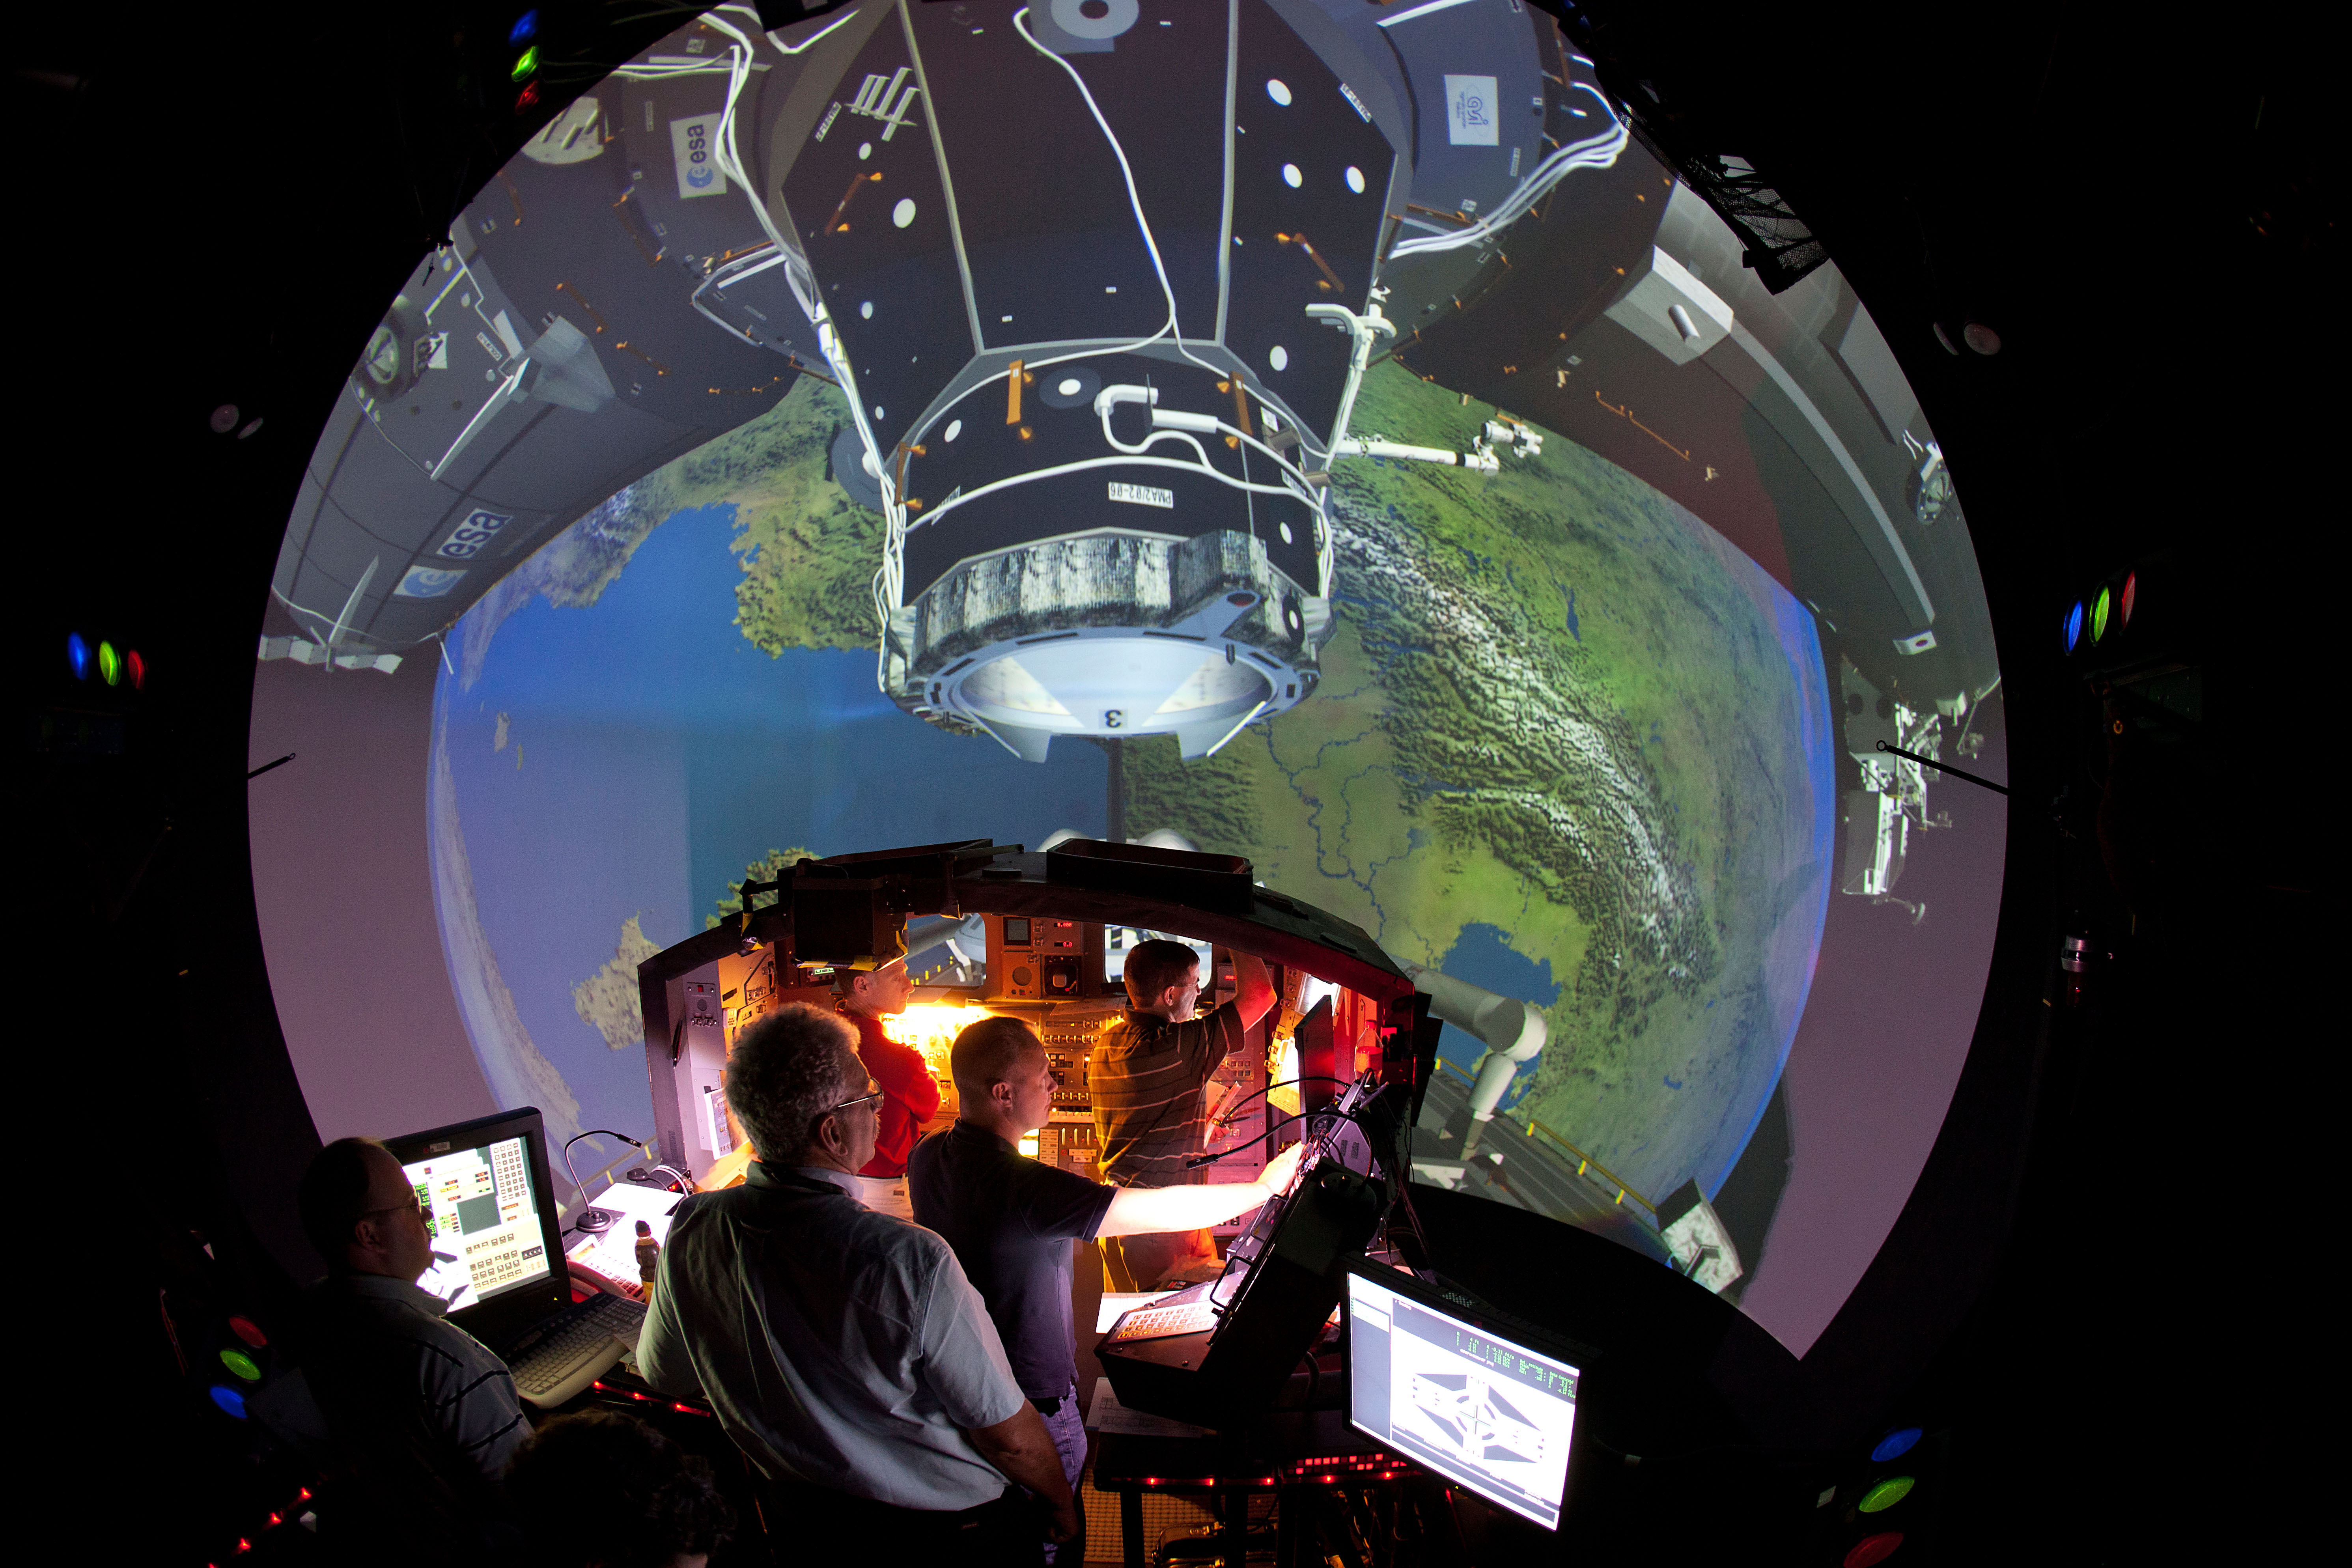
Engineers run simulations inside Johnson’s Systems Engineering Simulator during a shuttle-to-station docking simulation.
Smiley Pool/Houston Chronicle
As chief of the Simulation and Graphics Branch, Michael McFarlane prepared astronauts for space station assembly missions using high-fidelity simulators. “My greatest memory is seeing the station grow as we successfully executed assembly missions that looked very much like what we analyzed and trained for in our ground-based simulations,” he said.
A Legacy of Ingenuity and Community
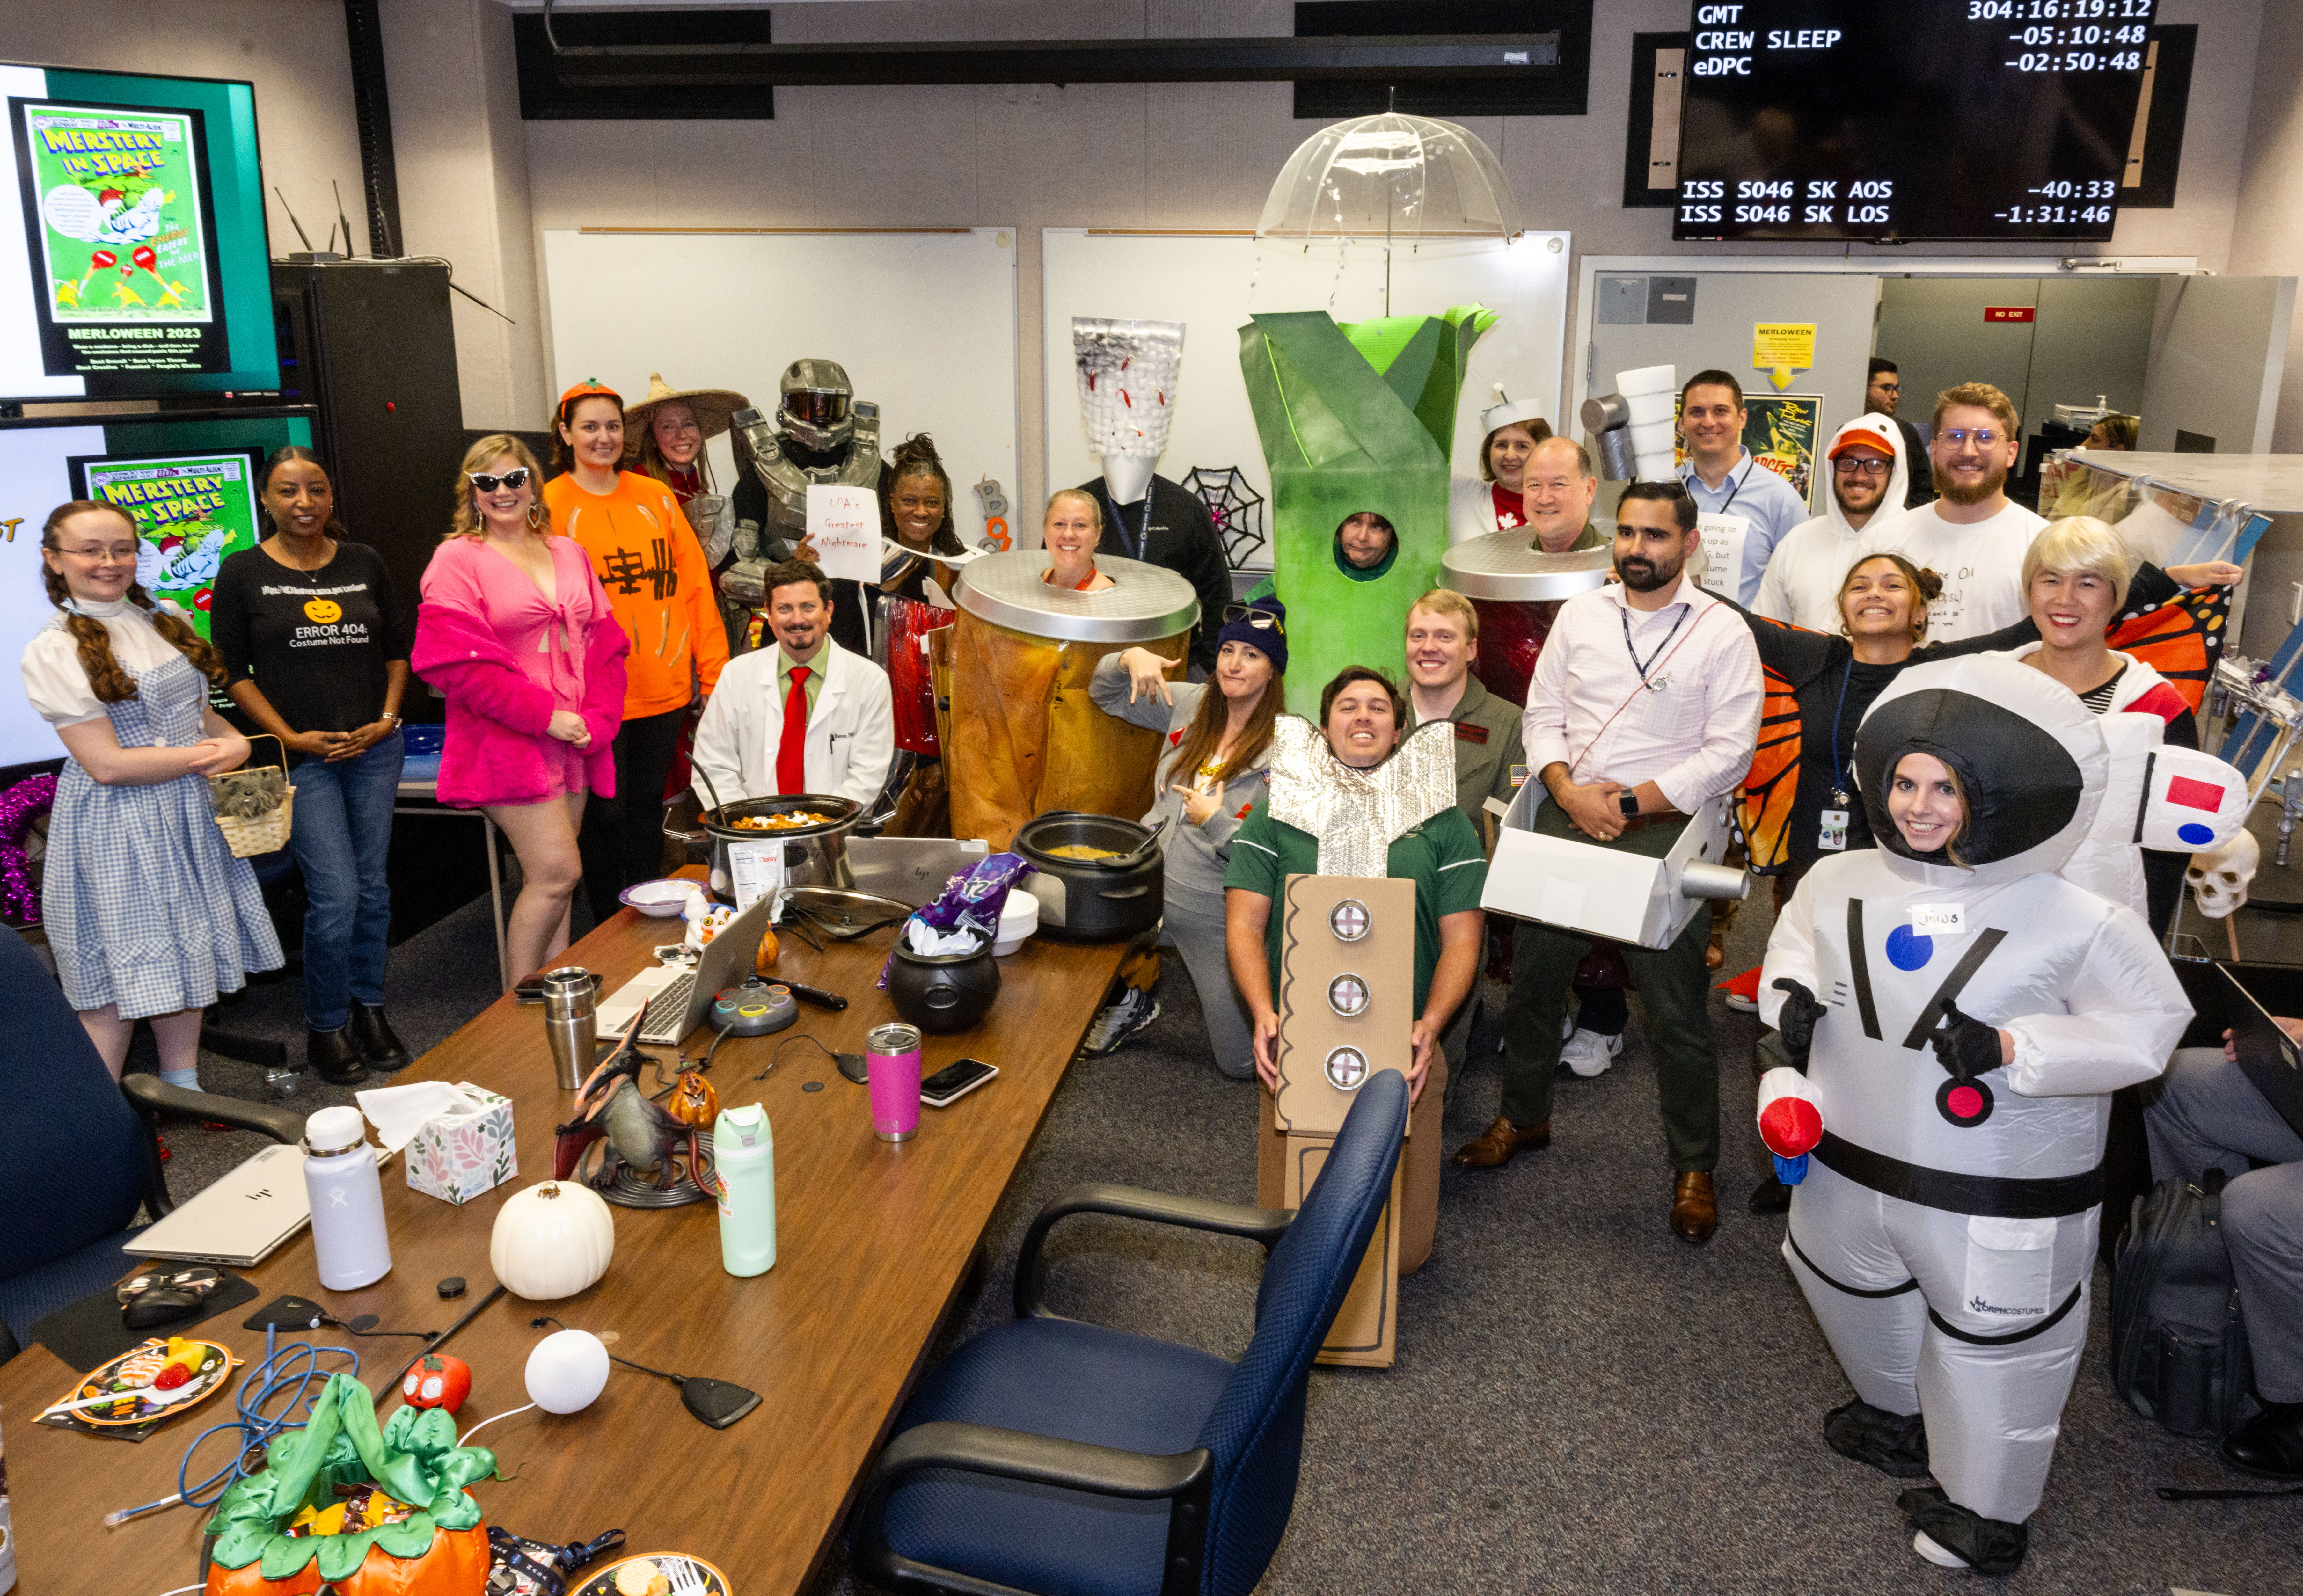
Date: 10-31-2023 Location: Bldg 30 MCC, ISS MER Subject: Mission Evaluation Room (MER) Halloween Celebration “MERloween” Photographer: James Blair
NASA/James Blair
In the Mission Evaluation Room, engineers not only troubleshoot in real time but also celebrate milestones with traditions like “MERloween,” where controllers dress in space-themed costumes to honor the year’s lessons learned.
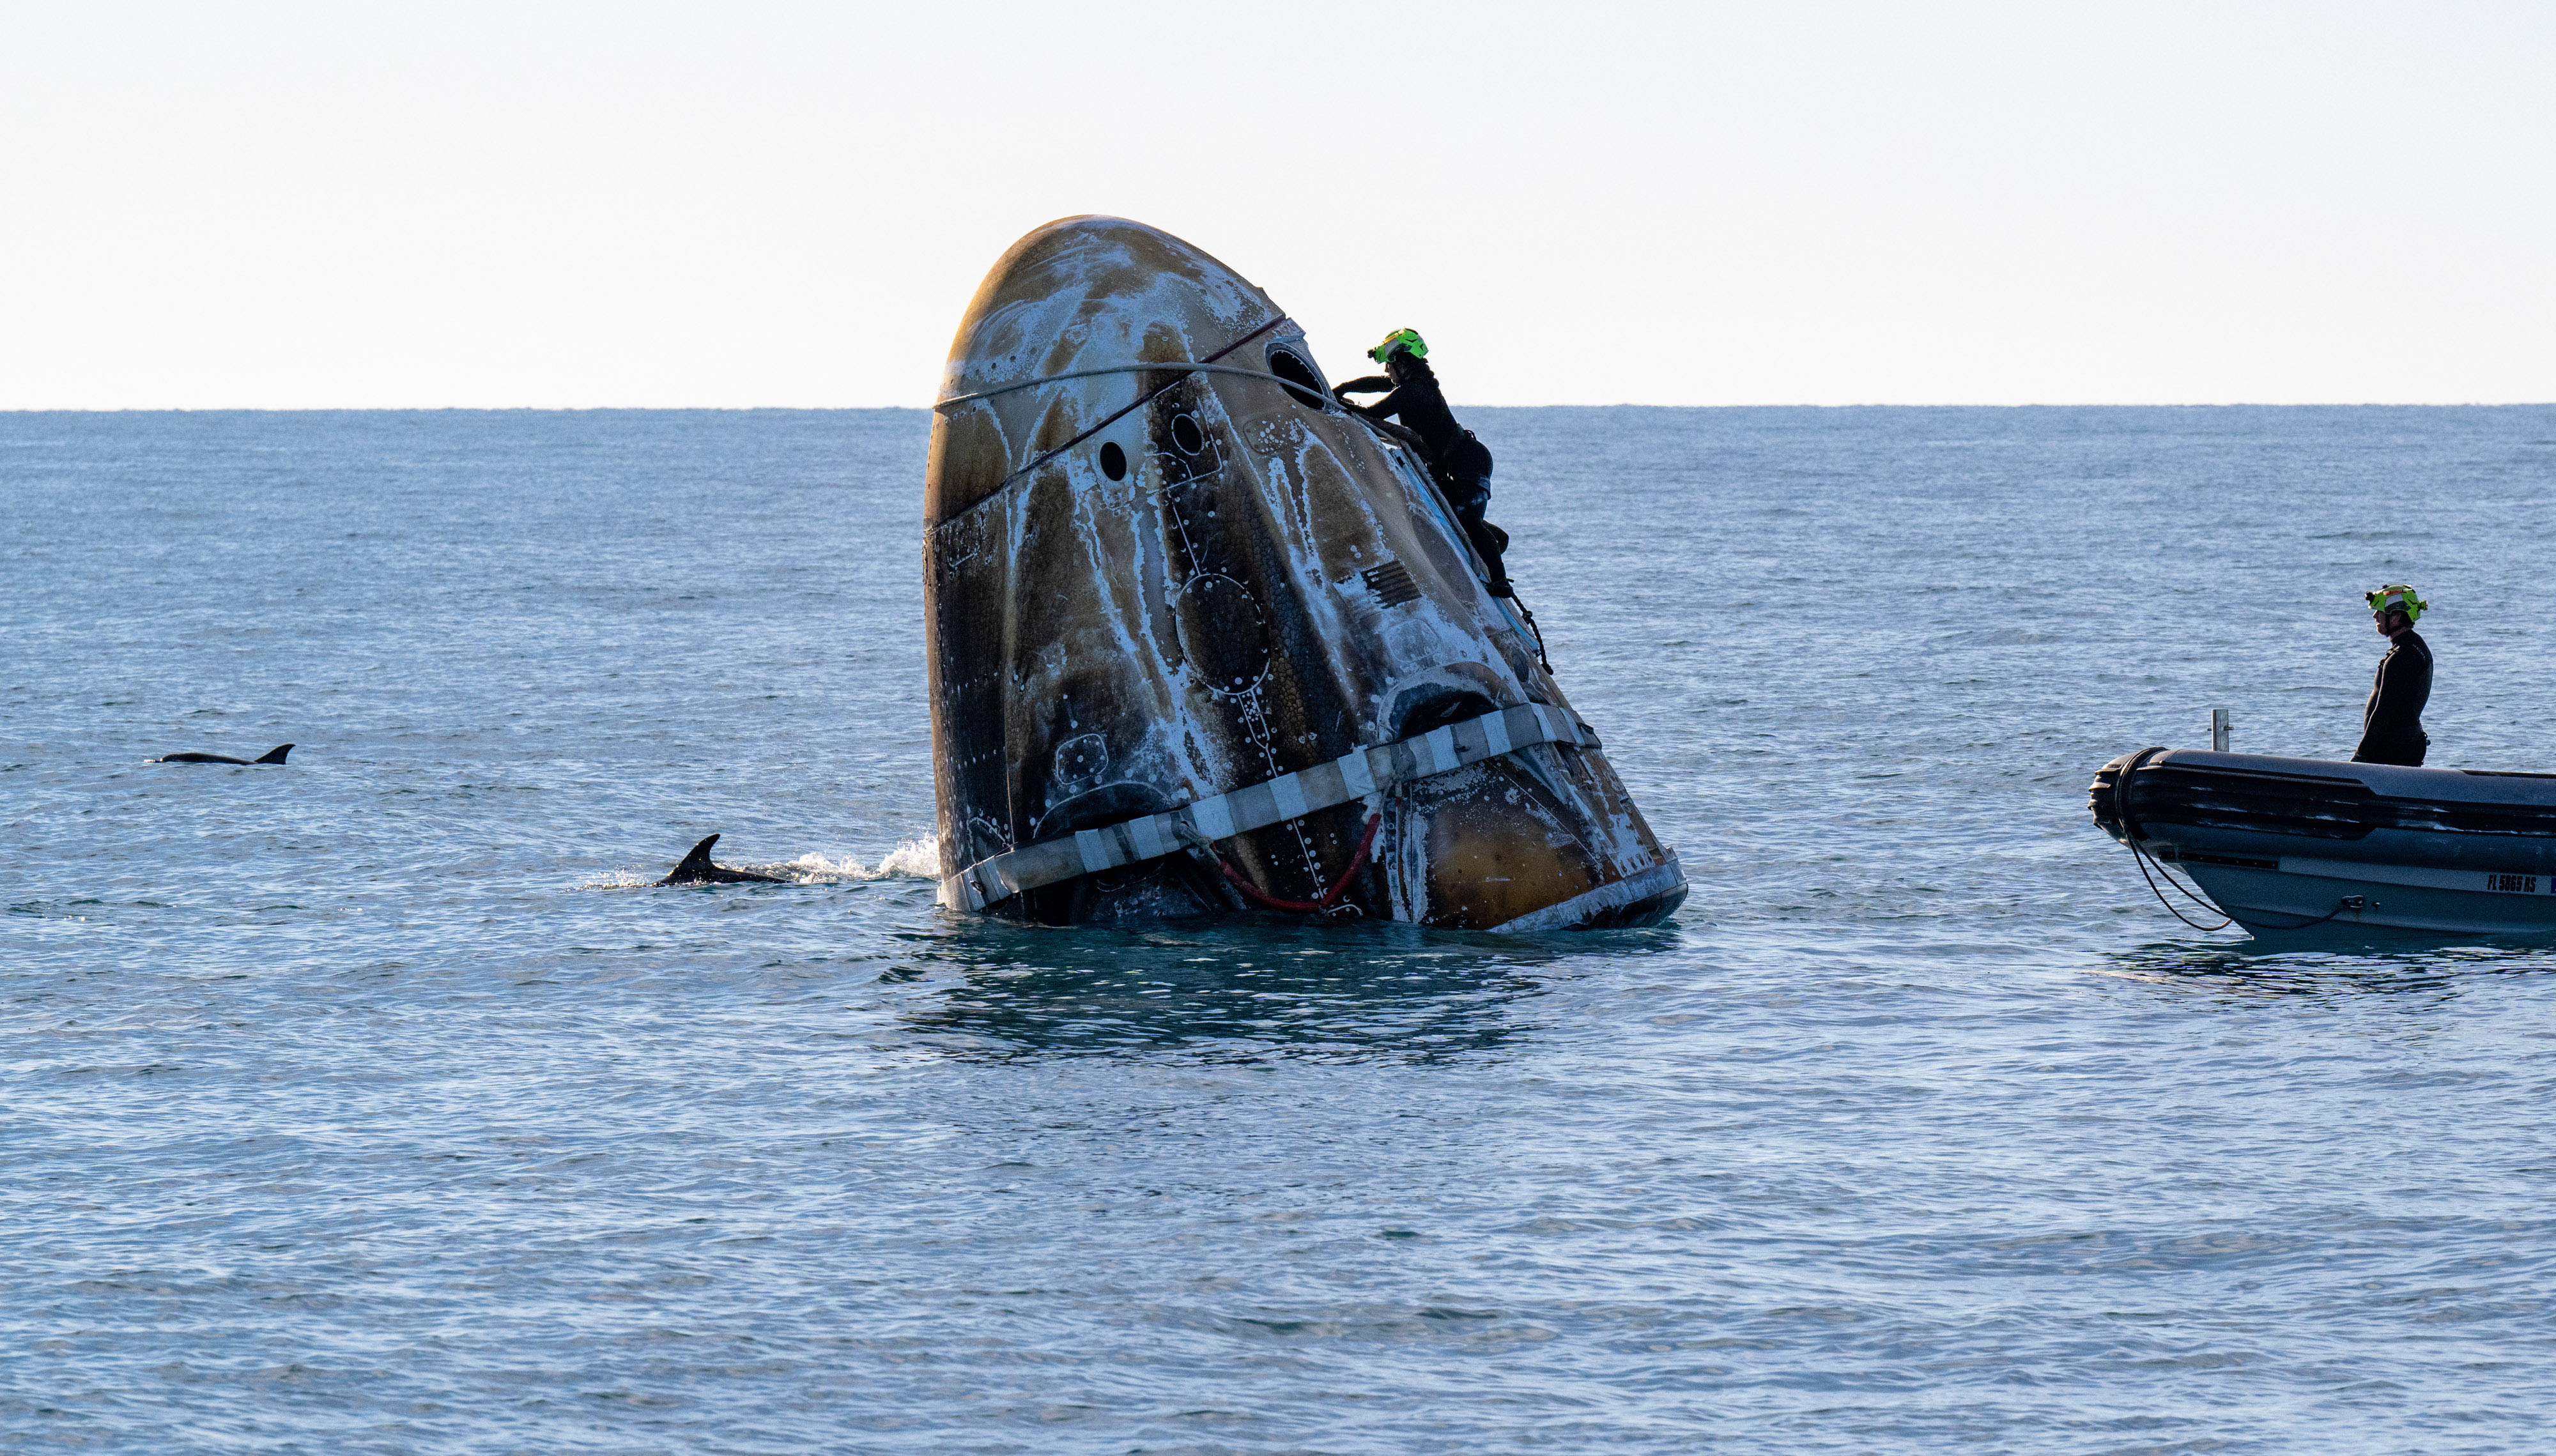
NASA’s SpaceX Dragon Freedom spacecraft splashed down in the Gulf of America, off the coast of Tallahassee, Florida, returning Crew-9 to Earth on March 18, 2025.
NASA/Keegan Barber
For social media consultant Mark Garcia, sharing the station story with the public has been the highlight of his career. His favorite moment was watching NASA’s SpaceX Crew-9 splash down in 2025, greeted by dolphins in the Gulf of America. “I love writing about the science aboard the station that benefits people on Earth,” he said.
For 25 years, the International Space Station has shown what humanity can accomplish together. The lessons learned aboard will guide Artemis missions to the Moon and future journeys to Mars—ensuring the next 25 years are built on innovation, resilience, and the human spirit.
Preparations for Next Moonwalk Simulations Underway (and Underwater)
After years of design, development, and testing, NASA’s X-59 quiet supersonic research aircraft took to the skies for the first time Oct. 28, marking a historic moment for the field of aeronautics research and the agency’s Quesst mission.
The X-59, designed to fly at supersonic speeds and reduce the sound of loud sonic booms to quieter sonic thumps, took off at 11:14 a.m. EDT and flew for 67 minutes. The flight represents a major step toward quiet supersonic flight over land.
“Once again, NASA and America are leading the way for the future of flight,” said acting NASA Administrator Sean Duffy. “The X-59 is the first of its kind, and a major breakthrough in America’s push toward commercial air travel that’s both quiet and faster than ever before. Thanks to the X-59 team’s innovation and hard work, we’re revolutionizing air travel. This machine is a prime example of the kind of ingenuity and dedication America produces.”
Following a short taxi from contractor Lockheed Martin’s Skunk Works facility, NASA X-59 test pilot Nils Larson approached U.S. Air Force Plant 42’s runway in Palmdale, California, where he completed final system checks and called the tower for clearance.
NASA’s X-59 quiet supersonic research aircraft cruises above Palmdale and Edwards, California, during its first flight, Tuesday, Oct. 28, 2025. The aircraft traveled to NASA’s Armstrong Flight Research Center in Edwards, California.
NASA/Lori Losey
Then, with a deep breath, steady hands, and confidence in the labor of the X-59’s team, Larson advanced his throttle, picking up speed and beginning his climb – joining the few who have taken off in an experimental aircraft for the first time.
“All the training, all the planning that you’ve done prepares you,” Larson said. “And there is a time when you realize the weight of the moment. But then the mission takes over. The checklist starts. And it’s almost like you don’t even realize until it’s all over – it’s done.”
The X-59’s first flight went as planned, with the aircraft operating slower than the speed of sound at 230 mph and a maximum altitude of about 12,000 feet, conditions that allowed the team to conduct in-flight system and performance checks. As is typical for an experimental aircraft’s first flight, landing gear was kept down the entire time while the team focused on ensuring the aircraft’s airworthiness and safety.
The aircraft traveled north to Edwards Air Force Base, circled before landing, and taxied to its new home at NASA’s Armstrong Flight Research Center in Edwards, California, officially marking the transition from ground testing to flight operations.
“In this industry, there’s nothing like a first flight,” said Brad Flick, center director of NASA Armstrong. “But there’s no recipe for how to fly an X-plane. You’ve got to figure it out, and adapt, and do the right thing, and make the right decisions.”
NASA’s X-59 quiet supersonic research aircraft flies above Palmdale and Edwards, California, on its first flight Tuesday, Oct. 28, 2025. The aircraft traveled to NASA’s Armstrong Flight Research Center in Edwards, California, where it will begin flight testing for NASA’s Quesst mission, which aims to demonstrate quiet supersonic flight over land.
NASA/Jim Ross
Historic flight
The X-59 is the centerpiece of NASA’s Quesst mission and its first flight connects with the agency’s roots of flying bold, experimental aircraft.
“The X-59 is the first major, piloted X-plane NASA has built and flown in over 20 years – a unique, purpose-built aircraft,” said Bob Pearce, NASA associate administrator for the Aeronautics Research Mission Directorate. “This aircraft represents a validation of what NASA Aeronautics exists to do, which is to envision the future of flight and deliver it in ways that serve U.S. aviation and the public.”
NASA Armstrong has a long history of flying X-planes that pushed the edges of flight. In 1947, the X-1 broke the sound barrier. More than a decade later, the X-15 pushed speed and altitude to new extremes. Starting in the 1960s, the X-24 shaped how we understand re-entry from space, and in the 1980s the X-29 tested forward-swept wings that challenged aerodynamic limits.
Each of those aircraft helped answer a question about aeronautics. The X-59 continues that tradition with a mission focused on sound – reducing loud sonic booms to sonic thumps barely audible on the ground. The X-59 was built for one purpose: to prove that supersonic flight over land can be quiet enough for public acceptance.
NASA test pilot Nils Larson steps out of the X-59 after successfully completing the aircraft’s first flight Tuesday, Oct. 28, 2025. The mission marked a key milestone in advancing NASA’s Quesst mission to enable quiet supersonic flight over land.
NASA/Genaro Vavuris
Next steps
Getting off the ground was only the beginning for the X-59. The team is now preparing the aircraft for full flight testing, evaluating how it will handle and, eventually, how its design will shape shock waves, which typically result in a sonic boom, in supersonic flight. The X-59 will eventually reach its target cruising speed of about 925 mph (Mach 1.4) at 55,000 feet.
The aircraft’s design sits at the center of that testing, shaping and distributing shock-wave formation. Its engine is mounted on top of the fuselage – the main body of the aircraft – to redirect air flow upward and away from the ground.
The cockpit sits mid-fuselage, with no forward-facing window. Instead, NASA developed an eXternal Vision System – cameras and advanced high-definition displays that allow the pilot to see ahead and below the aircraft, which is particularly critical during landing.
These design choices reflect years of research and modeling – all focused on changing how the quieter sonic thump from a supersonic aircraft will be perceived by people on the ground.
NASA’s goal is to gather community response data to support the development of new standards for acceptable levels of sound from commercial supersonic flight over land. To do this, NASA will fly the X-59 over different U.S. communities, collecting ground measurement data and survey input from residents to better understand people’s perception of the X-59’s sonic thump.
“Most X-planes only live in the restricted airspace here on center,” Flick said. “This one is going to go out and fly around the country.”
When the X-59 lifted off the ground for the first time, it carried a piece of NASA’s history back into the air. And with it, a reminder that advancing aeronautics remains central to NASA’s mission.
Preparations for Next Moonwalk Simulations Underway (and Underwater)
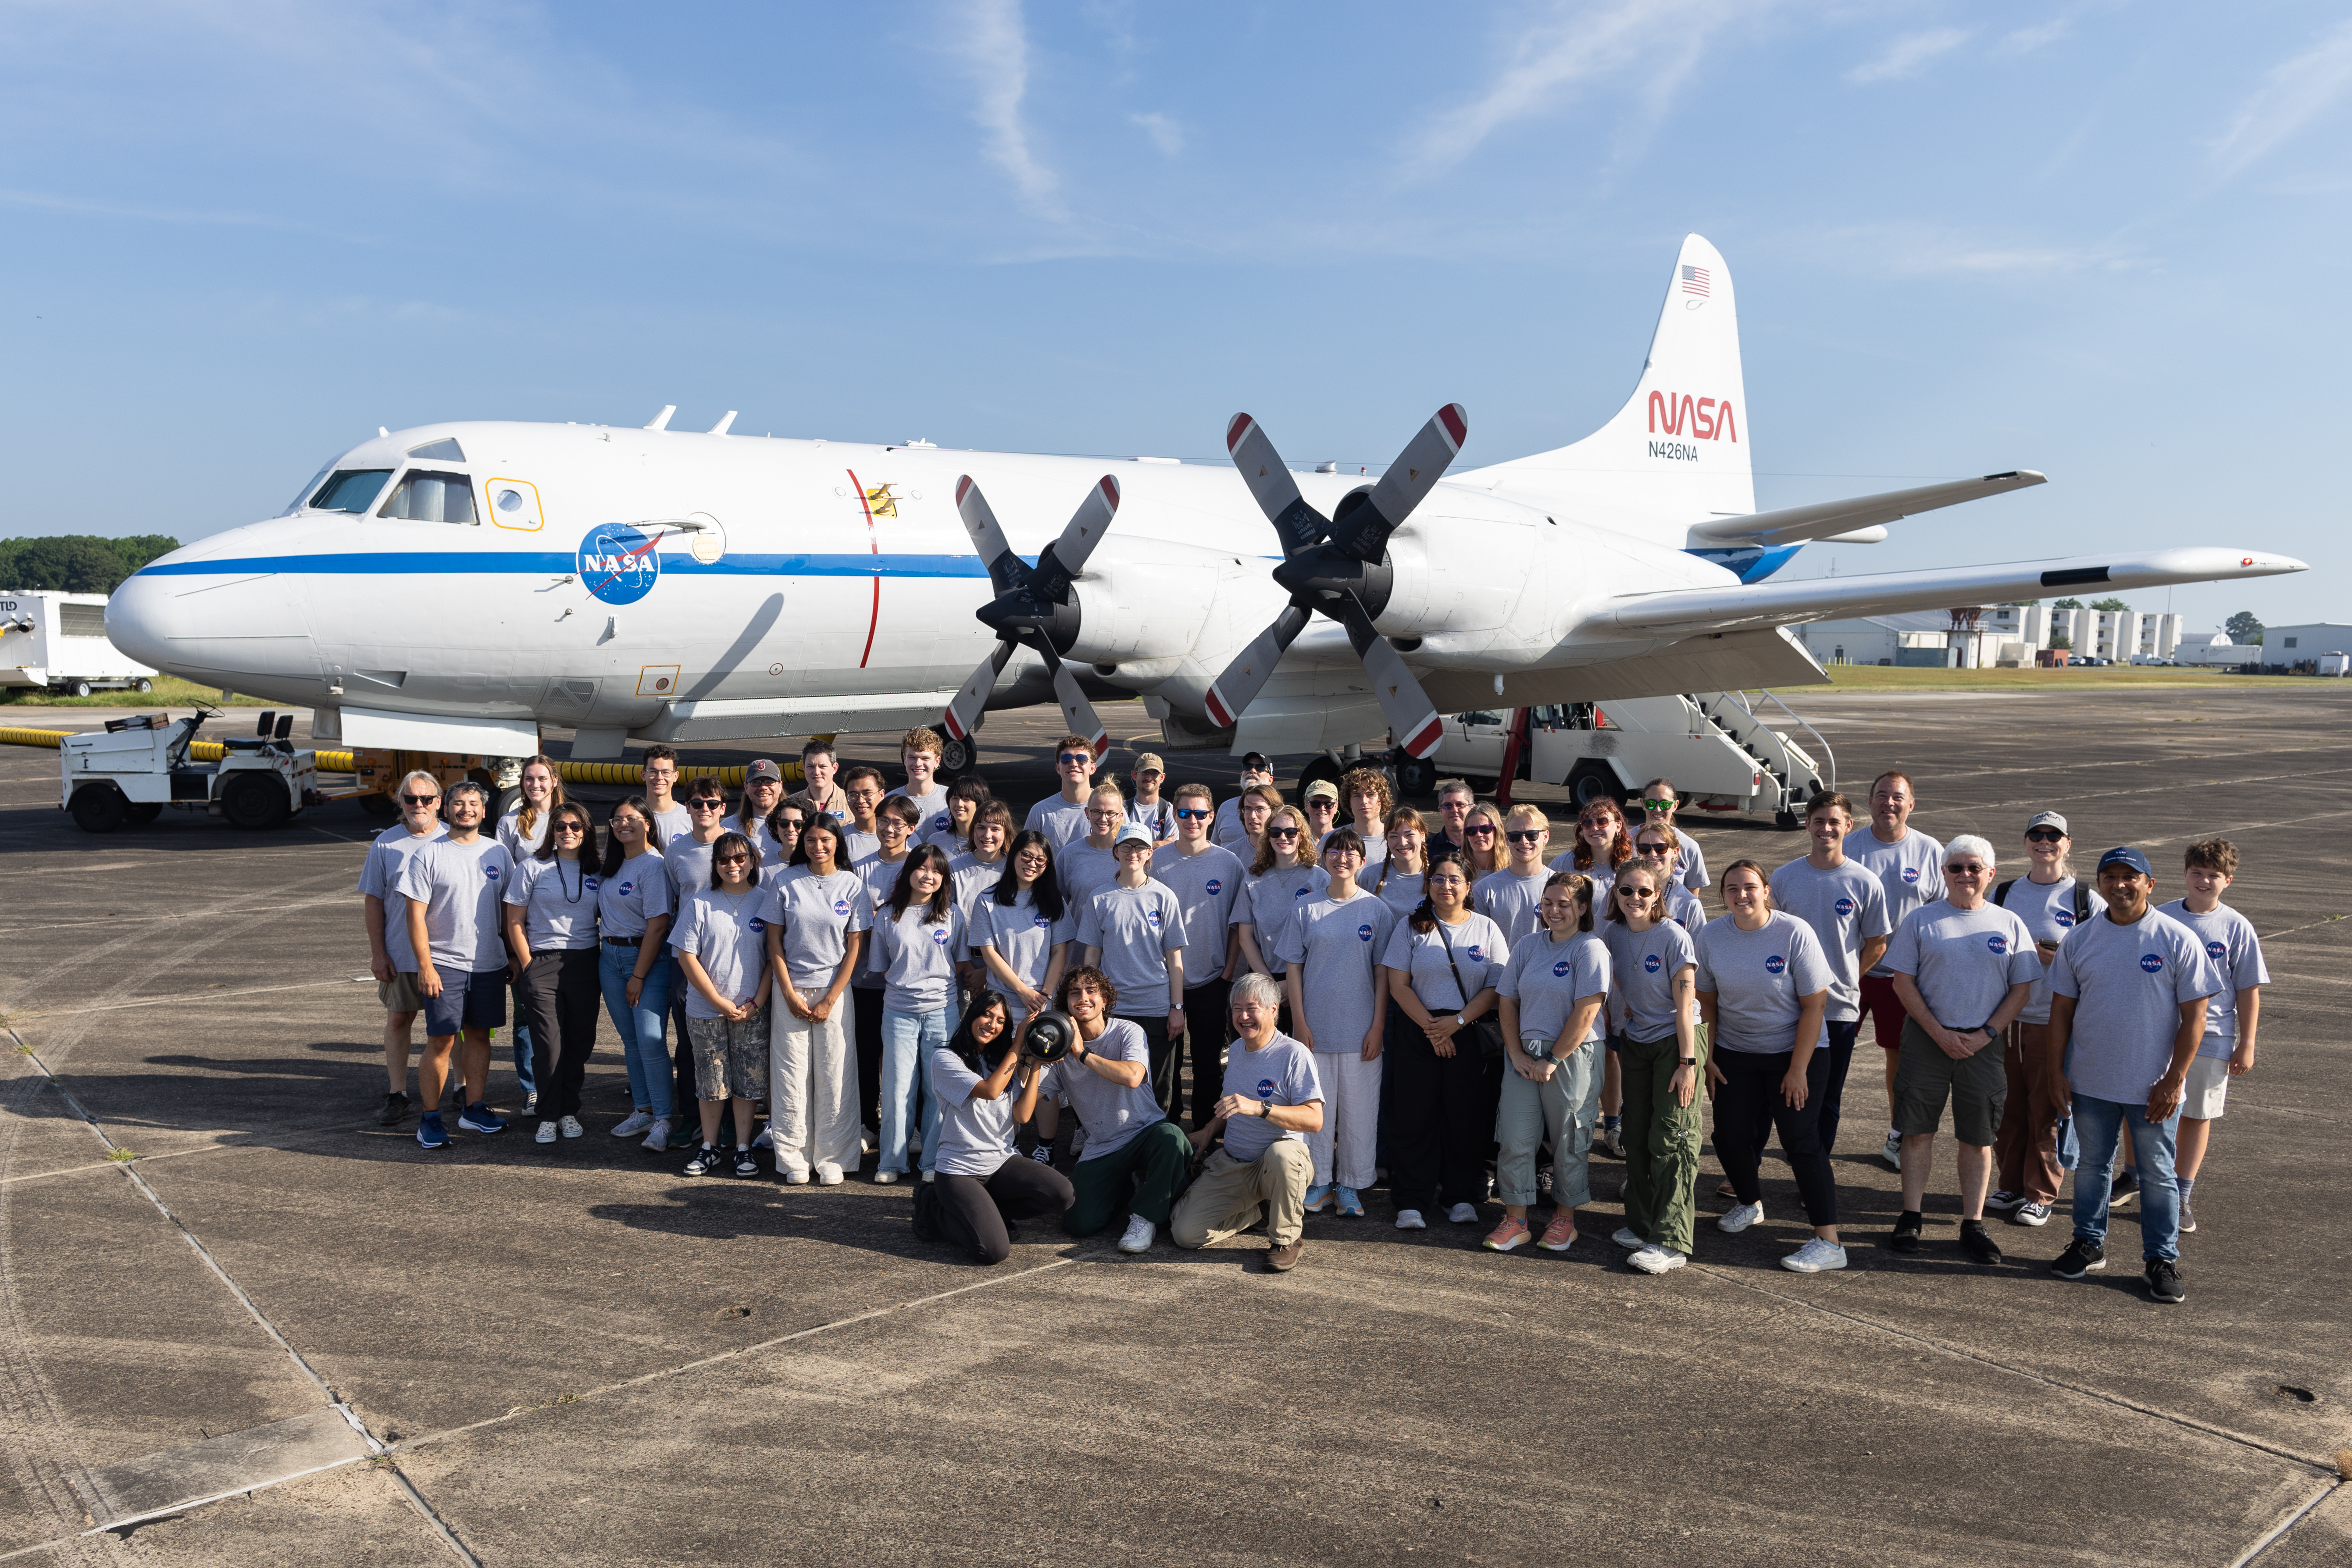
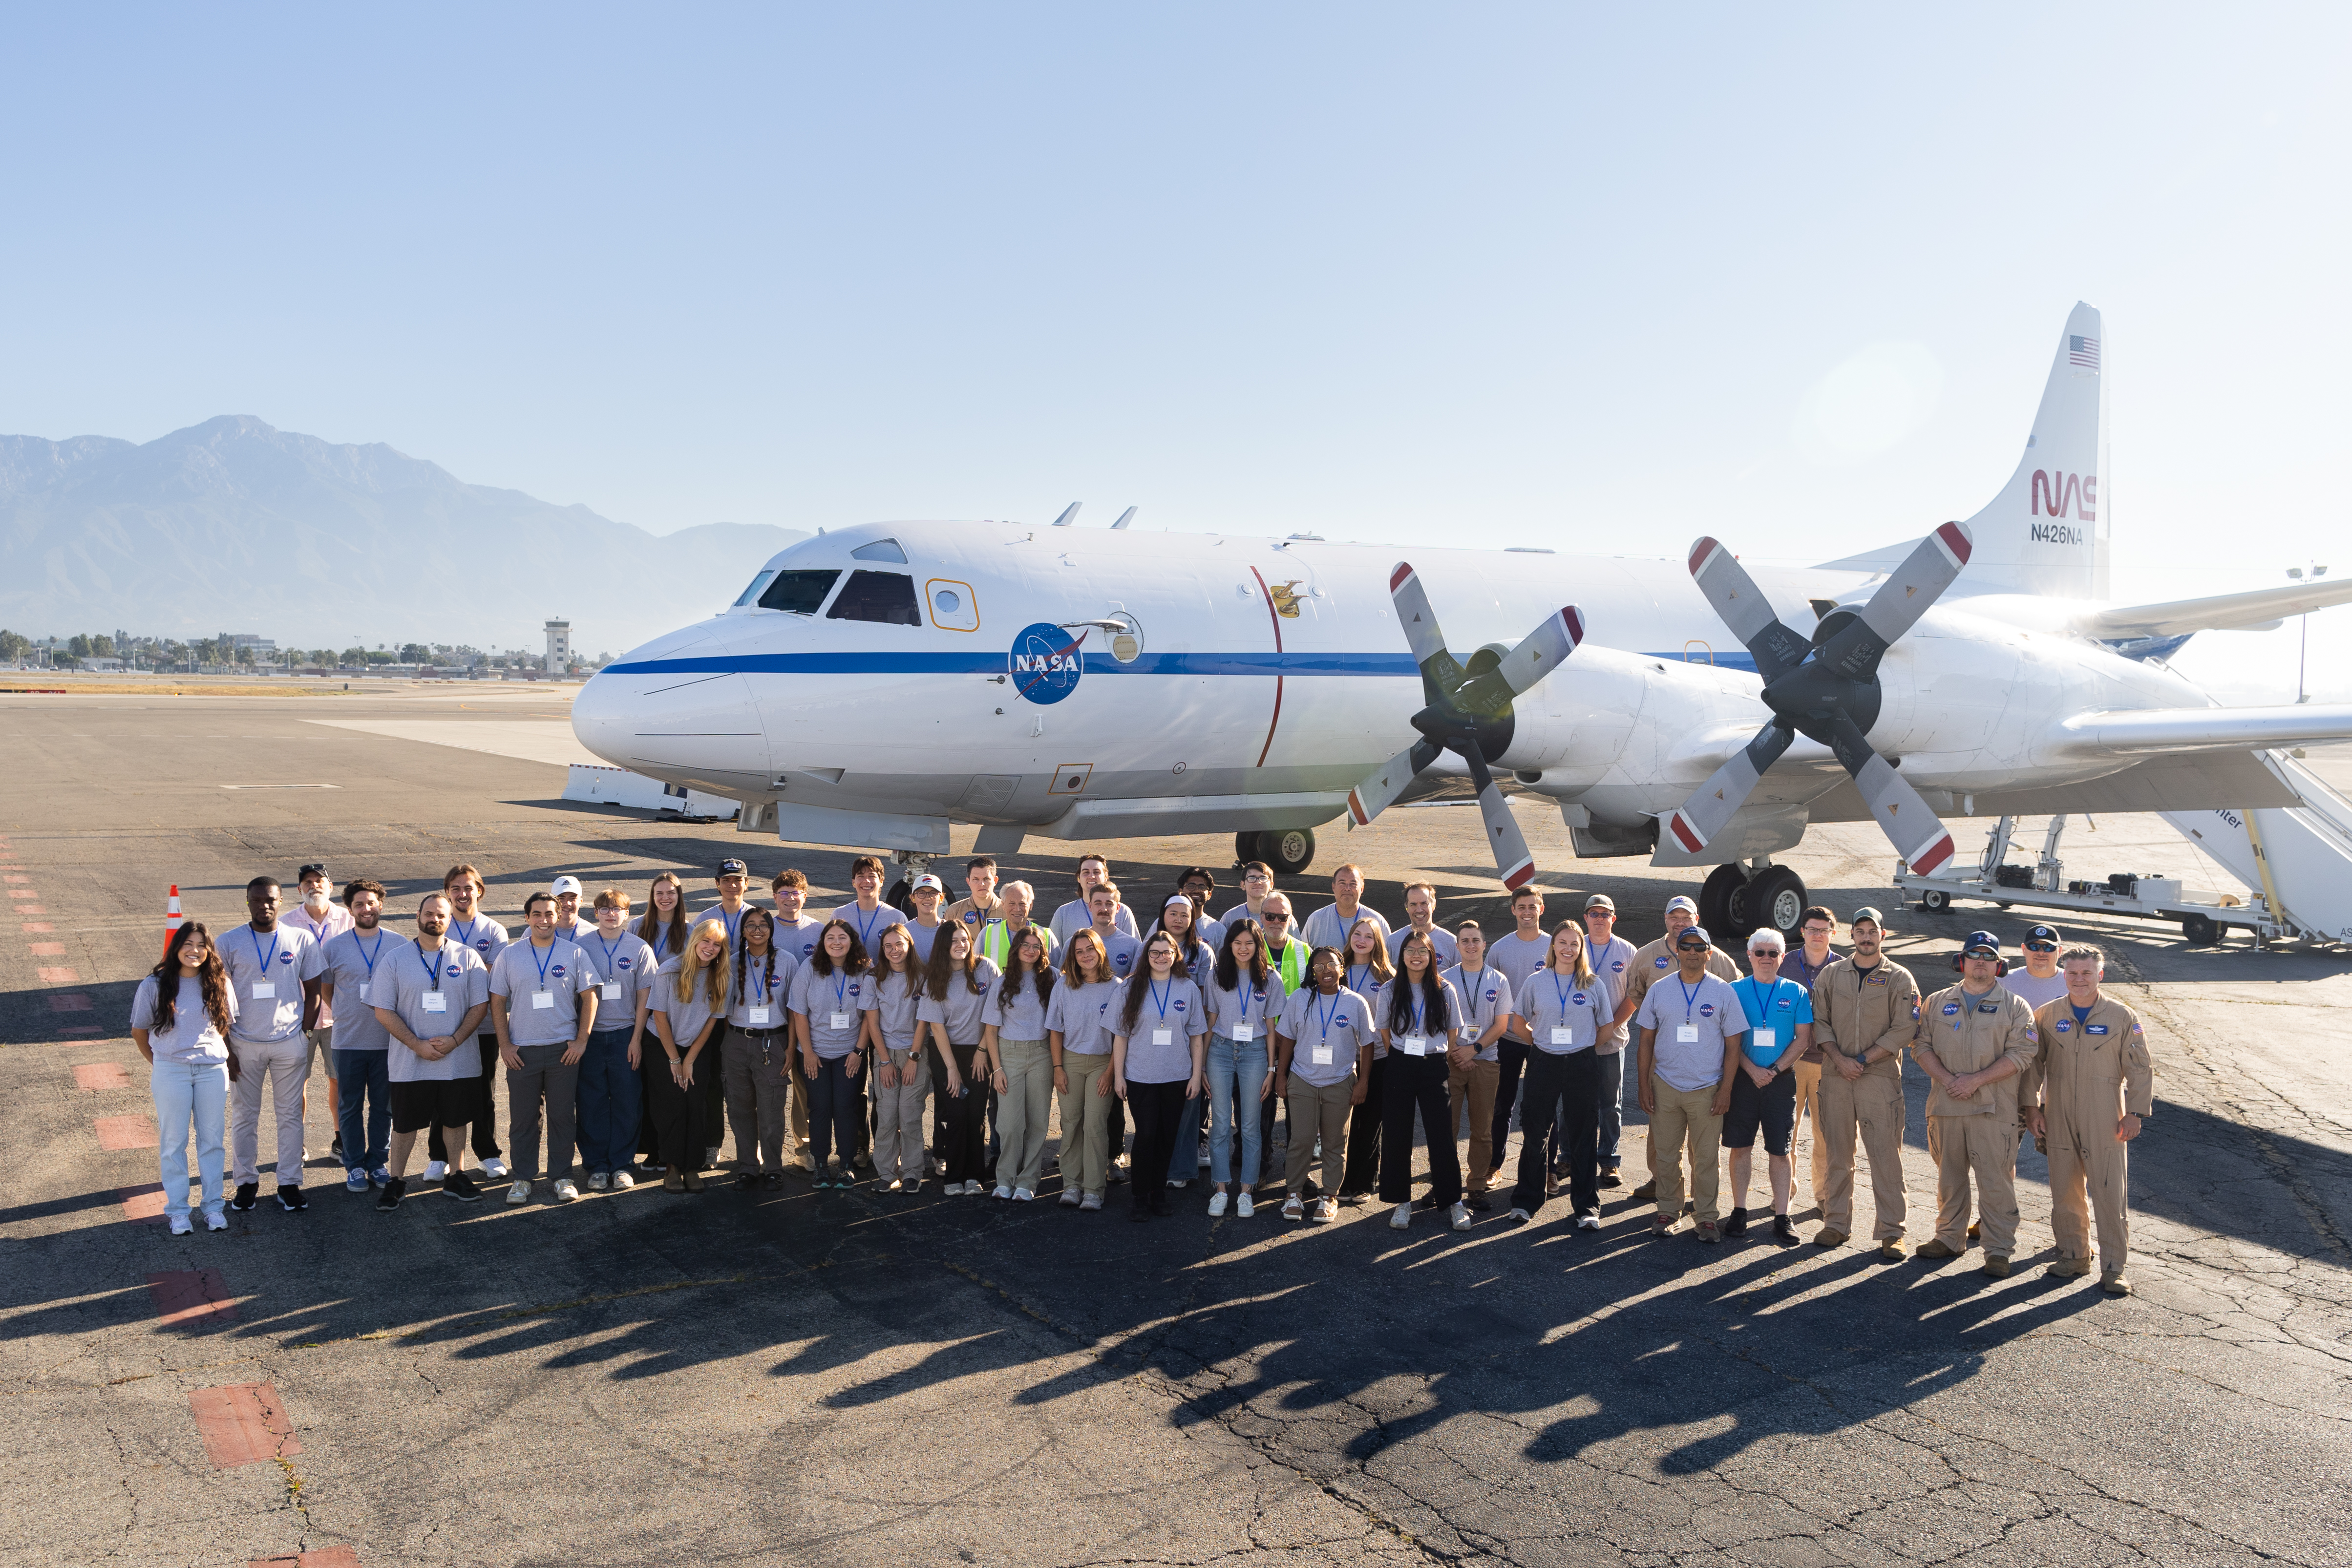
SARP students peer into the cockpit onboard NASA’s P-3 aircraft, during research flights for the 2025 Student Airborne Research Program (SARP) internship.
NASA/Milan Loiacono
In August 2025, 47 students from NASA’s Student Airborne Research Program (SARP) culminated a summer of science by presenting their research to an audience of mentors, professors, family, friends, and NASA personnel.
SARP is a summer internship for undergraduate students, hosted in two cohorts: this year SARP West operated out of Guardian Jet Center and University of California, Irvine in Southern California, while SARP East operated out of Wallops Flight Facility and Virginia Commonwealth University in Virginia.
SARP randomly assigns students into one of four research disciplines, to encourage interdisciplinary collaboration and give them the opportunity to work outside of their usual field. Each discipline is led by a faculty researcher who is an expert in their field, and supported by a graduate mentor. This year, SARP research topics spanned three spheres: atmosphere, biosphere, and hydrosphere, covered between the two cohorts.
The beauty of Earth science lies in its interconnectedness. As a student who primarily researches atmospheric science, stepping out of my comfort zone to explore something new was truly eye-opening, and I am incredibly grateful for the experience.
Nimay mahajan
2025 SARP West student
Over the course of two months, students learned more about NASA’s Airborne Science Program and Earth Science through lectures led by SARP faculty and guest speakers from NASA and the Earth science community, engaged in Earth science data collection while flying onboard Dynamic Aviation’s B-200 and NASA’s P-3 aircraft, and participated in field trips to perform ground sampling fieldwork. Students also visited NASA’s Jet Propulsion Laboratory, Goddard Space Flight Center, and NASA Headquarters. The program also includes other enriching opportunities such as visiting the University of California San Diego’s WAVElab and Virginia Commonwealth University’s Rice Rivers Center.
Students were also provided the opportunity to attend introductory programming sessions and receive hands-on support from a coding mentor to develop and strengthen their experience with code, and incorporate code in their research project.
SARP really made me realize that science is bigger than all of us, but it needs every one of us – even those just stepping into the scientific world – to contribute. Every effort, no matter how big or small, is a step forward in a mission greater than any one individual.
TJ Ochoa Peterson
2025 SARP East student
To watch videos of these student’s presentations, read their research abstracts, or see more photos from the summer, please follow the links below.
2025 SARP East Research Presentations
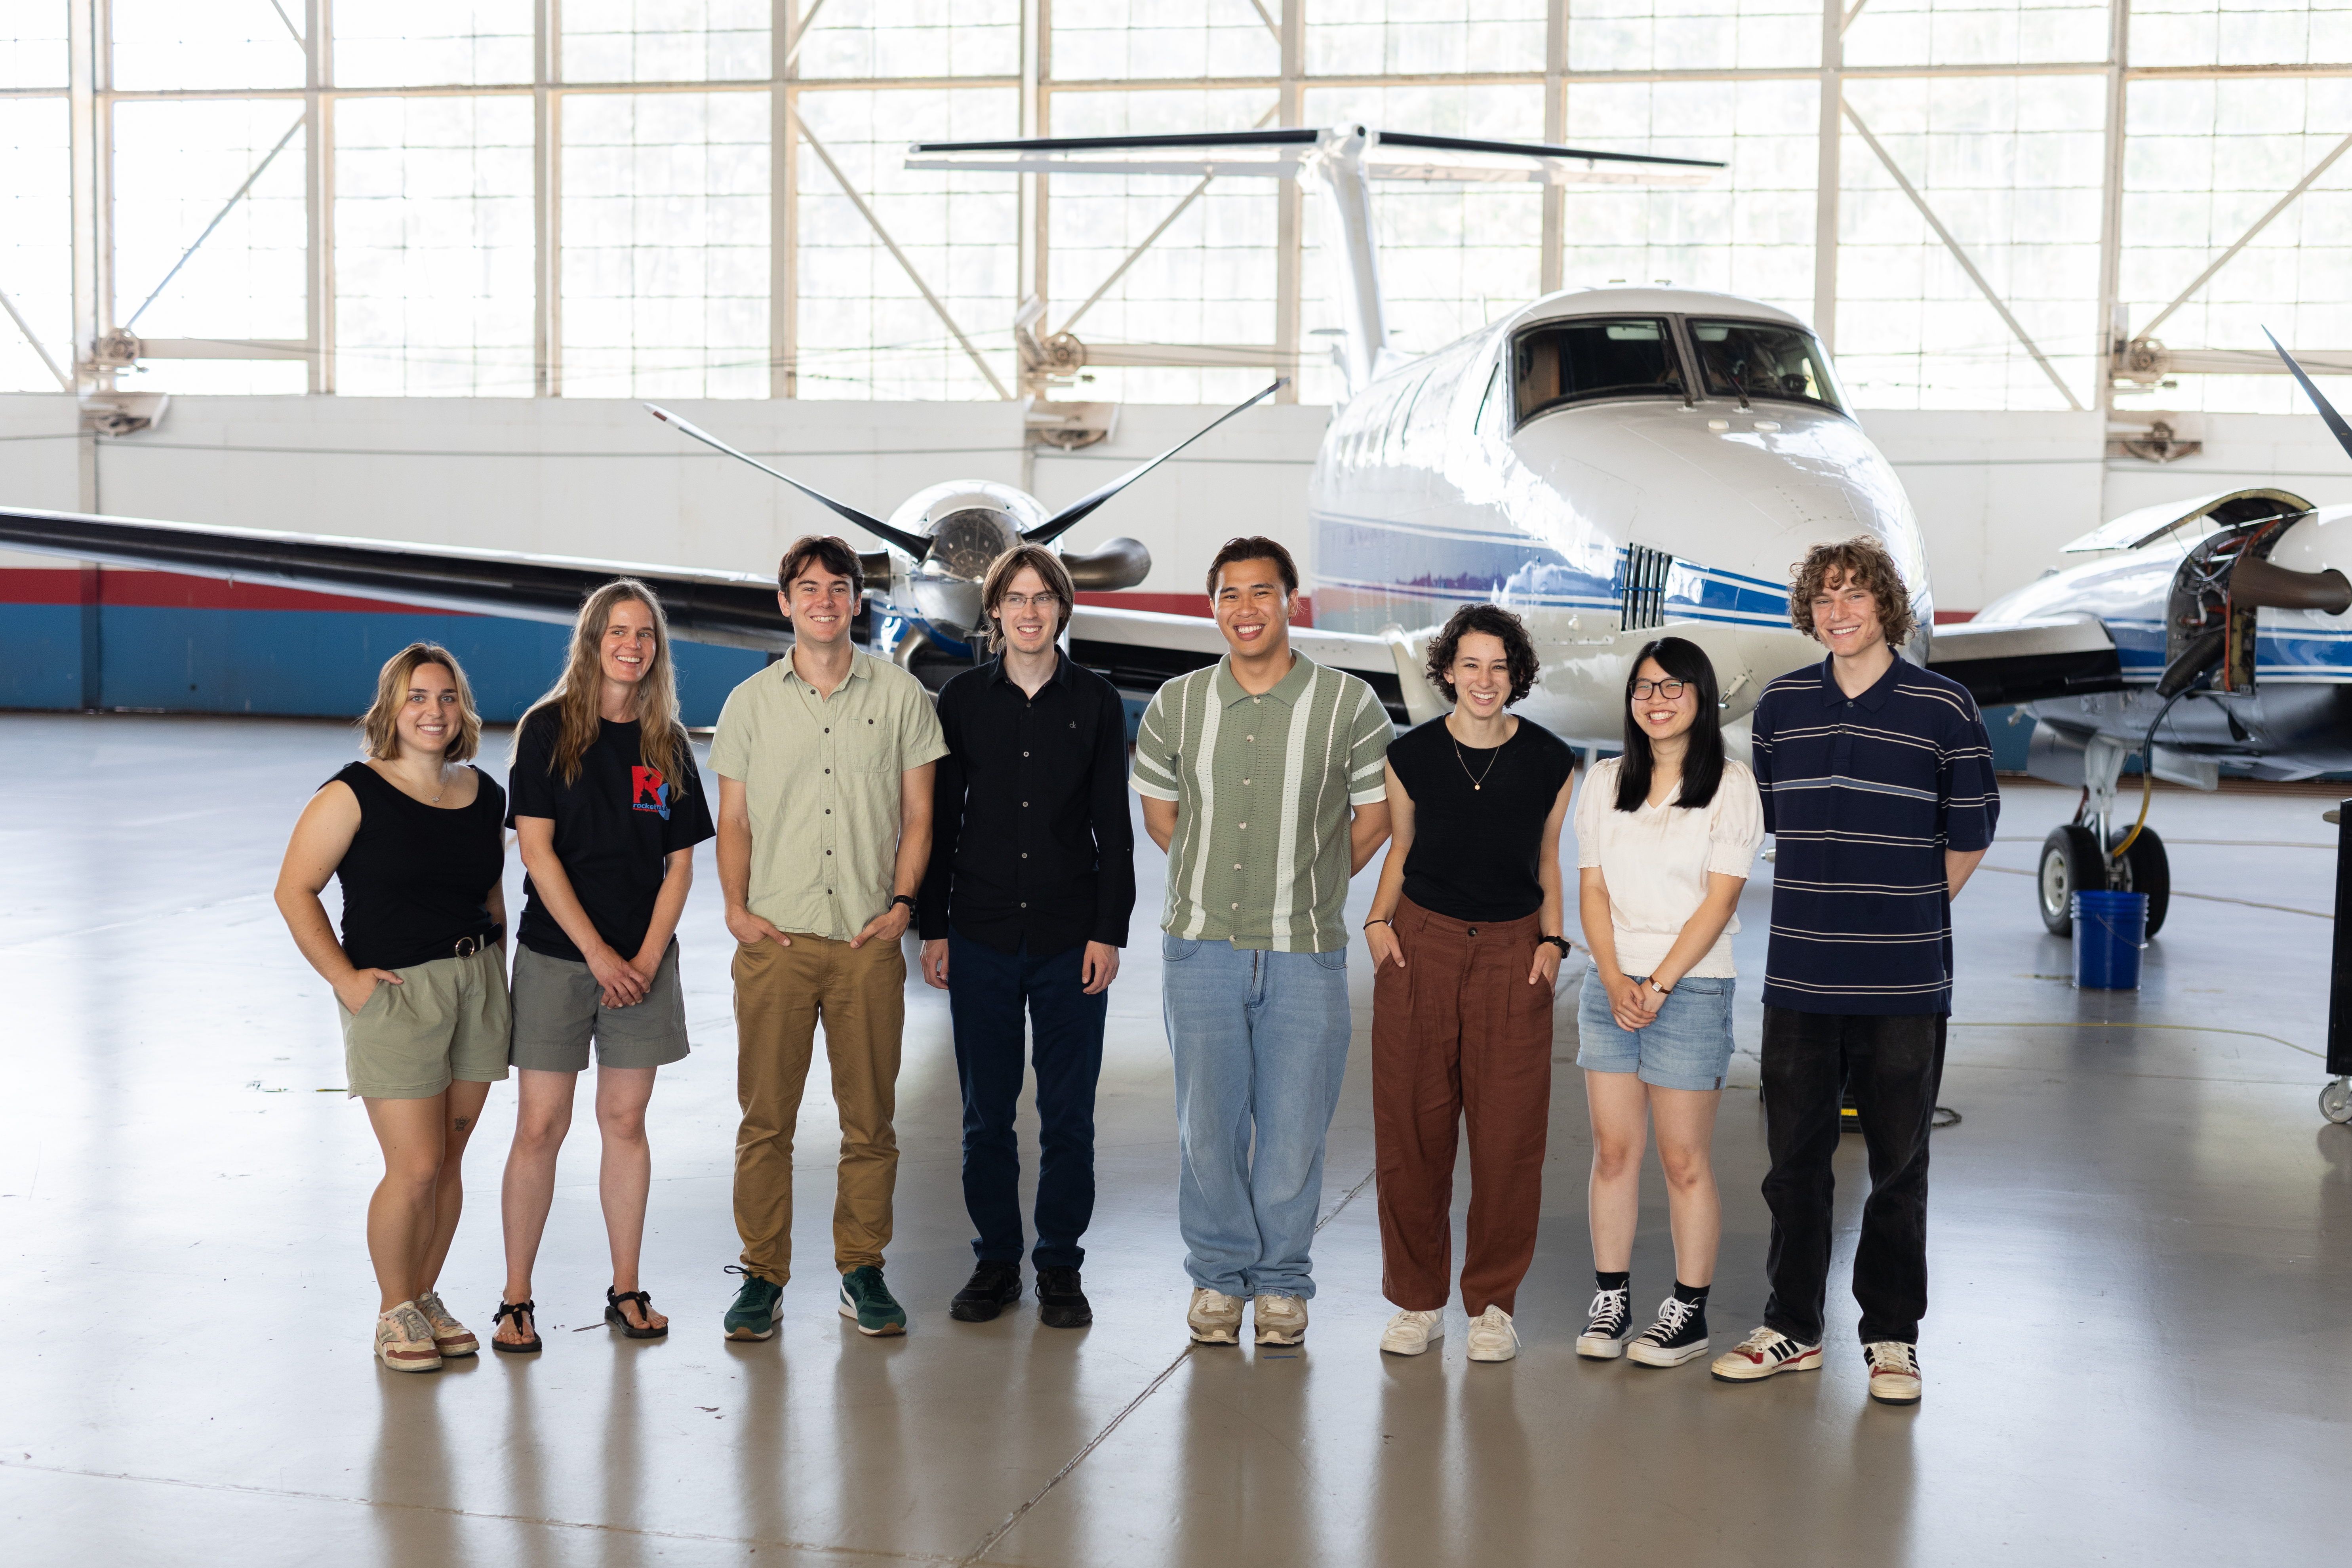
The 2025 SARP East Aerosols Group poses in front of the Dynamic Aviation B-200 aircraft, parked in a hangar at NASA’s Wallops Flight Facility in Virgina. During the internship, students spend a week engaged in Earth science data collection and learning from instruments specialists while flying onboard both the B-200 and NASA’s P-3 aircraft.
Preparations for Next Moonwalk Simulations Underway (and Underwater)
The 2025 SARP East Atmospheric Chemistry Group poses in front of the Dynamic Aviation B-200 aircraft, parked in a hangar at NASA’s Wallops Flight Facility in Virginia. During the internship, students spend a week engaged in Earth science data collection and learning from instruments specialists while flying onboard both the B-200 and NASA’s P-3 aircraft.
Katherine Paredero, Georgia Institute of Technology
Atmospheric Chemistry Group Introduction
Faculty Advisor Stacey Hughes and Graduate MentorKatherine Paredero
Kaylena Pham
Spooky Swamps: How Methane Emission Rates and Their Spatial Variability Differ Between the Great Dismal Swamp and the Alligator River
Kaylena Pham, University of Southern California
Wetlands represent a dominant natural source of methane emissions to the atmosphere through methanogenesis, a process that produces methane in nutrient-depleted anoxic sediments, or as a result of decomposition. In coastal wetlands, particularly brackish regimes such as the Alligator River, severe storms and rising sea levels intensify saltwater intrusion inland. This leads to expansive vegetation death and the formation of ghost forests, large areas of dead standing vegetation. The widespread forest loss caused by salinization suggests elevated methane emissions in areas with vegetation stress through increased rates of decomposition from plant death. Previous research has not yet considered ghost forests when estimating methane emissions in wetlands, leading us to explore emission concentrations across two wetlands with similar vegetation compositions: the Great Dismal Swamp and Alligator River.
In this work, we utilized in-situ measurements collected aboard the Dynamic Aviation B-200 aircraft during the NASA Student Airborne Research Program (SARP) 2025 flight campaign. Methane and carbon monoxide measurements were determined using a PICARRO Gas Concentration Analyzer. This data was then linked with Normalized Difference Vegetation Index (NDVI) imagery from the Terra satellite’s Moderate Resolution Imaging Spectroradiometer (MODIS) instrument. With these two datasets, we studied how vegetation stress influences methane emissions. We observed greater vegetation stress in the Alligator River compared to the Great Dismal Swamp. Furthermore, the Alligator River has wider methane concentration variability occurring over areas with greater vegetation stress. In contrast, methane measurements over the Great Dismal Swamp have narrower distributions and less vegetation stress. This comparison of wetlands in differing vegetative states suggests a potential link between ecosystem stress and elevated methane emissions in wetland environments. Interestingly, despite these differences, the Great Dismal Swamp had a slightly higher mean methane concentration (2.11 ppm) compared to the Alligator River (1.96 ppm). Our results emphasize the importance of improving our understanding of what types of vegetation conditions lead to methane enhancements over wetland regimes.
Carson Turner
Calculating Methane Flux Over the Great Dismal Swamp Using the Mass Balance Technique
Carson Turner, University of North Dakota
Methane is one of the most potent greenhouse gases in the atmosphere, with a warming potential approximately 28 times larger than carbon monoxide. When examining the Global Methane Budget, wetlands are the largest natural source of methane accounting for 20-40% of global methane emissions. Wetland methane emissions have been shown to present the highest uncertainty due to both a lack of in-situ measurements to compare with models as well as a lack of understanding of how different conditions, like soil moisture and air temperature, affect methane emissions. This study looks specifically at The Great Dismal Swamp (GDS), located on the border of southeast Virginia and northeast North Carolina, to study emissions over the region using data collected on flights conducted as part of the Student Airborne Research Program (SARP) in the summer of 2025. A PICARRO Gas Concentration Analyzer was used to collect high frequency methane and carbon monoxide measurements. The two research flights followed similar flight paths around the GDS, on the 23rd and 24th of June. Methane flux was then calculated using the mass balance approach for each flight. Methane flux values were measured at 0.037 kg/s and 0.603 kg/s for the 23rd and 24th respectively. A similar study on wetlands in northern Sweden and Finland found an average methane flux value of 5.56 kg/s. A decreased methane flux value was observed on the flight day associated with higher temperatures, which is contrary to previous research on the relationship between methane emissions and temperature. Future work includes utilizing these flux measurements to improve our understanding of methane emissions from wetlands in models and further explore the relationship between methane emissions and soil moisture.
Alek Libby
Comparative Analysis of Urban Ozone Chemistry in Baltimore, Richmond, and Norfolk
Alek Libby , Florida State University
Urban ozone pollution remains a significant air quality concern in many U.S. cities. Ground-level ozone is not directly emitted but forms through photochemical reactions involving volatile organic compounds (VOCs) and nitrogen oxides (NOₓ) in the presence of sunlight—especially during the summer when incoming solar radiation is enhanced. The National Ambient Air Quality Standard set by the EPA for tropospheric ozone is 70 ppb, which is measured as an 8-hour average. Though exceedances of said standard have declined nationwide, understanding how emission composition varies across metropolitan areas remains critical. This study investigates the VOC makeup and ozone formation dynamics of three Mid-Atlantic urban environments: Baltimore, Richmond, and Norfolk. In-situ Whole Air Samples (WAS) were collected onboard the Aviation Dynamics B200 aircraft during the 2024 NASA Student Airborne Research Program (SARP) Campaign. Gas chromatography was used to quantify the VOC composition of each sample. Additional airborne data from CAFE and CANOE instruments provided measurements of formaldehyde (HCHO) and nitrogen dioxide (NO₂), respectively. This study looked at measurements collected below the boundary layer and within urban beltways to assess regional ozone production potential. Results showed that Baltimore exhibited significantly lower levels of key anthropogenic VOCs, particularly n-butane, i-pentane, and n-pentane. VOC/NOₓ ratios placed Richmond and Norfolk in NOₓ-limited regimes, while Baltimore fell within the transitional zone—supported by HCHO/NO₂ ratios averaging at 2.44 in Baltimore versus 5.14 and 5.09 in Norfolk and Richmond. Baltimore continues to experience notably more ozone exceedance days than Norfolk and Richmond, which is likely related to elevated NO₂ levels in the area. While reducing VOCs may help, these findings suggest that NOₓ reductions are likely more effective for mitigating ozone in the Baltimore area. Future work might replicate this analysis using the 2025 SARP dataset, which was collected on hot, stagnant days that are favorable for ozone production.
Hannah Suh
Characterization of Volatile Organic Compound (VOC) Sources in the Baltimore area
Hannah Suh, University of California, Santa Cruz
Volatile organic compounds (VOCs) play a key role in tropospheric photochemistry, as they react with nitrogen oxides (NOx) in sunlight to produce tropospheric ozone (O3). Both VOCs and tropospheric O3 can have negative impacts on air quality and human health. Understanding the sources of VOCs in urban areas such as Baltimore is essential for informing future air quality policies. In this study, in-situ VOC measurements collected onboard the Aviation Dynamics B200 aircraft during the NASA Student Airborne Research Program (SARP) were analyzed to characterize potential emission sources in the Baltimore area. VOC datasets from two flights from June 24th that flew over that location were investigated. This flight data was collected using aircraft instruments on the Aviation Dynamics B200, primarily the Whole Air Sampler (WAS). WAS canisters were later processed in lab using gas chromatography, which identified the different VOC mixing ratios in the air. VOCs ratios along with Positive Matrix Factorization (PMF), which reduces an inputted data matrix to separate out potential emission source contributions, were compared to each other to consider the most notable sources of VOCs in the Baltimore area. A total of six sources were looked at through PMF for this region. The top three sources seem to align with oil and natural gas, biogenic, and vehicular emissions. Chemical signature ratios indicate the presence of mixed plumes of both industrial and urban emissions, with many significant correlations with ethyne. These results point towards oil and natural gas industries, biogenic sources, and urban sources like vehicles as primary contributors to VOC signature ratios in the Baltimore area. A logical next step for this research would be to compare VOC signature ratios across multiple years to assess temporal trends.
Aashi Parikh
Characterizing VOC Emissions from Chemical Plant Plumes in Hopewell, VA
Aashi Parikh, Boston University
Hopewell, VA is home to a cluster of major chemical facilities, whose emissions have raised concerns in neighboring communities about air pollution and health disparities. While there is information about the historical pollution in Hopewell, few studies provide a comprehensive analysis of volatile organic compounds (VOCs). This study investigates the distribution of VOCs in Hopewell’s industrial corridor and
In-situ whole air samples (WAS) were collected aboard the Aviation Dynamics B200 during the NASA Student Airborne Research Program in June 2024. In this study, samples collected at Hopewell were compared to the rest of the flight. The values were separated by chemical families, and enhancements were identified. The analysis showed that Hopewell had significant levels of aromatics, with 60 ppt of benzene, 119 ppt of toluene, and 47 ppt of styrene, which are VOCs linked to respiratory illness, neurological disorders, reproductive issues, and cancer. Aromatics observed over Hopewell were approximately 5x higher than that of the remaining flight path. According to the EPA, these carcinogenic compounds have no safe threshold for chronic exposure. As such, long-term exposure to these compounds can pose health risks. These findings reinforce existing health outcome disparities in the region, such as elevated cancer rates, and raise concerns about the exposure of nearby communities. Underserved communities are disproportionately being impacted by such health risks in Hopewell. Future research will evaluate VOC concentrations over Hopewell in 2025 and compare them to the 2024 baseline established in this study, providing insight into whether emissions reductions have occurred and if regulatory or community-driven interventions are showing impact.
Preparations for Next Moonwalk Simulations Underway (and Underwater)
The 2025 SARP East Terrestrial Fluxes Group poses in front of the Dynamic Aviation B-200 aircraft, parked in a hangar at NASA’s Wallops Flight Facility in Virginia. During the internship, students spend a week engaged in Earth science data collection and learning from instruments specialists while flying onboard both the B-200 and NASA’s P-3 aircraft.
Brandon Alveshere, Virginia Commonwealth University
Graduate Mentor:
Kayla Preisler, University of Arizona
Terrestrial Fluxes Group Introduction
Rice Rivers Center Director Chris Gough and Graduate Mentor Kayla Preisler
Quinn Koch
Monitoring Postfire Ecosystem Recovery With Spectral Indices and Eddy-Covariance Flux Towers
Quinn Koch, University of California, Los Angeles
Fire is a common ecological disturbance in forest ecosystems, leading to changes in forest structure and function that have implications for the Earth’s carbon budget. Observations of post-fire carbon fluxes provide insight into the trajectory of forest recovery and its future as a carbon sink. Eddy-covariance flux towers measure high frequency greenhouse gas exchange between forests and the atmosphere, yielding measurements of net ecosystem exchange (NEE), gross primary productivity (GPP), and ecosystem respiration (Reco). While flux towers are the gold standard for quantifying ecosystem scale fluxes, vegetation indices derived from remote sensing are highly correlated with tower flux data and may provide broader spatial scale understanding of how carbon fluxes vary following fire and other disturbances. The objective of our study is to examine the relationship between tower carbon flux data and NASA Landsat-derived spectral indices at five sites in the United States and Australia that were disturbed by severe fire. Specifically, we evaluated changes following fire in two Landsat-derived spectral indices, Normalized Difference Vegetation Index (NDVI) and Normalized Burn Ratio (NBR), examining whether spectral indices paralleled temporal variation in NEE, GPP, and Reco. We found that the recovery of spectral indices outpaced the recovery of NEE and GPP at sites that experienced severe fire, highlighting how lags in structural and functional responses to disturbance may decouple vegetation indices from carbon fluxes. This suggests that a temporal lag should be considered when using vegetation indices as a proxy for carbon fluxes in post-fire ecosystems compared to unburned systems. This analysis represents a small snapshot of ecosystems worldwide; therefore, continuing to monitor these trends at future burned flux tower sites will be crucial to further understanding this relationship.
Sara Typrin
Characterizing Forest Response Pathways in the Blackwater National Wildlife Refuge
Sara Typrin, Carleton College
Coastal forests along the Chesapeake Bay are rapidly becoming marshes due to sea level rise and extreme weather events. Predicting these ecosystem shifts is essential for climate adaptation responses. Previous studies have employed Normalized Difference Vegetation Index (NDVI) time series trends to characterize the resilience of coastal ecosystems; however, few have assessed NDVI variation trends within the Chesapeake Bay coastal region, where rates of sea level rise far exceed the global average. This study examines the spatial distribution of forest response pathways in relation to elevation within Maryland’s Blackwater National Wildlife Refuge and the surrounding Eastern Shore region. We used the Landsat 8 record (2014-2024) to extract NDVI values for areas classified as upland forest. We calculated trends in NDVI and NDVI variation using Kendall’s τ (rank correlation) to characterize each 30m pixel into one of four ecosystem shift trajectories: abrupt transition, gradual transition, recovering, or stable. We found that 14.7% of the study area is in abrupt transition, 27.4% in gradual transition, 17.3% is in recovery, and 40.6% is stable. Mapping these regions qualitatively shows that in the BNWR, areas closer to the coast tend to experience abrupt or gradual transitions, and areas farther from the coast are typically stable or in recovery. Recovering forests have higher and more variable elevations than other pathways in a subset of BNWR’s southwest region. Future work can examine how elevation and distance to the coast relate to forest response pathways at a regional scale.
Austin Jeffery
Structural Characteristic Variation Between Upland Forests and Forested Wetlands
Austin Jeffery, The University of Texas at Austin
Forested wetlands are important for regulating the Earth’s climate, cycling nutrients, and providing vital habitats, but are far less studied than upland forests. Prior work in upland forests has illustrated that canopy structural traits vary widely within and across forest types, and that these traits affect crucial ecosystem functions and services such as primary production and carbon sequestration. However, how canopy structure varies within and across forested wetlands has not been thoroughly explored. This study uses waveform lidar data collected during the 2024 SARP East flight campaigns over the Chesapeake Bay region using the LVIS (Land, Vegetation, and Ice Sensor) airborne platform. The LVIS Facility L2 Geolocated Surface Elevation and Canopy Height Products were used to investigate how canopy structure varies across forested wetlands and to compare canopy structural variation between forested wetlands and upland forests. To analyze the data, each lidar granule was first divided into upland and wetland forests by overlaying the granules over a USGS NLCD land use map and a USFS forest type map. Then, 20 plots were created of 100 granules each based on four tree species and whether it was an upland forest or forested wetland plot. Two upland and two wetland species were used with 5 plots each. Then, the data were used to assess variation in structural characteristics, including canopy height and vertical complexity, among forested wetlands and upland forests. The analysis resulted in a significant statistical difference between forested wetlands and upland forests structural characteristics. Additionally, forested wetlands showed a general larger variance in canopy structural complexity suggesting variation in canopy height, canopy density, layering, and forest age. This study serves as a benchmark for LiDAR-based structural characterization of forested wetlands, and informs management and conservation of forested wetlands in the mid-Atlantic region.
Ellery Moore
Arctic Ecosystem Carbon Dynamics: Comparing Greenhouse Gas Measurements in Alaska and Northern Canada Using MODIS Satellite Data and Atmospheric Flask Samples
Ellery Moore, Colby College
As global temperatures continue to warm, the International Panel on Climate Change (IPCC) has called attention to thawing permafrost as a potential tipping point leading to “irreversible” change to Earth’s ecosystems. Currently, permafrost holds an estimated 1,400 Pg of carbon, which will be released primarily as greenhouse gases (GHGs), methane (CH4), and carbon dioxide (CO2), through microbial activity as temperatures continue to rise, thus exacerbating the atmospheric GHG effect and further warming. In Alaska and Northern Canada, permafrost underlies most of the land, with regions determined by the percentage of frozen soil: continuous (90-100%) and discontinuous (50-90%). Upon examination of spatial maps, the continuous region tends to correspond to the tundra ecosystem, and the discontinuous region to the boreal forest ecosystem. We quantified the permafrost regions using Moderate Resolution Imaging Spectroradiometer (MODIS) derived Normalized Difference Vegetation Index (NDVI) and land surface temperature (LST). In this study, we aim to determine if CO2 and CH4 concentration measurements differ between the two ecosystems using atmospheric flask samples collected during the Arctic Boreal Vulnerability Experiment (ABoVE) in 2017. Overall, the results showed a positive correlation between NDVI and LST, with the boreal forest characterized by higher NDVI and LST than the tundra. Additionally, higher CO2 concentrations were associated with lower NDVI and LST. However, when separating the samples into the two ecosystems, no difference was seen in their diurnal cycles. In general, CH4 measurements did not show a clear relationship with NDVI and LST, but predominantly higher measurements were seen in the tundra when separating the samples by ecosystem. The different CH4 concentrations could be influenced by other environmental sources not considered in this study, such as thermokarst lakes and anthropogenic factors. Further work to differentiate the ecosystems and confirm findings can be done by examining soil moisture samples and comparing permafrost active layer thicknesses. Additionally, to better understand the rates of carbon release, eddy covariance measurements could be examined between the tundra and boreal forest over time.
Rayyane Matonding
San Francisco BVOC Emissions: The Role of Urban Vegetation in HCHO/NO2 Ratios
Rayyane Matonding, University of San Francisco
Biogenic Volatile Organic Compounds (BVOCs) influence local air quality, especially during summer when emissions and photochemical activity peak. BVOCs can oxidize to form ground level ozone, which poses respiratory health risks. Formaldehyde (HCHO), a key photooxidation product of BVOCs, serves as a useful proxy for biogenic emissions in remote sensing studies. Likewise, nitrogen dioxide (NO2) indicates combustion-related activity and anthropogenic VOC influence. This study examines the relationship between urban tree cover and BVOC-related ozone formation using the HCHO to NO2 photochemical regime, which reflects the balance between biogenic and anthropogenic sources. HCHO and NO2 data were obtained from NASA’s TEMPO instrument, and tree cover data from SF OpenData. San Francisco was selected due to its urban greening efforts, high anthropogenic emissions, and prevalence of invasive tree species. Two neighborhoods were selected, Sunnyside with approximately 22 percent canopy cover and Potrero Hill with approximately 2 percent canopy cover, to compare temporal trends in HCHO to NO2 ratios using time series plots. These neighborhoods were chosen based on the availability of hyperlocal weather data, which allowed for more localized atmospheric analysis. No consistent relationship between tree cover and HCHO to NO2 ratios was observed, except during 15:11 and 18:11 on June 18, 2024, which may be associated with elevated photolysis. When weather variables such as zonal wind, meridional wind, and temperature were included in the analysis, no significant correlations were found. Further research should include other cities, additional time periods, and tree species information.
Emmanuel Kaiser-Veyrat
Vegetation Traits to Methane Fluxes: A Machine Learning Approach Across Diverse Wetlands
Emmanuel Kaiser-Veyrat, Cornell University
Wetlands are the largest and most uncertain biological source of CH4, a greenhouse gas with 56 times the radiative forcing of CO2 over a 20-year time horizon. Given the spatiotemporal constraints of these dynamic ecosystems for consistent on-site observations, remotely sensed vegetation indices (VIs) offer a scalable approach to capturing the biophysical and biochemical conditions that govern CH4 exchanges. However, their reliability in wetland environments is challenged by signal saturation in dense vegetation as well as spectral mixing of water, soil, and plants. Seeking to quantify these limitations, we employ the machine learning algorithm, Random Forest Regressor (RFR), to answer the question: Can remotely sensed vegetation traits predict CH4 fluxes across freshwater and saltwater marshes? VIs from the Index DataBase are derived from the Landsat Collection 2 Level-2 products for Landsat-7 ETM+ and Landsat-8 OLI. The FLUXNET-CH4 Community Product yields 17 wetland sites across the contiguous U.S. with daily mean methane flux values spanning some or all of the 2011 to 2018 interval. Generalized flux footprints were computed for every site adopting a uniform approach scaling fetch with increasing measurement height. Extracting feature importances from RFR, we found the Green Vegetation Moisture Index (GVMI) to consistently outperform all other indices, including two meteorological covariates measured from flux tower sites: air temperature and shortwave radiation. Grouping the VIs into five categories (moisture and water, greenness and productivity, structure and soil, pigments, and burn), we found that moisture and water indices consistently scored higher in feature importance than all other categories combined.
This website uses cookies to improve your experience. We'll assume you're ok with this, but you can opt-out if you wish.AcceptRead More
Privacy & Cookies Policy
Privacy Overview
This website uses cookies to improve your experience while you navigate through the website. Out of these, the cookies that are categorized as necessary are stored on your browser as they are essential for the working of basic functionalities of the website. We also use third-party cookies that help us analyze and understand how you use this website. These cookies will be stored in your browser only with your consent. You also have the option to opt-out of these cookies. But opting out of some of these cookies may affect your browsing experience.
Necessary cookies are absolutely essential for the website to function properly. This category only includes cookies that ensures basic functionalities and security features of the website. These cookies do not store any personal information.
Any cookies that may not be particularly necessary for the website to function and is used specifically to collect user personal data via analytics, ads, other embedded contents are termed as non-necessary cookies. It is mandatory to procure user consent prior to running these cookies on your website.