The Andromeda galaxy, also known as Messier 31 (M31), is the closest spiral galaxy to the Milky Way at a distance of about 2.5 million light-years. This new composite image contains data of M31 taken by some of the world’s most powerful telescopes in different kinds of light. This image is released in tribute to the groundbreaking legacy of Dr. Vera Rubin, whose observations transformed our understanding of the universe.
Tag: NASA
-
Sparkling Andromeda
 X-ray: NASA/CXO/UMass/Z. Li & Q.D. Wang, ESA/XMM-Newton; Infrared: NASA/JPL-Caltech/WISE, Spitzer, NASA/JPL-Caltech/K. Gordon (U. Az), ESA/Herschel, ESA/Planck, NASA/IRAS, NASA/COBE; Radio: NSF/GBT/WSRT/IRAM/C. Clark (STScI); Ultraviolet: NASA/JPL-Caltech/GALEX; Optical: Andromeda, Unexpected © Marcel Drechsler, Xavier Strottner, Yann Sainty & J. Sahner, T. Kottary. Composite image processing: L. Frattare, K. Arcand, J.Major
The Andromeda galaxy, also known as Messier 31 (M31), is a glittering beacon in this image released on June 25, 2025, in tribute to the groundbreaking legacy of astronomer Dr. Vera Rubin, whose observations transformed our understanding of the universe. In the 1960s, Rubin and her colleagues studied M31 and determined that there was some unseen matter in the galaxy that was affecting how the galaxy and its spiral arms rotated. This unknown material was named “dark matter.”
M31 is the closest spiral galaxy to the Milky Way at a distance of about 2.5 million light-years. Astronomers use Andromeda to understand the structure and evolution of our own spiral, which is much harder to do since Earth is embedded inside the Milky Way.
Learn more about this image and experience in sound, too.
Image credit: X-ray: NASA/CXO/UMass/Z. Li & Q.D. Wang, ESA/XMM-Newton; Infrared: NASA/JPL-Caltech/WISE, Spitzer, NASA/JPL-Caltech/K. Gordon (U. Az), ESA/Herschel, ESA/Planck, NASA/IRAS, NASA/COBE; Radio: NSF/GBT/WSRT/IRAM/C. Clark (STScI); Ultraviolet: NASA/JPL-Caltech/GALEX; Optical: Andromeda, Unexpected © Marcel Drechsler, Xavier Strottner, Yann Sainty & J. Sahner, T. Kottary. Composite image processing: L. Frattare, K. Arcand, J.Major
-
By Air and by Sea: Validating NASA’s PACE Ocean Color Instrument
6 min read
Preparations for Next Moonwalk Simulations Underway (and Underwater)
 NASA Ames research scientist Kristina Pistone monitors instrument data while onboard the Twin Otter aircraft, flying over Monterey Bay during the October 2024 deployment of the AirSHARP campaign.NASA/Samuel Leblanc
In autumn 2024, California’s Monterey Bay experienced an outsized phytoplankton bloom that attracted fish, dolphins, whales, seabirds, and – for a few weeks in October – scientists. A team from NASA’s Ames Research Center in Silicon Valley, with partners at the University of California, Santa Cruz (UCSC), and the Naval Postgraduate School, spent two weeks on the California coast gathering data on the atmosphere and the ocean to verify what satellites see from above. In spring 2025, the team returned to gather data under different environmental conditions.
Scientists call this process validation.
Setting up the Campaign
The PACE mission, which stands for Plankton, Aerosol, Cloud, ocean Ecosystem, was launched in February 2024 and designed to transform our understanding of ocean and atmospheric environments. Specifically, the satellite will give scientists a finely detailed look at life near the ocean surface and the composition and abundance of aerosol particles in the atmosphere.
Whenever NASA launches a new satellite, it sends validation science teams around the world to confirm that the data from instruments in space match what traditional instruments can see at the surface. AirSHARP (Airborne aSsessment of Hyperspectral Aerosol optical depth and water-leaving Reflectance Product Performance for PACE) is one of these teams, specifically deployed to validate products from the satellite’s Ocean Color Instrument (OCI).
The OCI spectrometer works by measuring reflected sunlight. As sunlight bounces off of the ocean’s surface, it creates specific shades of color that researchers use to determine what is in the water column below. To validate the OCI data, research teams need to confirm that measurements directly at the surface match those from the satellite. They also need to understand how the atmosphere is changing the color of the ocean as the reflected light is traveling back to the satellite.
In October 2024 and May 2025, the AirSHARP team ran simultaneous airborne and seaborne campaigns. Going into the field during different seasons allows the team to collect data under different environmental conditions, validating as much of the instrument’s range as possible.
Over 13 days of flights on a Twin Otter aircraft, the NASA-led team used instruments called 4STAR-B (Spectrometer for sky-scanning sun Tracking Atmospheric Research B), and the C-AIR (Coastal Airborne In-situ Radiometer) to gather data from the air. At the same time, partners from UCSC used a host of matching instruments onboard the research vessel R/V Shana Rae to gather data from the water’s surface.
Ocean Color and Water Leaving Reflectance
The Ocean Color Instrument measures something called water leaving reflectance, which provides information on the microscopic composition of the water column, including water molecules, phytoplankton, and particulates like sand, inorganic materials, and even bubbles. Ocean color varies based on how these materials absorb and scatter sunlight. This is especially useful for determining the abundance and types of phytoplankton.
 Photographs taken out the window of the Twin Otter aircraft during the October 2024 AirSHARP deployment showcase the variation in ocean color, which indicates different molecular composition of the water column beneath. The red color in several of these photos is due to a phytoplankton bloom – in this case a growth of red algae.NASA/Samuel Leblanc
The AirSHARP team used radiometers with matching technology – C-AIR from the air and C-OPS (Compact Optical Profiling System) from the water – to gather water leaving reflectance data.
“The C-AIR instrument is modified from an instrument that goes on research vessels and takes measurements of the water’s surface from very close range,” said NASA Ames research scientist Samuel LeBlanc. “The issue there is that you’re very local to one area at a time. What our team has done successfully is put it on an aircraft, which enables us to span the entire Monterey Bay.”
The larger PACE validation team will compare OCI measurements with observations made by the sensors much closer to the ocean to ensure that they match, and make adjustments when they don’t.
Aerosol Interference
One factor that can impact OCI data is the presence of manmade and natural aerosols, which interact with sunlight as it moves through the atmosphere. An aerosol refers to any solid or liquid suspended in the air, such as smoke from fires, salt from sea spray, particulates from fossil fuel emissions, desert dust, and pollen.
Imagine a 420 mile-long tube, with the PACE satellite at one end and the ocean at the other. Everything inside the tube is what scientists refer to as the atmospheric column, and it is full of tiny particulates that interact with sunlight. Scientists quantify this aerosol interaction with a measurement called aerosol optical depth.
“During AirSHARP, we were essentially measuring, at different wavelengths, how light is changed by the particles present in the atmosphere,” said NASA Ames research scientist Kristina Pistone. “The aerosol optical depth is a measure of light extinction, or how much light is either scattered away or absorbed by aerosol particulates.”
The team measured aerosol optical depth using the 4STAR-B spectrometer, which was engineered at NASA Ames and enables scientists to identify which aerosols are present and how they interact with sunlight.
Twin Otter Aircraft
 AirSHARP principal investigator Liane Guild walks towards a Twin Otter aircraft owned and operated by the Naval Postgraduate School. The aircraft’s ability to perform complex, low-altitude flights made it the ideal platform to fly multiple instruments over Monterey Bay during the AirSHARP campaign.NASA/Samuel Leblanc
Flying these instruments required use of a Twin Otter plane, operated by the Naval Postgraduate School (NPS). The Twin Otter is unique for its ability to perform extremely low-altitude flights, making passes down to 100 feet above the water in clear conditions.
“It’s an intense way to fly. At that low height, the pilots continually watch for and avoid birds, tall ships, and even wildlife like breaching whales,” said Anthony Bucholtz, director of the Airborne Research Facility at NPS.
With the phytoplankton bloom attracting so much wildlife in a bay already full of ships, this is no small feat. “The pilots keep a close eye on the radar, and fly by hand,” Bucholtz said, “all while following careful flight plans crisscrossing Monterey Bay and performing tight spirals over the Research Vessel Shana Rae.”
Campaign Data
Data gathered from the 2024 phase of this campaign is available on two data archive systems. Data from the 4STAR instrument is available in the PACE data archive and data from C-AIR is housed in the SeaBASS data archive.
Other data from the NASA PACE Validation Science Team is available through the PACE website: https://pace.oceansciences.org/pvstdoi.htm#
Samuel LeBlanc and Kristina Pistone are funded via the Bay Area Environmental Research Institute (BAERI), which is a scientist-founded nonprofit focused on supporting Earth and space sciences.
About the Author

Milan Loiacono
Science Communication SpecialistMilan Loiacono is a science communication specialist for the Earth Science Division at NASA Ames Research Center.
Share
Details
Last UpdatedJun 26, 2025Related Terms
Explore More
-
NASA Mars Orbiter Learns New Moves After Nearly 20 Years in Space
6 min read
Preparations for Next Moonwalk Simulations Underway (and Underwater)
 An antenna sticks out like whiskers from NASA’s Mars Reconnaissance Orbiter in this artist’s concept of the spacecraft, which has been orbiting the Red Planet since 2006. This antenna is part of SHARAD, a radar that peers below the Martian surface.NASA/JPL-Caltech
The Mars Reconnaissance Orbiter is testing a series of large spacecraft rolls that will help it hunt for water.
After nearly 20 years of operations, NASA’s Mars Reconnaissance Orbiter (MRO) is on a roll, performing a new maneuver to squeeze even more science out of the busy spacecraft as it circles the Red Planet. Engineers have essentially taught the probe to roll over so that it’s nearly upside down. Doing so enables MRO to look deeper underground as it searches for liquid and frozen water, among other things.
The new capability is detailed in a paper recently published in the Planetary Science Journal documenting three “very large rolls,” as the mission calls them, that were performed between 2023 and 2024.
“Not only can you teach an old spacecraft new tricks, you can open up entirely new regions of the subsurface to explore by doing so,” said one of the paper’s authors, Gareth Morgan of the Planetary Science Institute in Tucson, Arizona.
This animation depicts NASA’s Mars Reconnaissance Orbiter performing a 120-degree roll that increases the strength of its radar signal by 10 times or more.NASA/JPL-CaltechThe orbiter was originally designed to roll up to 30 degrees in any direction so that it can point its instruments at surface targets, including potential landing sites, impact craters, and more.
“We’re unique in that the entire spacecraft and its software are designed to let us roll all the time,” said Reid Thomas, MRO’s project manager at NASA’s Jet Propulsion Laboratory in Southern California.
The process for rolling isn’t simple. The spacecraft carries five operating science instruments that have different pointing requirements. To target a precise spot on the surface with one instrument, the orbiter has to roll a particular way, which means the other instruments may have a less-favorable view of Mars during the maneuver.
That’s why each regular roll is planned weeks in advance, with instrument teams negotiating who conducts science and when. Then, an algorithm checks MRO’s position above Mars and automatically commands the orbiter to roll so the appropriate instrument points at the correct spot on the surface. At the same time, the algorithm commands the spacecraft’s solar arrays to rotate and track the Sun and its high-gain antenna to track Earth to maintain power and communications.
Very large rolls, which are 120 degrees, require even more planning to maintain the safety of the spacecraft. The payoff is that the new maneuver enables one particular instrument, called the Shallow Radar (SHARAD), to have a deeper view of Mars than ever before.


SHARAD’s View of Mars During a ‘Very Large Roll’
These two radargrams from the SHARAD instrument on NASA’s MRO reveal how the spacecraft’s new “very large roll” maneuver produces a stronger signal, providing a brighter, clearer picture of the Martian subsurface. Use the slider to compare the 120-degree roll, left, to the standard 28-degree roll. NASA/JPL-Caltech/University of Rome/ASI/PSIBigger Rolls, Better Science
Designed to peer from about half a mile to a little over a mile (1 to 2 kilometers) belowground, SHARAD allows scientists to distinguish between materials like rock, sand, and ice. The radar was especially useful in determining where ice could be found close enough to the surface that future astronauts might one day be able to access it. Ice will be key for producing rocket propellant for the trip home and is important for learning more about the climate, geology, and potential for life at Mars.
But as great as SHARAD is, the team knew it could be even better.
To give cameras like the High-Resolution Imaging Science Experiment (HiRISE) prime viewing at the front of MRO, SHARAD’s two antenna segments were mounted at the back of the orbiter. While this setup helps the cameras, it also means that radio signals SHARAD pings onto the surface below encounter parts of the spacecraft, interfering with the signals and resulting in images that are less clear.
“The SHARAD instrument was designed for the near-subsurface, and there are select regions of Mars that are just out of reach for us,” said Morgan, a co-investigator on the SHARAD team. “There is a lot to be gained by taking a closer look at those regions.”
In 2023, the team decided to try developing 120-degree very large rolls to provide the radio waves an unobstructed path to the surface. What they found is that the maneuver can strengthen the radar signal by 10 times or more, offering a much clearer picture of the Martian underground.
But the roll is so large that the spacecraft’s communications antenna is not pointed at Earth, and its solar arrays aren’t able to track the Sun.
“The very large rolls require a special analysis to make sure we’ll have enough power in our batteries to safely do the roll,” Thomas said.
Given the time involved, the mission limits itself to one or two very large rolls a year. But engineers hope to use them more often by streamlining the process.
Learning to Roll With It
While SHARAD scientists are benefiting from these new moves, the team working with another MRO instrument, the Mars Climate Sounder, is making the most of MRO’s standard roll capability.
The JPL-built instrument is a radiometer that serves as one of the most detailed sources available of information on Mars’ atmosphere. Measuring subtle changes in temperature over the course of many seasons, Mars Climate Sounder reveals the inner workings of dust storms and cloud formation. Dust and wind are important to understand: They are constantly reshaping the Martian surface, with wind-borne dust blanketing solar panels and posing a health risk for future astronauts.
Mars Climate Sounder was designed to pivot on a gimbal so that it can get views of the Martian horizon and surface. It also provides views of space, which scientists use to calibrate the instrument. But in 2024, the aging gimbal became unreliable. Now Mars Climate Sounder relies on MRO’s standard rolls.
“Rolling used to restrict our science,” said Mars Climate Sounder’s interim principal investigator, Armin Kleinboehl of JPL, “but we’ve incorporated it into our routine planning, both for surface views and calibration.”
More About MRO
NASA’s Jet Propulsion Laboratory in Southern California manages MRO for the agency’s Science Mission Directorate in Washington as part of its Mars Exploration Program portfolio. The SHARAD instrument was provided by the Italian Space Agency. Its operations are led by Sapienza University of Rome, and its data is analyzed by a joint U.S.-Italian science team. The Planetary Science Institute in Tucson, Arizona, leads U.S. involvement in SHARAD. Lockheed Martin Space in Denver built MRO and supports its operations.
For more information, visit:
science.nasa.gov/mission/mars-reconnaissance-orbiter
News Media Contacts
Andrew Good
Jet Propulsion Laboratory, Pasadena, Calif.
818-393-2433
andrew.c.good@jpl.nasa.govKaren Fox / Molly Wasser
NASA Headquarters, Washington
202-358-1600
karen.c.fox@nasa.gov / molly.l.wasser@nasa.gov2025-084
Share
Details
Last UpdatedJun 26, 2025Related Terms
Explore More
-
NASA Citizen Scientists Find New Eclipsing Binary Stars
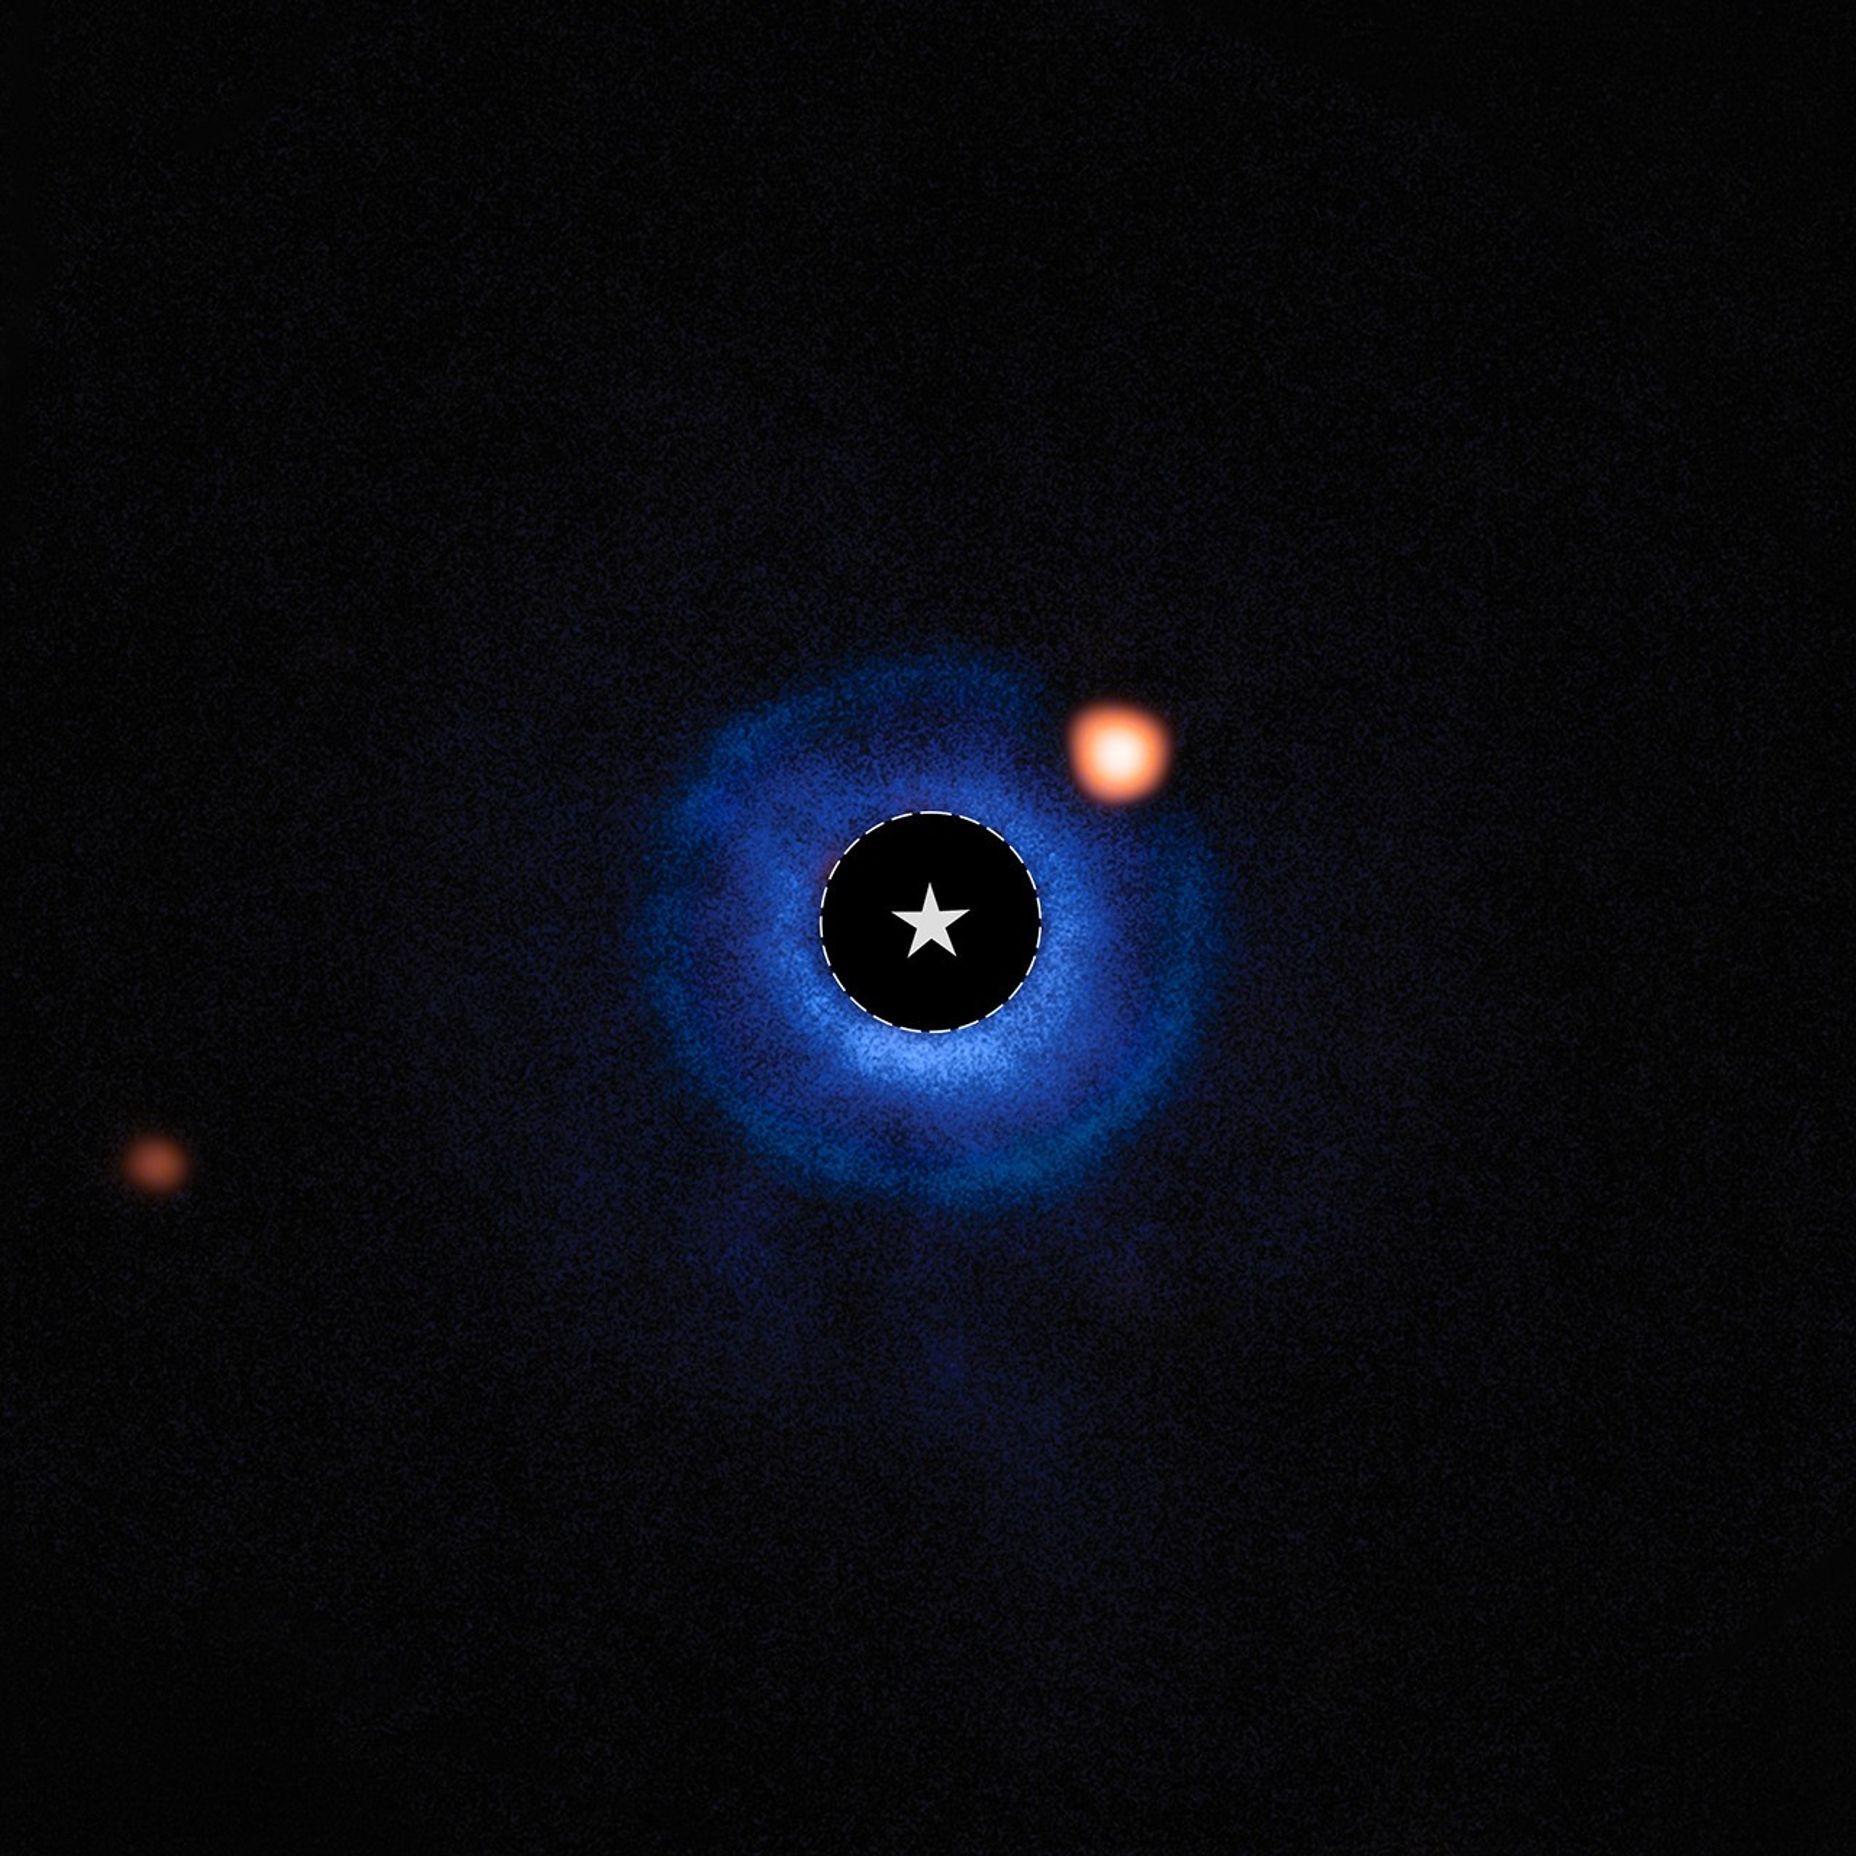
When two stars orbit one another in such a way that one blocks the other’s light each time it swings around, that’s an eclipsing binary. A new paper from NASA’s Eclipsing Binary Patrol citizen science project presents more than 10,000 of these rare pairs – 10,001 to be precise. These objects will help future researchers study the physics and formation of stars and search for new exoplanets.
“Together, humans and computers excel at investigating hundreds of thousands of eclipsing binaries,” said Dr. Veselin Kostov, research scientist at NASA Goddard Space Flight Center and the SETI Institute and lead author of the paper. “I can’t wait to search them for exoplanets!”
To make their catalog, the team examined data from NASA’s Transiting Exoplanet Survey Satellite (TESS), which surveyed nearly the entire sky looking for objects with varying brightness. They used a two-tiered approach, combining the scalability of artificial intelligence with the nuanced judgment of human expertise. First, advanced machine learning methods efficiently sifted through hundreds of millions of targets observed by TESS, identifying hundreds of thousands of promising candidates. Then, humans scrutinized the most interesting systems.
Of the 10,001 objects they listed in their paper, 7,936 are new eclipsing binaries they discovered. The rest were already known, but the team made new measurements of the timing of their eclipses.
You can join the Eclipsing Binary Patrol team too! Just go to the project’s website. Eclipsing Binary stars change in brightness over time as they orbit one another and block each other’s light.Credit: NASA GSFC
Share
Details
Last UpdatedJun 26, 2025Related Terms
-
Meet the Space Ops Team: Derrick Bailey
3 min read
Preparations for Next Moonwalk Simulations Underway (and Underwater)
Since childhood, Derrick Bailey always had an early fascination with aeronautics. Military fighter jet pilots were his childhood heroes, and he dreamed of joining the aerospace industry. This passion was a springboard into his 17-year career at NASA, where Bailey plays an important role in enabling successful rocket launches.
Bailey is the Launch Vehicle Certification Manager in the Launch Services Program (LSP) within the Space Operations Mission Directorate. In this role, he helps NASA outline the agency’s risk classifications of new rockets from emerging and established space companies.
“Within my role, I formulate a series of technical and process assessments for NASA LSP’s technical team to understand how companies operate, how vehicles are designed and qualified, and how they perform in flight,” Bailey said.
Beyond technical proficiency and readiness, a successful rocket launch relies on establishing a strong foundational relationship between NASA and the commercial companies involved. Bailey and his team ensure effective communication with these companies to provide the guidance, data, and analysis necessary to support them in overcoming challenges.
“We work diligently to build trusting relationships with commercial companies and demonstrate the value in partnering with our team,” Bailey said.
Bailey credits a stroke of fate that landed him at the agency. During his senior year at Georgia Tech, where he was pursuing a degree in aerospace engineering, Bailey almost walked past the NASA tent at a career fair. However, he decided to grab a NASA sticker and strike up a conversation, which quickly turned into an impromptu interview. He walked away that day with a job offer to work on the now-retired Space Shuttle Program at the agency’s Kennedy Space Center in Florida.
“I never imagined working at NASA,” Bailey said. “Looking back, it’s unbelievable that a chance encounter resulted in securing a job that has turned into an incredible career.”
Thinking about the future, Bailey is excited about new opportunities in the commercial space industry. Bailey sees NASA as a crucial advisor and mentor for commercial sector while using industry capabilities to provide more cost-effective access to space.
 Derrick Bailey, launch vehicle certification manager for NASA’s Launch Services Program
“We are the enablers,” Bailey said of his role in the directorate. “It is our responsibility to provide the best opportunity for future explorers to begin their journey of discovery in deep space and beyond.”
Outside of work, Bailey enjoys spending time with his family, especially his two sons, who keep him busy with trips to the baseball diamond and homework sessions. Bailey also enjoys hands-on activities, like working on cars, off-road vehicles, and house projects – hobbies he picked up from his mechanically inclined father. Additionally, at the beginning of 2025, his wife accepted a program specialist position with LSP, an exciting development for the entire Bailey family.
“One of my wife’s major observations early on in my career was how much my colleagues genuinely care about one another and empower people to make decisions,” Bailey explained. “These are the things that make NASA the number one place to work in the government.”
NASA’s Space Operations Mission Directorate maintains a continuous human presence in space for the benefit of people on Earth. The programs within the directorate are the hub of NASA’s space exploration efforts, enabling Artemis, commercial space, science, and other agency missions through communication, launch services, research capabilities, and crew support.
To learn more about NASA’s Space Operation Mission Directorate, visit:
https://www.nasa.gov/directorates/space-operations
Share
Details
Last UpdatedJun 26, 2025Related Terms
-
NASA’s Webb Digs into Structural Origins of Disk Galaxies
5 Min ReadNASA’s Webb Digs into Structural Origins of Disk Galaxies
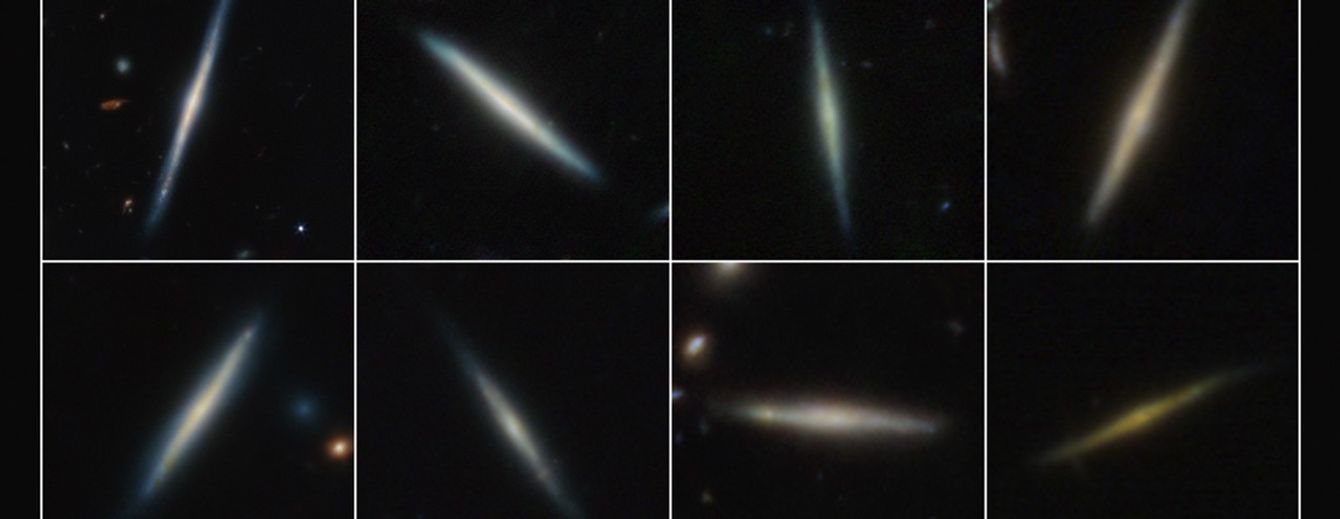
Astronomers pulled from NASA’s James Webb Space Telescope’s data to analyze a sample of 111 edge-on galaxies. The team’s analysis suggests that thick disk formation occurs first, and thin disk formation follows. Full image and caption below. Credits:
NASA, ESA, CSA, T. Tsukui (Australian National University).Present-day disk galaxies often contain a thick, star-filled outer disk and an embedded thin disk of stars. For instance, our own Milky Way galaxy’s thick disk is approximately 3,000 light-years in height, and its thin disk is roughly 1,000 light-years thick.
How and why does this dual disk structure form? By analyzing archival data from multiple observational programs by NASA’s James Webb Space Telescope, a team of astronomers is closer to answers, as well as understanding the origins of disk galaxies in general.
The team carefully identified, visually verified, and analyzed a statistical sample of 111 edge-on disk galaxies at various periods — up to 11 billion years ago (or approximately 2.8 billion years after the big bang). This is the first time scientists have investigated thick- and thin-disk structures spanning such vast distances, bridging the gap between observers probing the early universe and galactic archaeologists seeking to understand our own galaxy’s history.
“This unique measurement of the thickness of the disks at high redshift, or at times in the early universe, is a benchmark for theoretical study that was only possible with Webb,” said Takafumi Tsukui, lead author of the paper and a researcher at the Australian National University in Canberra. “Usually, the older, thick disk stars are faint, and the young, thin disk stars outshine the entire galaxy. But with Webb’s resolution and unique ability to see through dust and highlight faint old stars, we can identify the two-disk structure of galaxies and measure their thickness separately.”
Image: A Sample of Galaxy Disks (NIRCam)
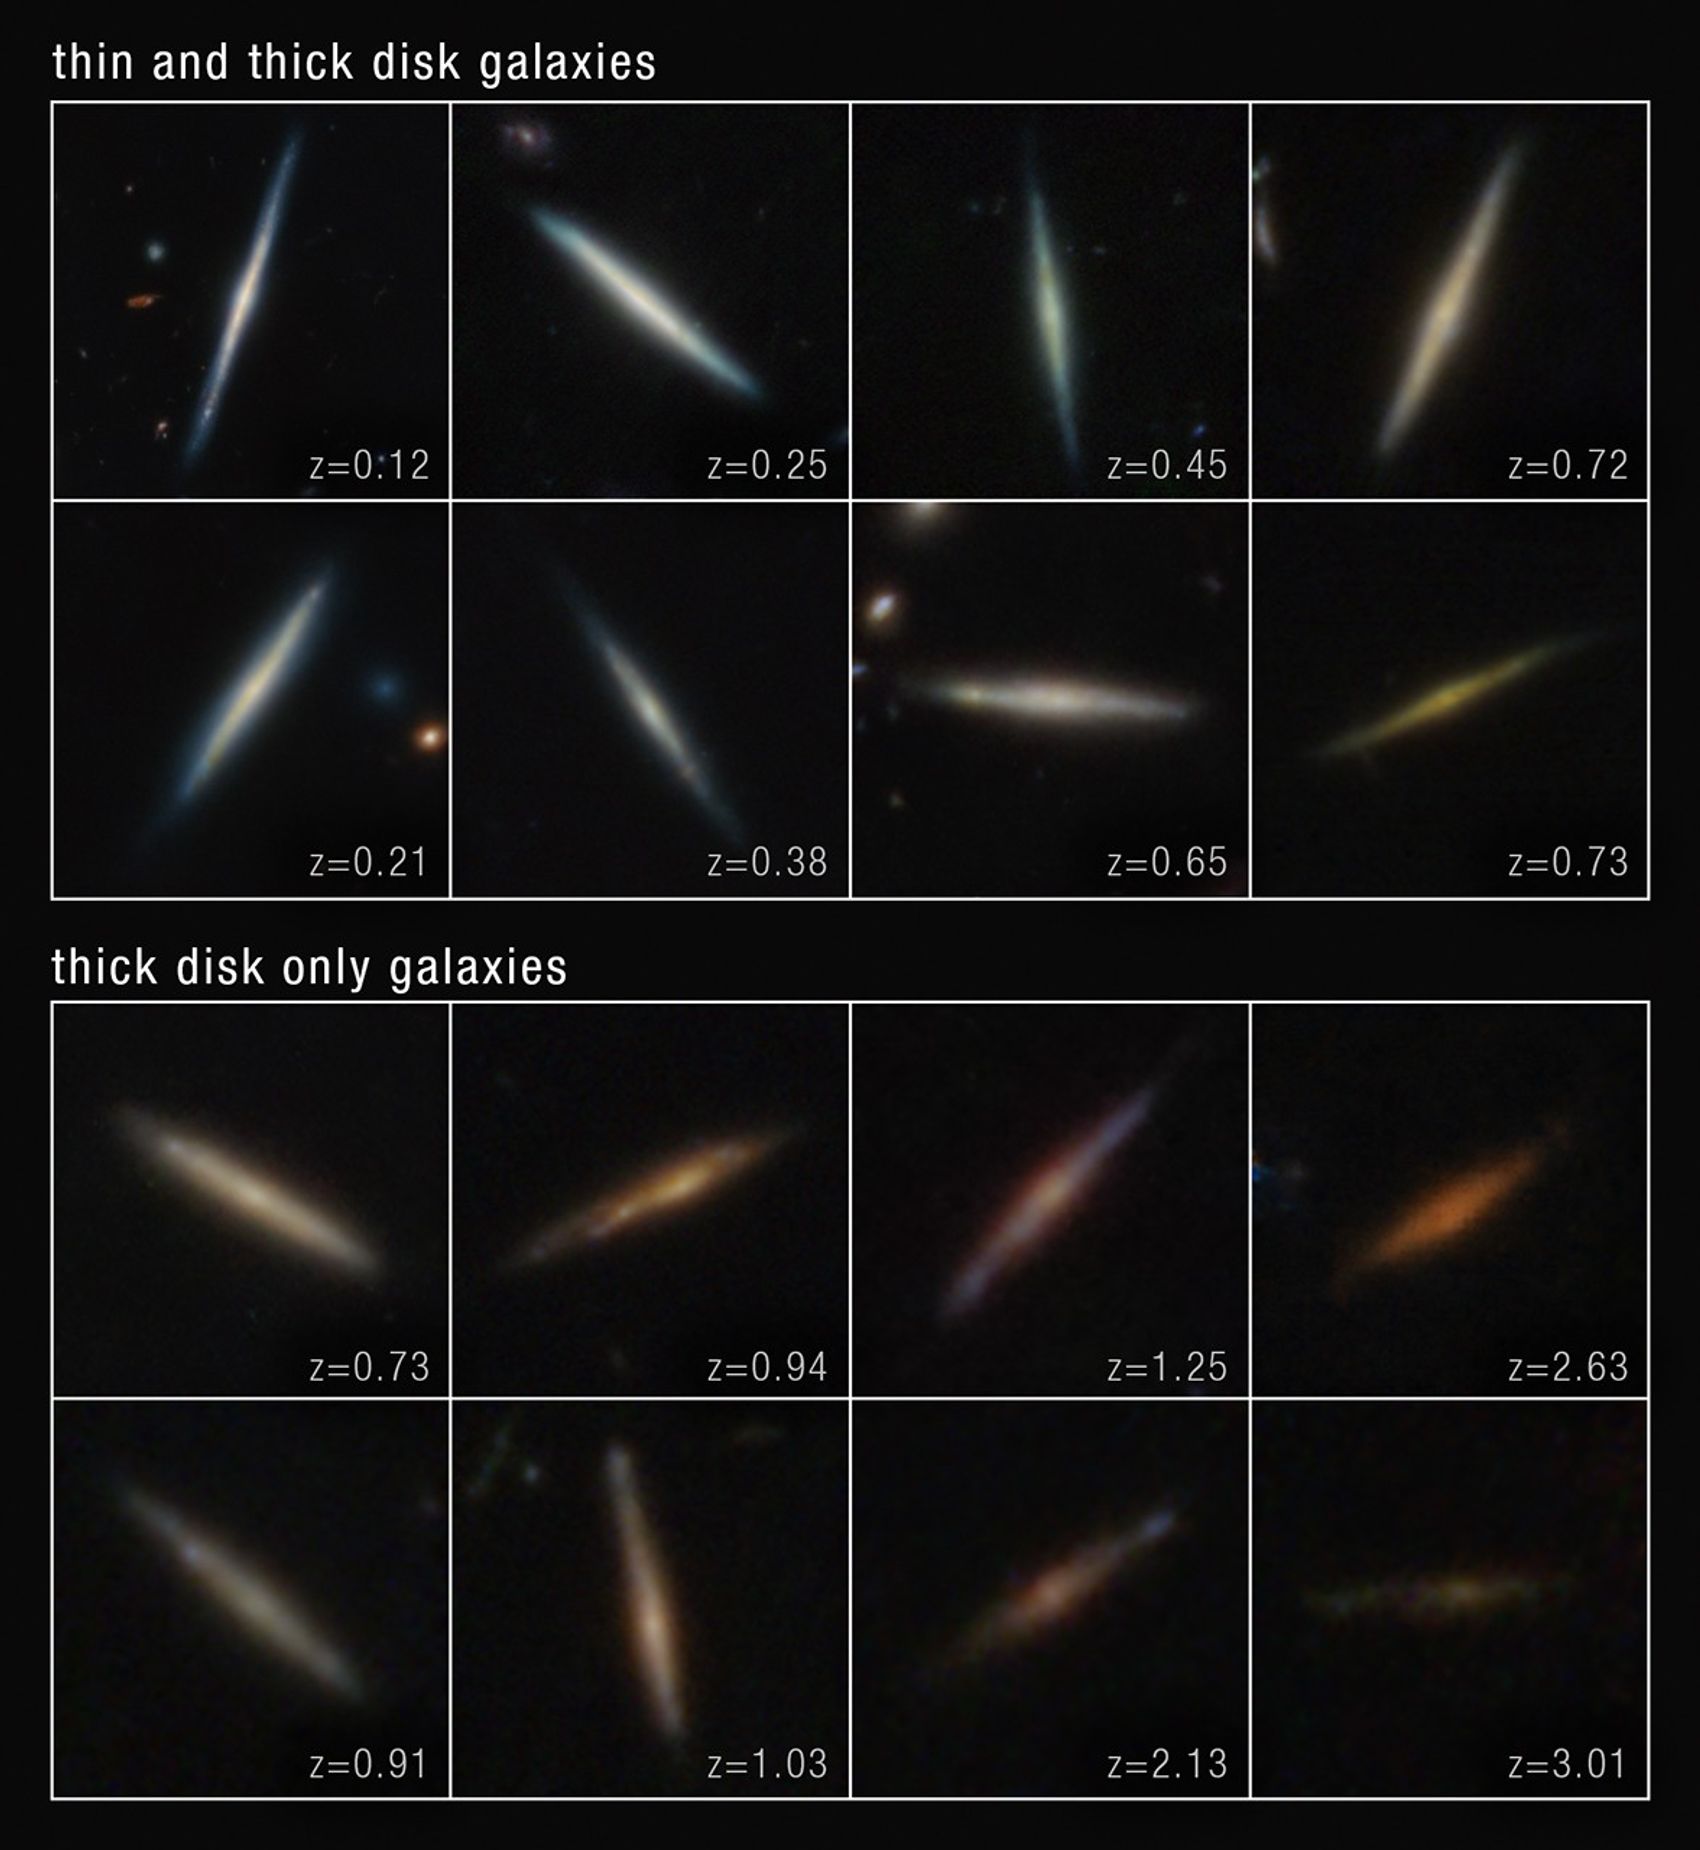 Astronomers pulled from NASA’s James Webb Space Telescope’s data to analyze a sample of 111 edge-on galaxies. The team’s analysis suggests that thick disk formation occurs first, and thin disk formation follows. When this process occurs depends on the galaxy’s mass.NASA, ESA, CSA, T. Tsukui (Australian National University).
Data Through Thick and Thin
By analyzing these 111 targets over cosmological time, the team was able to study single-disk galaxies and double-disk galaxies. Their results indicate that galaxies form a thick disk first, followed by a thin disk. The timing of when this takes place is dependent on the galaxy’s mass: high-mass, single-disk galaxies transitioned to two-disk structures around 8 billion years ago. In contrast, low-mass, single-disk galaxies formed their embedded thin disks later on, about 4 billion years ago.
“This is the first time it has been possible to resolve thin stellar disks at higher redshift. What’s really novel is uncovering when thin stellar disks start to emerge,” said Emily Wisnioski, a co-author of the paper at the Australian National University in Canberra. “To see thin stellar disks already in place 8 billion years ago, or even earlier, was surprising.”
A Turbulent Time for Galaxies
To explain this transition from a single, thick disk to a thick and thin disk, and the difference in timing for high- and low-mass galaxies, the team looked beyond their initial edge-on galaxy sample and examined data showing gas in motion from the Atacama Large Millimeter/submillimeter Array (ALMA) and ground-based surveys.
By taking into consideration the motion of the galaxies’ gas disks, the team finds their results align with the “turbulent gas disk” scenario, one of three major hypotheses that has been proposed to explain the process of thick- and thin-disk formation. In this scenario, a turbulent gas disk in the early universe sparks intense star formation, forming a thick stellar disk. As stars form, they stabilize the gas disk, which becomes less turbulent and, as a result, thinner.
Since massive galaxies can more efficiently convert gas into stars, they settle sooner than their low-mass counterparts, resulting in the earlier formation of thin disks. The team notes that thick- and thin-disk formation are not siloed events: The thick disk continues to grow as the galaxy develops, though it’s slower than the thin disk’s rate of growth.
How This Applies to Home
Webb’s sensitivity is enabling astronomers to observe smaller and fainter galaxies, analogous to our own, at early times and with unprecedented clarity for the first time. In this study, the team noted that the transition period from thick disk to a thick and thin disk roughly coincides with the formation of the Milky Way galaxy’s thin disk. With Webb, astronomers will be able to further investigate Milky Way-like progenitors — galaxies that would have preceded the Milky Way — which could help explain our galaxy’s formation history.
In the future, the team intends to incorporate other data points into their edge-on galaxy sample.
“While this study structurally distinguishes thin and thick disks, there is still much more we would like to explore,” said Tsukui. “We want to add the type of information people usually get for nearby galaxies, like stellar motion, age, and metallicity. By doing so, we can bridge the insights from galaxies near and far, and refine our understanding of disk formation.”
These results were published in the Monthly Notices of the Royal Astronomical Society.
The James Webb Space Telescope is the world’s premier space science observatory. Webb is solving mysteries in our solar system, looking beyond to distant worlds around other stars, and probing the mysterious structures and origins of our universe and our place in it. Webb is an international program led by NASA with its partners, ESA (European Space Agency) and CSA (Canadian Space Agency).
To learn more about Webb, visit:
Downloads
Click any image to open a larger version.
View/Download all image products at all resolutions for this article from the Space Telescope Science Institute.
View/Download the research results from the Monthly Notices of the Royal Astronomical Society.
Media Contacts
Laura Betz – laura.e.betz@nasa.gov
NASA’s Goddard Space Flight Center, Greenbelt, Md.Abigail Major – amajor@stsci.edu
Space Telescope Science Institute, Baltimore, Md.Hannah Braun – hbraun@stsci.edu
Space Telescope Science Institute, Baltimore, Md.Related Information
Article: Types of Galaxies
Video: Celestial Tour: Different types of galaxies
Article: Learn more about Webb’s views of nearby spiral galaxies
Visualization Video: Galaxy Traverse
Related For Kids
En Español
Share
Related Terms
-
NASA, Australia Team Up for Artemis II Lunar Laser Communications Test
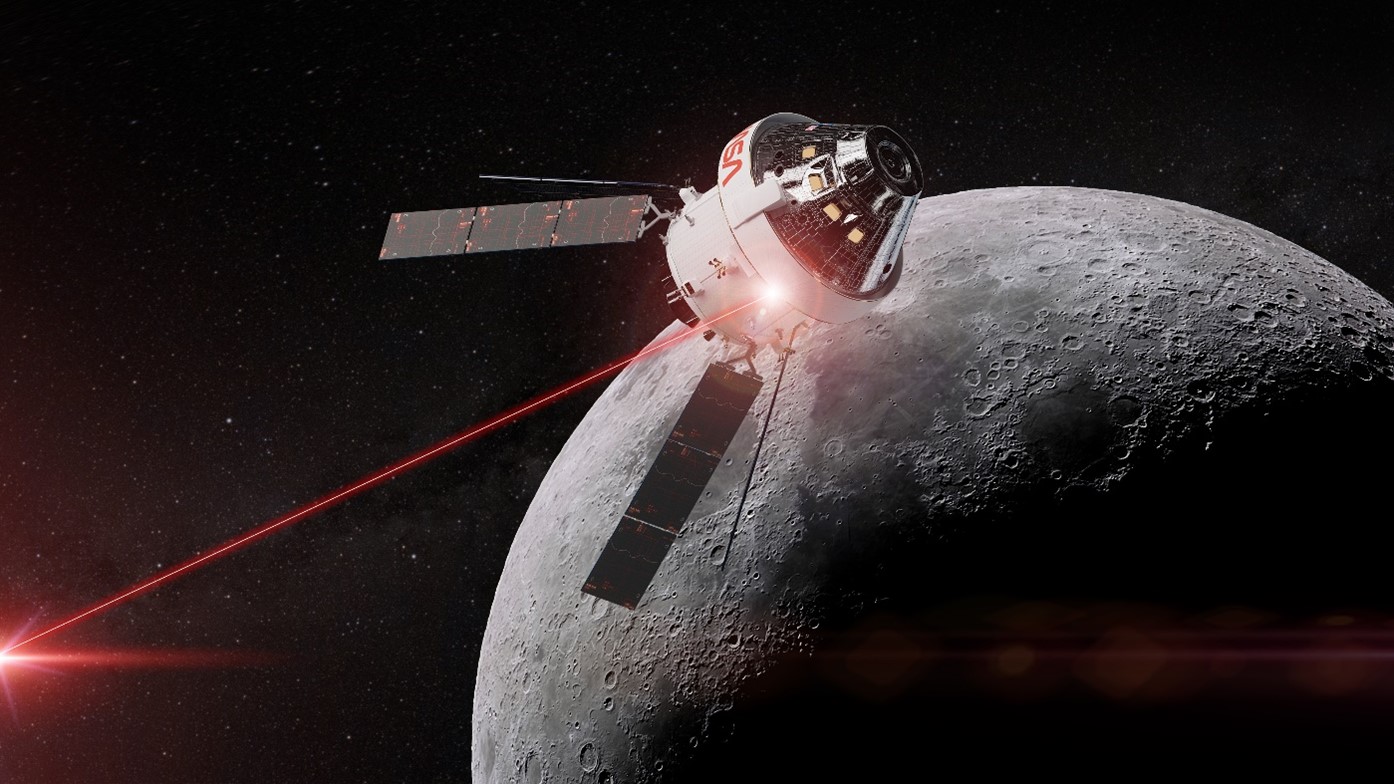
 An artist’s concept of NASA’s Orion spacecraft orbiting the Moon while using laser communications technology through the Orion Artemis II Optical Communications System.Credit: NASA/Dave Ryan
As NASA prepares for its Artemis II mission, researchers at the agency’s Glenn Research Center in Cleveland are collaborating with The Australian National University (ANU) to prove inventive, cost-saving laser communications technologies in the lunar environment.
Communicating in space usually relies on radio waves, but NASA is exploring laser, or optical, communications, which can send data 10 to 100 times faster to the ground. Instead of radio signals, these systems use infrared light to transmit high-definition video, picture, voice, and science data across vast distances in less time. NASA has proven laser communications during previous technology demonstrations, but Artemis II will be the first crewed mission to attempt using lasers to transmit data from deep space.
To support this effort, researchers working on the agency’s Real Time Optical Receiver (RealTOR) project have developed a cost-effective laser transceiver using commercial-off-the-shelf parts. Earlier this year, NASA Glenn engineers built and tested a replica of the system at the center’s Aerospace Communications Facility, and they are now working with ANU to build a system with the same hardware models to prepare for the university’s Artemis II laser communications demo.
“Australia’s upcoming lunar experiment could showcase the capability, affordability, and reproducibility of the deep space receiver engineered by Glenn,” said Jennifer Downey, co-principal investigator for the RealTOR project at NASA Glenn. “It’s an important step in proving the feasibility of using commercial parts to develop accessible technologies for sustainable exploration beyond Earth.”
During Artemis II, which is scheduled for early 2026, NASA will fly an optical communications system aboard the Orion spacecraft, which will test using lasers to send data across the cosmos. During the mission, NASA will attempt to transmit recorded 4K ultra-high-definition video, flight procedures, pictures, science data, and voice communications from the Moon to Earth.
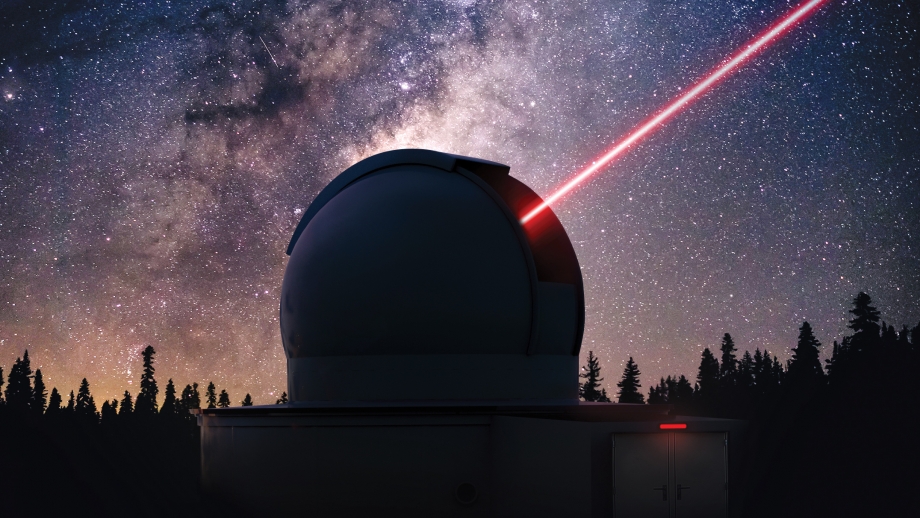
 An artist’s concept of the optical communications ground station at Mount Stromlo Observatory in Canberra, Australia, using laser communications technology.Credit: The Australian National University
Nearly 10,000 miles from Cleveland, ANU researchers working at the Mount Stromlo Observatory ground station hope to receive data during Orion’s journey around the Moon using the Glenn-developed transceiver model. This ground station will serve as a test location for the new transceiver design and will not be one of the mission’s primary ground stations. If the test is successful, it will prove that commercial parts can be used to build affordable, scalable space communication systems for future missions to the Moon, Mars, and beyond.
“Engaging with The Australian National University to expand commercial laser communications offerings across the world will further demonstrate how this advanced satellite communications capability is ready to support the agency’s networks and missions as we set our sights on deep space exploration,” said Marie Piasecki, technology portfolio manager for NASA’s Space Communications and Navigation (SCaN) Program.
As NASA continues to investigate the feasibility of using commercial parts to engineer ground stations, Glenn researchers will continue to provide critical support in preparation for Australia’s demonstration.
Strong global partnerships advance technology breakthroughs and are instrumental as NASA expands humanity’s reach from the Moon to Mars, while fueling innovations that improve life on Earth. Through Artemis, NASA will send astronauts to explore the Moon for scientific discovery, economic benefits, and build the foundation for the first crewed missions to Mars.
 The Real Time Optical Receiver (RealTOR) team poses for a group photo in the Aerospace Communications Facility at NASA’s Glenn Research Center in Cleveland on Friday, Dec. 13, 2024. From left to right: Peter Simon, Sarah Tedder, John Clapham, Elisa Jager, Yousef Chahine, Michael Marsden, Brian Vyhnalek, and Nathan Wilson.Credit: NASA
The RealTOR project is one aspect of the optical communications portfolio within NASA’s SCaN Program, which includes demonstrations and in-space experiment platforms to test the viability of infrared light for sending data to and from space. These include the LCOT (Low-Cost Optical Terminal) project, the Laser Communications Relay Demonstration, and more. NASA Glenn manages the project under the direction of agency’s SCaN Program at NASA Headquarters in Washington.
The Australian National University’s demonstration is supported by the Australian Space Agency Moon to Mars Demonstrator Mission Grant program, which has facilitated operational capability for the Australian Deep Space Optical Ground Station Network.
To learn how space communications and navigation capabilities support every agency mission, visit:
-
NASA’s Chandra Shares a New View of Our Galactic Neighbor
6 Min ReadNASA’s Chandra Shares a New View of Our Galactic Neighbor

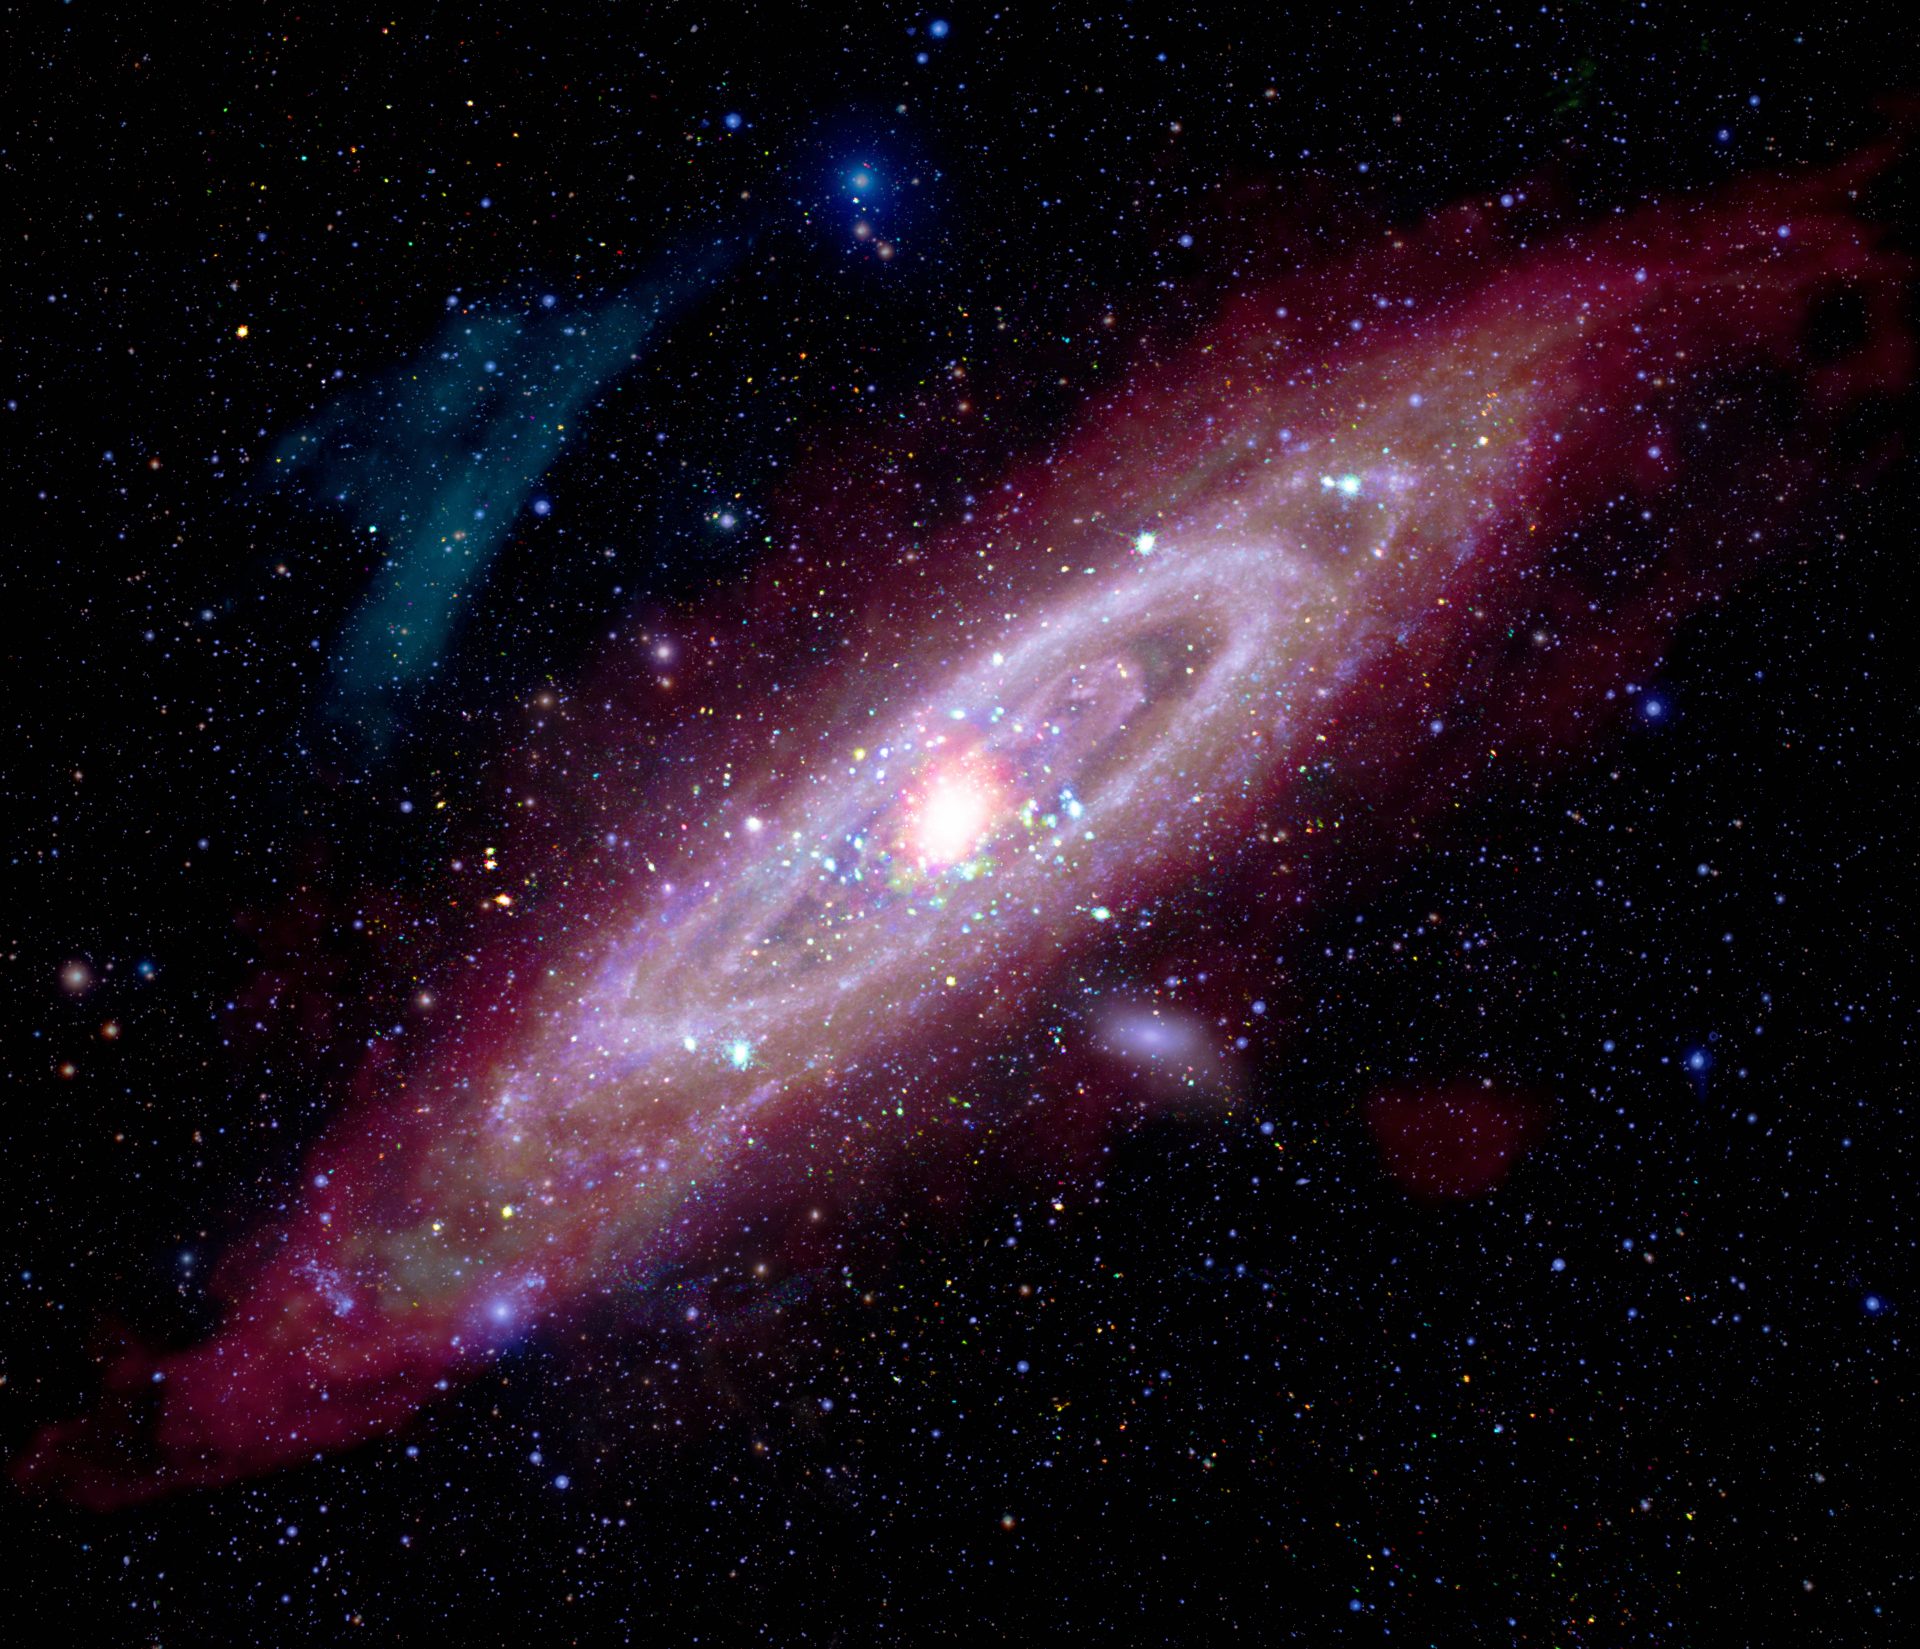
The Andromeda galaxy, also known as Messier 31 (M31), is the closest spiral galaxy to the Milky Way at a distance of about 2.5 million light-years. Astronomers use Andromeda to understand the structure and evolution of our own spiral, which is much harder to do since Earth is embedded inside the Milky Way.
The galaxy M31 has played an important role in many aspects of astrophysics, but particularly in the discovery of dark matter. In the 1960s, astronomer Vera Rubin and her colleagues studied M31 and determined that there was some unseen matter in the galaxy that was affecting how the galaxy and its spiral arms rotated. This unknown material was named “dark matter.” Its nature remains one of the biggest open questions in astrophysics today, one which NASA’s upcoming Nancy Grace Roman Space Telescope is designed to help answer.
 X-ray: NASA/CXO/UMass/Z. Li & Q.D. Wang, ESA/XMM-Newton; Infrared: NASA/JPL-Caltech/WISE, Spitzer, NASA/JPL-Caltech/K. Gordon (U. Az), ESA/Herschel, ESA/Planck, NASA/IRAS, NASA/COBE; Radio: NSF/GBT/WSRT/IRAM/C. Clark (STScI); Ultraviolet: NASA/JPL-Caltech/GALEX; Optical: Andromeda, Unexpected © Marcel Drechsler, Xavier Strottner, Yann Sainty & J. Sahner, T. Kottary. Composite image processing: L. Frattare, K. Arcand, J.Major
This new composite image contains data of M31 taken by some of the world’s most powerful telescopes in different kinds of light. This image includes X-rays from NASA’s Chandra X-ray Observatory and ESA’s (European Space Agency’s) XMM-Newton (represented in red, green, and blue); ultraviolet data from NASA’s retired GALEX (blue); optical data from astrophotographers using ground based telescopes (Jakob Sahner and Tarun Kottary); infrared data from NASA’s retired Spitzer Space Telescope, the Infrared Astronomy Satellite, COBE, Planck, and Herschel (red, orange, and purple); and radio data from the Westerbork Synthesis Radio Telescope (red-orange).
The Andromeda Galaxy (M31) in Different Types of Light.X-ray: NASA/CXO/UMass/Z. Li & Q.D. Wang, ESA/XMM-Newton; Infrared: NASA/JPL-Caltech/WISE, Spitzer, NASA/JPL-Caltech/K. Gordon (U. Az), ESA/Herschel, ESA/Planck, NASA/IRAS, NASA/COBE; Radio: NSF/GBT/WSRT/IRAM/C. Clark (STScI); Ultraviolet: NASA/JPL-Caltech/GALEX; Optical: Andromeda, Unexpected © Marcel Drechsler, Xavier Strottner, Yann Sainty & J. Sahner, T. Kottary. Composite image processing: L. Frattare, K. Arcand, J.MajorEach type of light reveals new information about this close galactic relative to the Milky Way. For example, Chandra’s X-rays reveal the high-energy radiation around the supermassive black hole at the center of M31 as well as many other smaller compact and dense objects strewn across the galaxy. A recent paper about Chandra observations of M31 discusses the amount of X-rays produced by the supermassive black hole in the center of the galaxy over the last 15 years. One flare was observed in 2013, which appears to represent an amplification of the typical X-rays seen from the black hole.
These multi-wavelength datasets are also being released as a sonification, which includes the same wavelengths of data in the new composite. In the sonification, the layer from each telescope has been separated out and rotated so that they stack on top of each other horizontally, beginning with X-rays at the top and then moving through ultraviolet, optical, infrared, and radio at the bottom. As the scan moves from left to right in the sonification, each type of light is mapped to a different range of notes, from lower-energy radio waves up through the high energy of X-rays. Meanwhile, the brightness of each source controls volume, and the vertical location dictates the pitch.
In this sonification of M31, the layers from each telescope has been separated out and rotated so that they stack on top of each other horizontally beginning with X-rays at the top and then moving through ultraviolet, optical, infrared, and radio at the bottom. As the scan moves from left to right in the sonification, each type of light is mapped to a different range of notes ranging from lower-energy radio waves up through the high-energy of X-rays. Meanwhile, the brightness of each source controls volume and the vertical location dictates the pitch.NASA/CXC/SAO/K.Arcand, SYSTEM Sounds (M. Russo, A. SantaguidaThis new image of M31 is released in tribute to the groundbreaking legacy of Dr. Vera Rubin, whose observations transformed our understanding of the universe. Rubin’s meticulous measurements of Andromeda’s rotation curve provided some of the earliest and most convincing evidence that galaxies are embedded in massive halos of invisible material — what we now call dark matter. Her work challenged long-held assumptions and catalyzed a new era of research into the composition and dynamics of the cosmos. In recognition of her profound scientific contributions, the United States Mint has recently released a quarter in 2025 featuring Rubin as part of its American Women Quarters Program — making her the first astronomer honored in the series.
NASA’s Marshall Space Flight Center in Huntsville, Alabama, manages the Chandra program. The Smithsonian Astrophysical Observatory’s Chandra X-ray Center controls science operations from Cambridge, Massachusetts, and flight operations from Burlington, Massachusetts.
Learn more about the Chandra X-ray Observatory and its mission here:
Visual Description
This release features several images and a sonification video examining the Andromeda galaxy, our closest spiral galaxy neighbor. This collection helps astronomers understand the evolution of the Milky Way, our own spiral galaxy, and provides a fascinating insight into astronomical data gathering and presentation.
Like all spiral galaxies viewed at this distance and angle, Andromeda appears relatively flat. Its spiraling arms circle around a bright core, creating a disk shape, like a large dinner plate. In most of the images in this collection, Andromeda’s flat surface is tilted to face our upper left.
This collection features data from some of the world’s most powerful telescopes, each capturing light in a different spectrum. In each single-spectrum image, Andromeda has a similar shape and orientation, but the colors and details are dramatically different.
In radio waves, the spiraling arms appear red and orange, like a burning, loosely coiled rope. The center appears black, with no core discernible. In infrared light, the outer arms are similarly fiery. Here, a white spiraling ring encircles a blue center with a small golden core. The optical image is hazy and grey, with spiraling arms like faded smoke rings. Here, the blackness of space is dotted with specks of light, and a small bright dot glows at the core of the galaxy. In ultraviolet light the spiraling arms are icy blue and white, with a hazy white ball at the core. No spiral arms are present in the X-ray image, making the bright golden core and nearby stars clear and easy to study.
In this release, the single-spectrum images are presented side by side for easy comparison. They are also combined into a composite image. In the composite, Andromeda’s spiraling arms are the color of red wine near the outer edges, and lavender near the center. The core is large and bright, surrounded by a cluster of bright blue and green specks. Other small flecks in a variety of colors dot the galaxy, and the blackness of space surrounding it.
This release also features a thirty second video, which sonifies the collected data. In the video, the single-spectrum images are stacked vertically, one atop the other. As the video plays, an activation line sweeps across the stacked images from left to right. Musical notes ring out when the line encounters light. The lower the wavelength energy, the lower the pitches of the notes. The brighter the source, the louder the volume.
News Media Contact
Megan Watzke
Chandra X-ray Center
Cambridge, Mass.
617-496-7998
mwatzke@cfa.harvard.eduLane Figueroa
Marshall Space Flight Center, Huntsville, Alabama
256-544-0034
lane.e.figueroa@nasa.govShare
Details
Last UpdatedJun 25, 2025EditorLee MohonContactLane FigueroaRelated Terms
Explore More
-
NASA Astronauts to Answer Questions from Alabama Students
 NASA astronaut Nichole Ayers conducts research operations inside the Destiny laboratory module’s Microgravity Science Glovebox aboard the International Space Station.Credit: NASA
Students attending the U.S. Space and Rocket Center Space Camp in Huntsville, Alabama, will have the chance to hear NASA astronauts aboard the International Space Station answer their prerecorded questions.
At 12:40 p.m. EDT on Tuesday, July 1, NASA astronauts Anne McClain, Jonny Kim, and Nichole Ayers will answer student questions. Ayers is a space camp alumna.
Watch the 20-minute Earth-to-space call on the NASA STEM YouTube Channel.
The U.S. Space and Rocket Center will host the downlink while celebrating the 65th anniversary of NASA’s Marshall Space Flight Center. This event is open to the public.
Media interested in covering the event must RSVP by 5 p.m., Friday, June 27, to Pat Ammons at: 256-721-5429 or pat.ammons@spacecamp.com.
For nearly 25 years, astronauts have continuously lived and worked aboard the space station, testing technologies, performing science, and developing skills needed to explore farther from Earth. Astronauts aboard the orbiting laboratory communicate with NASA’s Mission Control Center in Houston 24 hours a day through SCaN’s (Space Communications and Navigation) Near Space Network.
Important research and technology investigations taking place aboard the space station benefit people on Earth and lay the groundwork for other agency missions. As part of NASA’s Artemis campaign, the agency will send astronauts to the Moon to prepare for future human exploration of Mars; inspiring Golden Age explorers and ensuring the United States continues to lead in space exploration and discovery.
See videos of astronauts aboard the space station at:
https://www.nasa.gov/stemonstation
-end-
Gerelle Dodson
Headquarters, Washington
202-358-1600
gerelle.q.dodson@nasa.govSandra Jones
Johnson Space Center, Houston
281-483-5111
sandra.p.jones@nasa.gov -

Waning Crescent Moon
NASA astronaut Bob Hines took this picture of the waning crescent moon on May 8, 2022, as the International Space Station flew into an orbital sunrise 260 miles above the Atlantic Ocean off the northwest coast of the United States.
-
Waning Crescent Moon
 NASA/Bob Hines
NASA astronaut Bob Hines took this picture of the waning crescent moon on May 8, 2022, as the International Space Station flew into an orbital sunrise 260 miles above the Atlantic Ocean off the northwest coast of the United States. Since the station became operational in November 2000, crew members have produced hundreds of thousands of images of our Moon and Earth through Crew Earth Observations.
Image credit: NASA/Bob Hines
-
NASA-Assisted Scientists Get Bird’s-Eye View of Population Status
4 min read
NASA-Assisted Scientists Get Bird’s-Eye View of Population Status
Through the eBird citizen scientist program, millions of birders have recorded their observations of different species and submitted checklists to the Cornell Lab of Ornithology. Through a partnership with NASA, the lab has now used this data to model and map bird population trends for nearly 500 North American species.
Led by Alison Johnston of the University of St. Andrews in Scotland, the researchers reported that 75% of bird species in the study are declining at wide-range scales. And yet this study has some good news for birds. The results, published in Science in May, offer insights and projections that could shape the future conservation of the places where birds make their homes.
“This project demonstrates the power of merging in situ data with NASA remote sensing to model biological phenomena that were previously impossible to document,” said Keith Gaddis, NASA’s Biological Diversity and Ecological Forecasting program manager at the agency’s headquarters in Washington, who was not involved in the study. “This data provides not just insight into the Earth system but also provides actionable guidance to land managers to mitigate biodiversity loss.”
 Rock wren in Joshua Tree National Park.National Park Service / Jane Gamble
A team from Cornell, the University of St. Andrews, and the American Bird Conservancy used land imaging data from NASA’s Moderate Resolution Imaging Spectroradiometer (MODIS) instruments to distinguish among such specific bird habitats as open forests, dense shrublands, herbaceous croplands, and forest/cropland mosaics. They also drew on NASA weather information and water data that matched the dates and times when birders made their reports.
When combined with a 14-year set of eBird checklists — 36 million sets of species observations and counts, keyed directly to habitats — the satellite data gave researchers almost a strong foundation to produce a clear picture of the health of bird populations. But there was one missing piece.
Wrestling with Wren Data
While some eBird checklists come from expert birders who’ve hiked deep into wildlife preserves, others are sent in by novices watching bird feeders and doing the dishes. This creates what Cornell statistician Daniel Fink described as “an unstructured, very noisy data set,” complete with gaps in the landscape that birders did not reach and, ultimately, some missing birds.
To account for gaps where birds weren’t counted, the researchers trained machine learning models to fill in the maps based on the remote sensing data. “For every single species — say the rock wren — we’ve created a simulation that mimics the species and a variety of ways that it could respond to changes in the environment,” Johnston said. “Thousands of simulations underlie the results we showed.”
 CornellLab eBird
The researchers achieved unprecedented resolution, zeroing in on areas 12 miles by 12 miles (27 km by 27 km), the same area as Portland, Oregon. This new population counting method can also be applied to eBird data from other locations, Fink said. “Now we’re using modeling to track bird populations — not seasonally through the year, but acrossthe years — a major milestone,” he added.
“We’ve been able to take citizen science data and, through machine learning methodology, put it on the same footing as traditionally structured surveys, in terms of the type of signal we can find,” said Cornell science product manager Tom Auer. “It will increase the credibility and confidence of people who use this information for precise conservation all over the globe.”
The Up Side
Since 1970, North America has lost one-quarter of its breeding birds, following a global trend of declines across species. The causes range from increased pollution and land development to changing climate and decreased food resources. Efforts to reverse this loss depend on identifying the areas where birds live at highest risk, assessing their populations, and pinpointing locations where conservation could help most.
For 83% of the reported species in the new study, the decline was greatest in spots where populations had previously been most abundant — indicating problems with the habitat.
“Even in species where populations are declining a lot, there are still places of hope, where the populations are going up,” Johnston said. The team found population increases in the maps of 97% of the reported species. “That demonstrates that there’s opportunity for those species.”
“Birds face so many challenges,” said Cornell conservationist Amanda Rodewald. “This research will help us make strategic decisions about making changes that are precise, effective, and less costly. This is transformative. Now we can really drill in and know where specifically we’re going to be able to have the most positive impact in trying to stem bird declines.”
NASA Headquarters, Washington
Share
Details
Last UpdatedJun 25, 2025Related Terms
Explore More